Attention-deficit/hyperactivity disorder (ADHD) is one of the most common child neurodevelopmental disorders with symptoms in two essential areas: attention and activity, affecting about 3.4% of children and adolescents worldwide (Polanczyk, Salum, Sugaya, Caye, & Rohde, Reference Polanczyk, Salum, Sugaya, Caye and Rohde2015). ADHD symptoms manifest as an impaired ability to sustain attention and inhibit impulsive/hyperactive behavior, respectively (Barkley, Reference Barkley2003). These symptoms arise in childhood, with DSM-IV requiring symptoms present by age 7 (American Psychiatric Association, 1994) and DSM-5 extending the age of onset up to age 12 (American Psychiatric Association, 2013). Follow-up studies of children with ADHD into adolescence show that, although the symptoms of ADHD may shift to better adapted ranges with the onset of puberty, 70%–85% of diagnosed children have continued issues with attention and activity levels during adolescence (Barkley, Fischer, Edelbrock, & Smallish, Reference Barkley, Fischer, Edelbrock and Smallish1990; Biederman et al., Reference Biederman, Faraone, Milberger, Curtis, Chen and Marrs1996; Centers for Disease Control and Prevention, 2005; Pingault et al., Reference Pingault, Viding, Galera, Greven, Zheng and Plomin2015). Thus, it is very important to study the genetic etiology of ADHD development in adolescence.
Attention and activity are two continua expressed quantitatively from the well-adapted end to the extremely abnormal end in the general population (Levy, Hay, McStephen, Wood, & Waldman, Reference Levy, Hay, McStephen, Wood and Waldman1997). A dimensional description of attention and activity is in line with the research domain criteria initiative that aims at developing, for research purposes, new ways of classifying mental disorders based on behavioral dimensions and neurobiological measures (Cuthbert, Reference Cuthbert2014). Attention is included as one of the core constructs of the cognitive systems domain, while activity (and its regulation) maps well onto another construct of the same domain, cognitive (effortful) control. A dimensional description of psychopathology also presents significant advantages for genetic studies, such as greater power to identify specific genetic variants; therefore, it is crucial that research studies consider a full range of variation in phenotypic manifestation of attention and activity for investigating the nature of ADHD (van der Sluis, Posthuma, Nivard, Verhage, & Dolan, Reference van der Sluis, Posthuma, Nivard, Verhage and Dolan2013). Avoiding an artificial restriction of the range of variance in the underlying liability existing in the general population may help shed light on the processes underlying developmental shifts in ADHD from dysregulation to highly adaptive behaviors. Unfortunately, the “adaptive ends” of these full range continua of attention and activity in the general population have been largely neglected.
Most previous twin studies on ADHD, which have generally focused on the symptomatic portions of these dimensions by using behavior rating scales, have reported substantial heritability estimates for inattention (31% to 82%) and hyperactivity/impulsivity (36% to 88%) (Chang, Lihtenstein, Asherson, & Larsson, Reference Chang, Lichtenstein, Asherson and Larsson2013; Freitag, Rohde, Lempp, & Romanos, Reference Freitag, Rohde, Lempp and Romanos2010; Greven, Rijsdijk, & Plomin, Reference Greven, Asherson, Rijsdijk and Plomin2011; McLoughlin, Ronald, Kuntsi, Asherson, & Plomin, Reference McLoughlin, Ronald, Kuntsi, Asherson and Plomin2007; Pingault et al., Reference Pingault, Viding, Galera, Greven, Zheng and Plomin2015; Swanson et al., Reference Swanson, Posner, Fusella, Wasdell, Sommer and Fan2001; Thapar, Harrington, Ross, & McGuffin, Reference Thapar, Harrington, Ross and McGuffin2000). Even though it has been suggested that their manifestations are affected by interplay of multiple genetic and environmental factors that provide either risk or protection during development (Thapar, Langley, Asherson, & Gill, Reference Thapar, Langley, Asherson and Gill2007), polygenic liability studies should not be limited to the symptomatic direction only, because the effects of single genes on behavior may manifest themselves not only in the problematic range but also in the adaptive, normative range (Flint, Reference Flint1998).
Cross-sectional twin research using continuous measures provided by the Strengths and Weaknesses of Attention-Deficit/Hyperactivity Disorder Symptoms and Normal Behavior Scale (SWAN) reported heritability estimates of 0.82 and 0.89 for attention and 0.31 and 0.90 for activity (Hay, Bennett, Levy, Sergeant, & Swanson, Reference Hay, Bennett, Levy, Sergeant and Swanson2007; Polderman et al., Reference Polderman, Derks, Hudziak, Verhulst, Posthuma and Boomsma2007). Hay et al. (Reference Hay, Bennett, Levy, Sergeant and Swanson2007) found significant shared environmental contribution that explained 53%–66% of the variability for activity in both study groups (6–9 and 12–20 years old), and 28% of the variability for attention in younger age group. However, shared environmental influences have rarely been observed in previous ADHD genetic studies using measures that focused on the symptomatic end (Brikell, Kuja-Halkola, & Larsson, Reference Brikell, Kuja-Halkola and Larsson2015; Burt, Reference Burt2009; Burt, Larsson, Lichtenstein, & Klump, Reference Burt, Larsson, Lichtenstein and Klump2012; Posthuma & Polderman, Reference Posthuma and Polderman2013).
Previous developmental studies focusing on the symptomatic end of ADHD have reported substantial stability of individual differences in inattention and hyperactivity/impulsivity across development, which was accounted for primarily by genetic factors, whereas developmental changes were mostly attributed to environmental influences (Costello, Copeland, & Angold, Reference Costello, Copeland and Angold2011; Kan et al., Reference Kan, Dolan, Nivard, Middeldorp, van Beijsterveldt and Willemsen2013; Kuntsi, Rijsdijk, Ronald, Asherson, & Plomin, Reference Kuntsi, Rijsdijk, Ronald, Asherson and Plomin2005; Ramtekkar, Reiersen, Todorov, & Todd, Reference Ramtekkar, Reiersen, Todorov and Todd2010; Reiersen, Reference Reiersen2005; Todd et al., Reference Todd, Huang, Todorov, Neuman, Reiersen and Henderson2008). Longitudinal twin studies suggest continuity of genetic influences on ADHD symptoms; that is, some of the genes that influence ADHD symptom dimensions at an early age continue to operate in later age (Chang et al., Reference Chang, Lichtenstein, Asherson and Larsson2013; Greven, Ashersen, Rijsdijk, & Plomin, Reference Greven, Asherson, Rijsdijk and Plomin2011; Kuntsi et al., Reference Kuntsi, Rijsdijk, Ronald, Asherson and Plomin2005; Nadder, Rutter, Silberg, Maes, & Eaves, Reference Nadder, Rutter, Silberg, Maes and Eaves2002; Price et al., Reference Price, Simonoff, Asherson, Curran, Kuntsi and Waldman2005; Saudino & Cherny, Reference Saudino and Cherny2001) including the adolescent period (Larsson, Lichtenstein, & Larsson, Reference Larsson, Lichtenstein and Larsson2006; Larsson, Larsson, & Lichtenstein, Reference Larsson, Larsson and Lichtenstein2004).
However, these studies were mainly confined to the symptomatic end. To our knowledge, no previous longitudinal studies have investigated the familial influences on the full range of variability of attention and activity, using a developmental, genetically sensitive design. The present study is the first to investigate the contributions of genetic and environmental influences to the stability and changes of attention and activity during adolescence based on their full-range variability. We hypothesized that continuous, full-range measures of attention and activity are strongly influenced by stable and enduring genetic and environmental factors that are transmitted from prior ages (vs. those that are transient and period specific) and account for developmental stability of individual differences along these two dimensions. We further hypothesized that developmental change is brought by new genetic and environmental influences that enter at each age.
Method
Subjects
The present data were collected as part of a larger study of genetics, neurocognition, and adolescent substance abuse, a population-based, longitudinal cohort sequential study of adolescent twins involving biannual laboratory visits. Twin pairs were recruited through the Missouri Family Registry (a database of twin pairs from a population-based twin registry in the state of Missouri), which has a demographic composition that is broadly representative of the local population. The present analyses utilize data from a subset of twin pairs for whom maternal reports of twin behavior were available. Maternal reports of twin attention and activity were available for both members of 217 twin pairs at age 12 (122 monozygotic [MZ], 95 dizygotic [DZ] pairs), for 294 twin pairs at age 14 (140 MZ, 154 DZ pairs), and for 184 pairs at age 16 (88 MZ, 96 DZ pairs). Data from a total of 339 twin pairs were included, with data available at all three ages for 75 pairs, at two ages for 206 pairs (N = 104 at ages 12 and 14, N = 92 at ages 14 and 16, and N = 10 at ages 12 and 16), and at a single age for 58 pairs (N = 28 at age 12, N = 23 at age 14, and N = 7 at age 16 exclusively). The retention rate for the 14-year-old phase was above 80%, but a significant drop in the number of 16-year-old participants was caused by a gap in funding. Because SWAN was added to the assessment battery when baseline assessments had already been in progress, the number of participants at age 14 (first follow-up) is larger than at age 12 (baseline; sample characteristics are listed in Table 1). Zygosity for these twin pairs was determined using genotyping on 160 DNA markers. Parents signed an informed consent form as approved by the institutional review board of Washington University School of Medicine. Mothers completed the SWAN while their children performed psychological tasks.
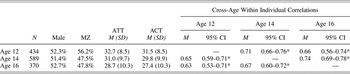
Sample characteristics and cross-age correlations for attention and activity scores

Note: The values for the attention (ATT) and activity (ACT) cross-age correlations are above and below the diagonal, respectively. The 12-year-olds consisted of 122 monozygotic (MZ) and 95 dizygotic (DZ) pairs, the 14-year-olds consisted of 140 MZ and 154 DZ pairs, and the 16-year-olds group consisted of 89 MZ and 96 DZ pair.
*p = .05.
Phenotype assessment
The SWAN (Swanson et al., Reference Swanson, Posner, Fusella, Wasdell, Sommer and Fan2001) was used to assess the full range of variability of attention (ATT) and activity (ACT). The SWAN contains 18 items to assess attention (9 items) and activity/impulsivity (9 items). Mothers were asked to indicate on a 7-point Likert scale how each twin (rated separately) compared to “other children the same age” over the preceding month. As in the original SWAN measure, all questions were written so that it is beneficial to be “far above” average (e.g., “organize tasks and activities” and “stay seated [when required by class rules/social conventions]”). The 9 items on each scale were summed to create a total score (possible range = 9–63 for each subscale). Previous genetic studies using SWAN used variable scales to present the results. To facilitate the comparison with clinical studies that used symptomatic measures, in the present analyses all items were reverse-coded, such that higher scores correspond to the dysfunctional end of the distribution (inattention and hyperactivity), while lower scores correspond to the adaptive end (high attentional skills and well-regulated behavior). The SWAN has been found to have strong internal consistency (0.80–0.95), acceptable test–retest reliability (0.72–0.90), construct validity, and a normal distribution (Arnett et al., Reference Arnett, Pennington, Friend, Willcutt, Byrne and Samuelsson2013; Lakes, Swanson, & Riggs, Reference Lakes, Swanson and Riggs2012; Polderman et al., Reference Polderman, Derks, Hudziak, Verhulst, Posthuma and Boomsma2007; Reiersen & Todorov, Reference Reiersen and Todorov2013; Swanson et al., Reference Swanson, Schuck, Mann, Carlson, Hartman and Sergeant2005). In the present data, Crobach α ranged from 0.93 to 0.96 for two subscales. Its two-factor structure was confirmed at all three age points (comparative fit index range = 0.986–0.989, Tucker–Lewis index range = 0.986–0.988) by conducting confirmatory factor analysis using Mplus version 7 (Muthen & Muthen, Reference Muthen and Muthen2012).
Statistical analyses
The mean scores of the two subscales within individuals at consecutive time points were compared by paired t tests using Stata version 9.2 (StataCorp, 2005), and the equivalence of the MZ and DZ mean scores at the same time point was tested using the regression procedure in Stata with the cluster option to control for the nonindependence of twins. To assess stability of ATT and ACT throughout development, we calculated within-person phenotypic correlations over time. To explore the genetic architecture, cross-twin correlations for MZ and DZ groups were calculated at three time points and quantitative genetic modeling was conducted to assess the significance of familial influences.
Genetic analysis
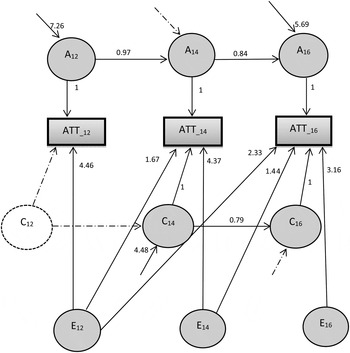
Our genetic analysis was based on standard assumptions of the twin study method (Plomin, DeFries, Knopik, & Neiderhiser, Reference Plomin, DeFries, Knopik and Neiderhiser2013). These models assume that phenotypic variance arises from additive genetic influences (A), nonadditive genetic influences (D), environmental influences shared by family members (C), and individually unique (nonshared) environmental influences (E). Genetic influences are indicated when MZ twin correlations are larger than DZ twin correlations. If all twin pair similarity were attributable to A, the MZ correlation would be about twice the DZ correlation, because MZ twins share all of their genes and DZ twins share half of their segregating genes (on average). Nonadditive genetic influences are indicated when the MZ correlation is more than twice the DZ correlation (because MZs again share 100% of nonadditive genetic effects, but DZ twins only share 25% of such effects). Shared environmental influences are indicated when the DZ correlation is more than 50% of the MZ correlation. If all twin pair similarity were attributable to C, the MZ and DZ correlations would be equal in magnitude because shared familial components are shared equally among MZ and DZ twin pairs. When only data from twin pairs reared together is available, it is not possible to test C and D simultaneously, and a decision regarding whether to test an ADE or an ACE model is made based upon the observed twin correlations (Rijsdijk & Sham, Reference Rijsdijk and Sham2002). A detailed description of the model fitting approach and assessment of heritability can be found elsewhere (Neale & Cardon, Reference Neale and Cardon1992; Rijsdijk & Sham, Reference Rijsdijk and Sham2002). Structural equation models were used to examine the pattern of familiality using the Mx package, which was specifically developed to model genetically informative data (Neale, Reference Neale2004). Because in a longitudinal design, data from one or more time points or from one twin may be missing from the data set, multivariate structural equation models were fitted to the raw data by a maximum likelihood method (Lange, Westlake, & Spence, Reference Lange, Westlake and Spence1976). As a first step to multivariate analysis, we tested a Cholesky (lower triangular) model, in which influences at Time 1 are also allowed to load directly onto all other assessments, new influences enter the model at each subsequent assessment, and these influences are also allowed to load onto all later assessments (Rijsdijk & Sham, Reference Rijsdijk and Sham2002); the path loadings for the E components of the attention scale in Figure 1 depict a Cholesky parameterization. This model provides a first glance into the genetic architecture and serves as a base model to which more restricted models can be compared. A particularly useful model for longitudinal data is an autoregressive (or simplex) model, because it specifies that a latent factor at time t is influenced directly the immediately preceding time (t – 1) in addition to any new influences (Boomsma & Molenaar, Reference Boomsma and Molenaar1987; Eaves, Long, & Heath, Reference Eaves, Long and Heath1986; Neale & Cardon, Reference Neale and Cardon1992); the A components in both the attention and activity scales of Figure 1 depict a simplex pattern. The simplex model takes full advantage of the time series nature of longitudinal data (Boomsma & Molenaar, Reference Boomsma and Molenaar1987) and is a stronger test of developmental hypotheses. A hallmark of a simplex data structure is a pattern where the correlations are highest among adjacent assessments and decrease systematically as the span between assessments increases (Rijsdijk & Sham, Reference Rijsdijk and Sham2002). The simplex structure fits well with our hypothesis that the stability of both attention and activity is maintained by prior influences that are transmitted to subsequent ages, and that change may be brought by new influences that enter at each age, which suggests a simplex (autoregressive) model. The significance of paths is tested by examining the decrement in fit when individual paths are eliminated from the model. Fit of the submodels was determined by calculating the difference in −2 times the log-likelihood of the full model and the submodel, which is interpreted as a chi-square test for the given degrees of freedom. Fit statistics for the reduced developmental models were compared with those for the saturated models. If the decrement in fit for a reduced model was not significant, that path was deleted from the model, and we tested the significance of additional parameters.
Best-fitting structural equation model for genetic and environmental determinants of attention score, controlling for gender. Rectangles represent the observed variance for each age, and circles represent the latent factors. A simplex model is shown for additive genetic influences (A12, A14, and A16) and shared environmental influences (C12, C14, and C16). A Cholesky (triangular decomposition) model is shown for the nonshared environmental effects (E12, E14, and E16). Broken lines indicate latent factors and paths that could be dropped from the model.

Given that the power to detect gender differences in variance components was low with the current sample size (Polderman, Posthuma, De Sonneville, Verhulst, & Boomsma, Reference Polderman, Posthuma, De Sonneville, Verhulst and Boomsma2006), the data from male and female twins were combined in the present analyses, and gender was controlled for in all genetic models.
Results
Descriptive statistics
The mean values for ATT and ACT (Table 1) decreased significantly with age (tested using paired t tests in Stata 9.2 (StataCorp, Reference Swanson, Posner, Fusella, Wasdell, Sommer and Fan2005), with clustering on family to control for the inclusion of data from both twins). Among the subset of 358 individuals (179 pairs) with data at both ages 12 and 14, the means declined from 32.6 to 30.9 for inattention, and from 31.5 to 29.3 for hyperactivity, t (357) = 4.63 and 5.40, respectively, p < .001. Among the subset of 336 individuals (168 pairs) with data at both ages 14 and 16, the means declined from 30.5 to 28.7 for inattention, and from 29.3 to 27.3 for hyperactivity, t (357) = 4.59 and 4.29, respectively, p < .001. There was no significant difference between MZ and DZ twins in their mean scores on either ATT or ACT at any age (ps = .08–.97; tested using simple regression analyses in Stata, version 9.2, with clustering on family to control for the nonindependence of twins; means not shown but available upon request). The skewness and kurtosis scores for both scale scores suggested minimal departure from normality (ATT: skewness = –0.09 to –0.39, kurtosis = –0.86 to 0.33; ACT: skewness = –0.36 to –0.63, kurtosis = –1.1 to 0.25).
Correlations
Test–retest phenotypic correlations across the time points (Table 1) were large (ATT: rs = .66–.74; ACT: rs = .63–.67; tested in SAS, version 9.2 (SAS Institute Inc., 2008), indicating high longitudinal stability of these traits over a 4-year period. Furthermore, phenotypic cross-age correlations were slightly lower for the longer interval (ages 12–16) than correlations for shorter intervals (ages 12–14 and 14–16), suggesting an autoregressive (or simplex) pattern.
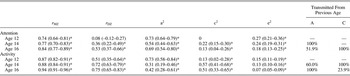
Intrapair twin correlations for ATT and ACT scores are presented in Table 2 (all twin-pair correlations and confidence intervals were calculated using Mx, a statistical package designed for use with data containing related individuals). At all ages, MZ correlations were higher than DZ correlations, suggesting genetic influence on both traits across all time points. The DZ correlations for ACT were more than one half of MZ correlations, suggesting that shared environmental influences might be important. However, the pattern for ATT was inconsistent, with the DZ correlation much less than one half of MZ correlation at age 12, about half the MZ correlation at age 14, and more than half the MZ correlation at age 16, suggesting the potential for nonadditive genetic influences in early adolescence and shared environmental influences in later adolescence. Although correlations can be used to test the significance of total familiality, structural equation modeling is required to test the significance of the specific contributions of genetic and shared environmental factors to total familiality.
Intrapair twin correlations and proportions of variance for the best-fitting models for attention and activity (95% confidence intervals)

Note: All proportions of variance were calculated controlling for gender. r MZ and r DZ, Intrapair correlations in monozygotic and dizygotic twin pairs, respectively; a2, proportion of total variance explained by additive genetic influences; c2, proportion of variance explained by shared environmental influences; e2, proportion of variance attributable to nonshared environmental influences; A, additive genetic influences; C, shared environmental influences.
*p < .05.
Multivariate model fitting
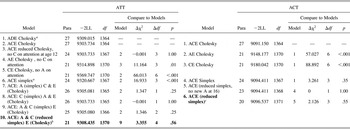
The results of model fitting for ATT and ACT are presented in Table 3. The Cholesky models were used to test significance of the A, D (for ATT), and C components (E, which includes error as well as individual-specific effects is retained in all models, although specific paths may be eliminated), and as a reference for comparison with the more restrictive simplex models.
Multivariate model fitting for attention and activity subscales at ages 12, 14, and 16, controlling for gender

Note: Significant p values indicate poor model fit. ATT, Attention; ACT, activity; –2LL, –2 log likelihood; A, additive genetic variance; D, nonadditive genetic variance; C, shared environmental variance; E, nonshared environmental variance.
a The model was rejected by comparing it with the full ACE Cholesky model.
b Best fitting model for ATT; no C at 12 (and thus no transmission to age 14), no new A at 14, and no new C at 16.
c Best fitting model for ACT; no new A at 16, no new C at 14; no E transmission from 12 to 14 or 14 to 16).
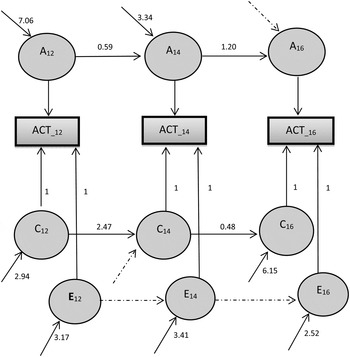
For ATT, the ACE Cholesky model fit slightly better overall than the ADE model (Models 2 and 1, respectively), and thus was used as the base model for ATT. There was no evidence of C at age 12 for ATT (Model 3), but significant C was found at ages 14 and 16 (Model 4). A model that eliminated shared environmental influences while retaining genetic effects (Model 4) and one that eliminated genetic effects while retaining shared environmental effects (Model 5) were both rejected, suggesting significant genetic and shared environmental influences for ATT. Thus, the model ACE was selected as the final Cholesky model, and used as the reference model for the simplex model. The simplex ACE model (Model 6) fit significantly less well than the full Cholesky model, indicating that the more restrictive simplex pattern did not describe the data as well as the full Cholesky model. However, models specifying a simplex pattern for A (Model 7), or for C (Model 8) individual, or for A and C simultaneously (Model 9) did not result in a decrement in fit, indicating that they described the data well. Additional testing confirmed no C at age 12 (and thus no transmission from 12 to 14), no new C at age 16, and no new A at age 14 (Model 10). Thus the final model for ATT (shown in Figure 1) included a simplex pattern for A and C, with E left as a Cholesky parameterization.
For ACT, neither A nor C could be removed from the Cholesky model without a significant decrement in fit (Models 3 and 2, respectively), indicating significant genetic and shared environmental contributions to ATT. For ACT, the simplex model did not have a significantly poorer fit than the Cholesky model (Model 4), suggesting that the more parsimonious simplex model described the data well. Additional testing indicated that there was no new A at age 16 (Model 5), no new C at age 14, and no E transmitted over time (either from 12 to 14 or from 14 to 16). The final model, Model 6, is shown in Figure 2.
Best fitting structural equation model for genetic and environmental determinants of activity score, controlling for gender. Rectangles represent the observed variance for each age, and circles represent the latent factors. A simplex model is shown for additive genetic influences (A12, A14, and A16), shared environmental influences (C12, C14, and C16), and nonshared environmental effects (E12, E14, and E16).

The proportions of variance explained by the three components based on best fitting models are listed in Table 2. At each age, the contribution of A was significant and substantial, accounting for 54%–73% of the variance in ATT, and 31%–73% of the variance of ACT. Although no C was found at age 12 for ATT, significant C were found at ages 14 (22%) and 16 (13%) for ATT, and at all ages for ACT (13%–57%). As shown in Table 2, these familial influences were highly stable. For ATT, 100% and 52% of A at ages 14 and 16 were transmitted from the prior assessments, respectively, and 100% of C at age 16 was transmitted from age 14. For ACT, at ages 14 and 16, 60% and 100% of A, and 100% and 20% of C were transmitted from the prior age, respectively.
Discussion
This is the first longitudinal twin study to assess the stability of and change in genetic and environmental influences on the full range of variability of attention and activity, two behavioral dimensions relevant to ADHD. Similar to existing studies that focused on symptoms, we found very high levels of familiality on both the attention and activity levels of adolescents as rated by their mothers. In contrast to most previous research, our study suggests that shared environmental factors contribute to twin resemblance, in addition to the genetic influences typically found. In a meta-analysis of childhood and adolescent behavioral disorders, Burt (Reference Burt2009) found that ADHD was the sole disorder that showed no evidence of shared environmental influence. Although not observed consistently, several studies have shown evidence of shared environmental influence on attention and activity (Greven, Rijsdijk, et al., Reference Greven, Rijsdijk and Plomin2011; Hay et al., Reference Hay, Bennett, Levy, Sergeant and Swanson2007; McLoughlin et al., Reference McLoughlin, Ronald, Kuntsi, Asherson and Plomin2007; Saudino & Zapfe, Reference Saudino and Zapfe2008; Wood, Saudino, Rogers, Ashersen, & Kuntsi, Reference Wood, Saudino, Rogers, Asherson and Kuntsi2007). In a response to Burt's (Reference Burt2009) meta-analysis, Wood, Buitelaar, Rijsdijk, Ashersen, and Kuntsi (Reference Wood, Buitelaar, Rijsdijk, Asherson and Kuntsi2010) noted that shared environmental influences were observed in 16% of studies on ADHD symptoms, and accounted for 27% of the variability in the studies in which they were observed. Research using the SWAN has shown mixed results, with Polderman et al. (Reference Polderman, Derks, Hudziak, Verhulst, Posthuma and Boomsma2007) finding familiality attributable entirely to genetic factors, and Hay et al. (Reference Hay, Bennett, Levy, Sergeant and Swanson2007) finding evidence for significant genetic and shared environmental influence for both inattention and hyperactivity/impulsivity in children (6–9 years of age) and for hyperactivity/impulsivity in adolescents (12–20 years of age). Our hyperactivity/impulsivity genetic (31% and 42%) and shared environmental (57% and 51%) components at ages 14 and 16, respectively, were highly consistent with Hay et al.'s 31% genetic and 66% shared environment in adolescents.
There are several possible explanations for the inconsistent findings regarding shared environmental influences on attention and activity. Hay et al. (Reference Hay, Bennett, Levy, Sergeant and Swanson2007) suggested that studying the full range of variability of behavior might partially explain the finding of shared environmental influences on these two traits during adolescence. Wood et al. (Reference Wood, Buitelaar, Rijsdijk, Asherson and Kuntsi2010) suggested several additional reasons why studies of ADHD might not show evidence of shared environment. In addition to low power and the potential presence of both nonadditive genetic and shared environmental influences (which cannot be disentangled using only twin pairs who grew up together), Wood et al. also suggested the possibility that the absence of shared environment could stem from the highly skewed nature of traditional diagnostic measures of ADHD. In the present study, both the range of variability (from “far better than age mates” to “far below age mages”) and the normal distribution in the general population (and our sample) might have enhanced our ability to detect shared environmental influences. Neither suggestion would explain the absence of shared environment in Polderman et al. (Reference Polderman, Derks, Hudziak, Verhulst, Posthuma and Boomsma2007) examining the SWAN, although cultural differences between the studies might be important to consider (our sample is from the United States, Hay et al.'s was Australian, and Polderman et al.'s was Dutch). In particular, the Midwestern US population from which the sample was drawn may have a broader range of variability in family-level environmental factors (e.g., socioeconomic status, ethnic background, neighborhood, and school characteristics) than both the Australian and Dutch populations.
Our longitudinal analyses paralleled prior studies in finding that attention and activity levels remained largely stable (with significant, but not dramatic improvement) during adolescence, even when examining behavior from the adaptive end of the spectrum. Cross-age correlations were also consistent with those previously reported for inattention and hyperactivity/impulsivity (Larsson et al., Reference Larsson, Larsson and Lichtenstein2004), and stability over time was mainly accounted for by familial factors, which is also in keeping with previous ADHD research (Larsson et al., Reference Larsson, Larsson and Lichtenstein2004; Nadder et al., Reference Nadder, Rutter, Silberg, Maes and Eaves2002; Price et al., Reference Price, Simonoff, Asherson, Curran, Kuntsi and Waldman2005). However, our familial contributions were again a combination of genetic and familial environmental factors, with most previous research finding genetic factors were the sole familial contributor to stability.
Although much of stability over time in attention and activity is attributable to genetic factors, the contribution of genetics to this stability varies within age group (Larsson et al., Reference Larsson, Lichtenstein and Larsson2006; McLoughlin et al., Reference McLoughlin, Ronald, Kuntsi, Asherson and Plomin2007; Nadder et al., Reference Nadder, Rutter, Silberg, Maes and Eaves2002; Nikolas & Burt, Reference Nikolas and Burt2010). Our results suggested that stability over time was primarily attributable to familial influences. For attention, 43% of stability from ages 12 to 14 was attributable to nonshared (individual-specific) influences, and this dropped to only 13% when examining stability from ages 14 to 16. For activity, all stability was attributable to familial influences, becasue we were able to remove the nonshared environmental transmission paths from the model entirely (see Figure 2). More detailed examination of the transmission effects for attention indicated that genetic influences at age 14 were entirely overlapping with those from age 12, but that new genetic effects emerged at age 16, with about 50% of genetic influences at 16 being transmitted from age 14. For activity, there were new genetic influences at age 14 (with about 60% of genetic variance being transmitted from at 12) but no additional new genetic influences at age 16. We again found that some of the stability over time in activity was attributable to shared environmental influences. For attention, there was no evidence of shared environmental influence at age 12, with shared environmental influences apparent at age 14 and carrying through to age 16, with no additional shared environmental contributions arising at age 16. For activity, the shared environmental influences observed at age 12 carried through to age 14 (with no new effects observed), but shared environmental influences from age 14 explained 24% of the total C component at age 16. It is not surprising that genetic effects involve both stability and innovation during adolescence, because puberty is likely associated with both new genetic factors arising and some genes ceasing to be active. However, the development of novel shared environmental influences during adolescence seems somewhat counterintuitive. Given that these are mother ratings of both attention and activity, one possible explanation is that the maternal reports are reflecting changes in the influence of peers as the twins progress from primary school into middle and high school, with new peer networks developing and parental supervision decreasing.
Studying attention and activity across the full range of variability is a more accurate reflection of the entire behavioral spectrum than the conventional symptomatic scales, and has several advantages. First of all, it has clinical implications to help identify both genetic and environmental risk and protective factors that contribute to the development of attention and activity, so that the risk and protective pathways that lead to adverse outcomes or resilience from ADHD can be elucidated. Second, the role of shared environmental influence on attention and activity suggested in the present study may facilitate the development of effective ADHD risk-reduction strategies. Third, it overcomes several major limitations that are commonly seen in the field of behavior genetics, such as skewness, rater contrast effect, and truncation. In keeping with this possibility, the data collected on a full range produces more normally distributed data. Without data transforming, which could result in biased parameter estimates, the power to detect genes associated with attention and activity related to ADHD at varying degrees of expression increases (Arnett et al., Reference Arnett, Pennington, Friend, Willcutt, Byrne and Samuelsson2013). It has also been suggested that the more detailed measure is more resistant to rater contrast effects than instruments focusing on the symptomatic end only by opening up a wider range of positive and negative response options (Kuntsi et al., Reference Kuntsi, Rijsdijk, Ronald, Asherson and Plomin2005; Kuntsi & Stevenson, Reference Kuntsi and Stevenson2001). In addition, in molecular genetic studies, the ability to define concordant unaffected pairs and extremely discordant pairs will be strengthened if the well-adapted range of behaviors is not truncated at zero (Swanson, Wigal, & Lakes, Reference Swanson, Wigal and Lakes2009). The present study highlights the potential value of a full range dimensional approach on studying the common features of psychopathology in mental disorders (Casey, Oliveri, & Insel, Reference Casey, Oliveri and Insel2014).
Although, to our knowledge, this study is the first to explore the stability and change of genetic and environmental influences on the full range of variability of attention and activity in a longitudinal twin design, there are limitations to bear in mind. The first one is the reliance on maternal ratings. Teachers’ ratings would have been an especially useful addition, but were not available. In addition, due to statistical power limitations, we could not perform gender-specific analyses. These results need to be replicated and refined with larger samples of genetically related subjects. With more objective neuropsychological measures available in the present longitudinal genetics study, the developmental genetic architecture of these two traits could be further investigated in the near future.