1. Introduction
The research described in this paper was conducted as part of the Australia and New Zealand (Aus-NZ) Satellite-Based Augmentation System (SBAS) test-bed, coordinated by FrontierSI on behalf of Geoscience Australia (GA) and Land Information New Zealand (LINZ) (EY, 2019; Barrios et al., Reference Barrios, Pericacho, Calabrese, Fernández, Esteban, Fernández, Bravo, Calle, Torres, Figueiras, Wojciech, Caro, Jackson, Reddan, Bunce and Soddu2020). SBAS is a mature aviation technology that enhances vertical guidance, allowing aerodrome approaches to be safely conducted in a broader range of weather conditions. SBAS operates as a compliment to the Global Navigation Satellite System (GNSS), providing additional correction and integrity information alongside the core measurements from GNSS constellations, enabling improved navigation performance for aircraft, and increasing the safety of aviation operations (Misra and Enge, Reference Misra and Enge2012). A significant advantage of SBAS systems in comparison with other solutions, for example, the Instrument Landing Systems (ILS), is that SBAS leverages a typical regional investment to service many aerodromes within its coverage rather than necessitating the individual deployment and maintenance of costly local infrastructure at each runway.
Single-frequency L1 SBAS systems are currently operational in several regions, including WAAS in the USA and EGNOS in Europe. The Aus-NZ SBAS test-bed was established not only to test similar L1 SBAS signals in the region but also to provide a unique opportunity for assessment of dual-frequency multi-constellation (DFMC) SBAS (EUROCAE, 2019) corrections, which are not broadcasted elsewhere at the time of this study. Both L1 SBAS and DFMC SBAS signals were broadcast in test mode throughout both countries for a period of more than three years between 2017 and 2020, during which time extensive demonstration and evaluation campaigns were conducted to quantify the utility of the open-access corrections signals to serve all sectors of industry (EY, 2019).
This paper evaluates the performance characteristics of both L1 SBAS and DFMC SBAS positioning services for civil aviation. The Aus-NZ test-bed region covered a wide range of latitudes, including equatorial regions where ionospheric weather may severely impact L1 GNSS signals (Céson et al., Reference Cézon, Cueto, Ramírez, Ostolaza, Izquierdo, Pérez and Sardón2014). By utilising a dual-frequency approach, DFMC SBAS is theoretically able to mitigate the majority of ionospheric impacts; thus, relative performance assessment of L1 and DFMC SBAS is considered for potential use in civil aviation, particularly in equatorial regions. The performance analysis presented herein is based on data collected through a flight-test campaign conducted during 2018, which covered 32 h of flight tests around mainland Australia, across a variety of environments and operational conditions. The flight test plan was developed to place special emphasis on evaluating representative flight approach manoeuvres. The paper is organised as follows:
• Section 2 introduces the L1 SBAS and DFMC SBAS services and the context of the Aus-NZ SBAS test-bed implementation.
• Section 3 details the flight tests carried out and describes the methodology used to calculate and compare system performance.
• Section 4 presents the results of the test campaign and discusses the outcomes in detail.
• Section 5 provides the conclusions of the analysis.
2. L1 SBAS and DFMC SBAS services
2.1 SBAS services
The main purpose of SBAS is to broadcast additional correction information for GNSS to improve accuracy and integrity so that the system can be qualified to meet the applicable civil aviation navigation requirements for the region. The L1 SBAS services broadcast differential corrections to the satellite orbits and clocks of the GPS constellation, as well as ionospheric corrections for the entire service region. Each correction is accompanied by integrity bounding data, defined as the sigma of the error left after the application of the correction.
To compute the corrections and integrity bounds, SBAS requires data from a network of continuously operating reference stations (CORS) spread throughout the area of interest. The exact positions of these reference receivers are known, allowing the SBAS ground-segment processing algorithms to monitor any errors in the GPS ephemeris and to determine the state of the regional ionosphere.
The SBAS data is then transmitted to end users through a geostationary satellite broadcast. The SBAS corrections are used by the aviation receivers to improve the accuracy of its processed position. The integrity bounds are used to compute the horizontal and vertical protection levels (HPL/VPL), which represent the maximum error in the current flight navigation position with a high degree of certainty. While the protection levels remain below defined alert limits, the system is considered available and, therefore, safe enough to proceed with certain aviation procedures, particularly those related to approach and landing.
The DFMC SBAS system has been designed as an evolution of the L1 SBAS service. The DFMC SBAS solution targets dual-frequency and multi-constellation receivers. As these receivers are capable of dual-frequency measurements, the ionospheric errors can be cancelled out using the ionospheric-free linear combination. This frees the SBAS infrastructure from the significant technical processing stages necessary to monitor ionospheric behaviour, which is often irregular and unpredictable. When ionospheric correction data is not broadcasted, a major part of the geostationary transmission bandwidth can be released and used to augment other satellite constellations, for example, Galileo.
By eliminating the impact of the ionosphere, and including additional satellite constellations into the computed solution, DFMC SBAS can further improve performance and avoid service degradations that may affect an L1 SBAS service.
2.2 Australia and New Zealand SBAS test-bed
Between 2017 and 2020, a ‘second-generation’ satellite augmentation system has been demonstrated in Australia and New Zealand. This system provided SBAS and real-time precise point positioning (PPP) capabilities through the L1 and L5 signals broadcast from the Inmarsat 4F1 geostationary satellite. The satellite is on orbit at 143ṡ5E, providing hemispheric L-band coverage over most of Asia, including all of Australia and New Zealand. The L1 signal carried the L1 SBAS service messages, whereas the L5 signal carried the DFMC SBAS service messages. The SBAS services were broadcast as ‘Open’, ‘Non-Certified’ and ‘Non-Safety-of-Life’ signals. PPP corrections were also delivered using both L1 and L5 frequencies.
The Aus-NZ SBAS test-bed was established by Geoscience Australia (GA) and Land Information New Zealand (LINZ), managed by FrontierSI. The test-bed system was developed in collaboration with industry partners, including Lockheed Martin, Inmarsat and GMV. The primary objective of the test-bed was to assess the benefits of satellite navigation technologies capable of assuring integrity and improve the precision of positioning techniques for applications across all sectors of industry, where previous benefits evaluations focussed solely on aviation.
The architecture of the SBAS test-bed was composed of pre-existing CORS stations providing real-time observation data NTRIP, a single processing centre deployed in Uralla (Australia), hosting an instance of GMV's proprietary MagicSBAS software generating the SBAS messages, an uplink station also located in Uralla, and the 4F1 satellite used for broadcast. Figure 1 provides an overall description of the test-bed architecture.
Australia SBAS test-bed architecture

Figure 2 shows the location of the NTRIP CORS reference stations both in the SBAS L1 processing and SBAS DFMC processing.
SBAS L1 regional network (left) and SBAS DFMC global network (right) (01/09/2018)

The test-bed was designed to provide a cost-effective method of examining the feasibility of an Australian SBAS system. In this sense, its architecture required some notable compromises. For example, the test-bed used a station network with a greater number of sites than is usual in an operational SBAS. These additional stations were used to compensate for unavoidable outages of receivers and their data links to the processing centre and uplink, which have not been designed nor built to guarantee the level of uptime and redundancy required for certification. Another example is the use of a single GEO, processing centre and uplink station, making the system more sensitive to infrastructure failure or outage. These inherent limitations preclude the commitment to ICAO-specified availability or continuity requirements.
Similarly, the lack of dual co-located receivers at each station posed inherent limitations on the GNSS threat monitoring at the processing centre. For example, the limited input data prevented the use of an evil-wave-form monitor, and the lack of station redundancy precluded the use of a station bias monitor. Despite this, the user differential range error (UDRE) and grid ionospheric vertical error (GIVE) computations are considered representative, making the system a reliable representation of an SBAS system in a fault-free case.
Due to these inherent difficulties when modelling the availability of each CORS station, the test-bed did not provide a prediction of availability. However, as an illustration of the system performance, Figures 3 and 4 show the level of availability achieved by the test-bed system during two example months in 2019.
Cumulative monthly availability of APV-I during May 2019

Cumulative monthly availability of APV-I during June 2019

Furthermore, given the partial deployment of L5-enabled GPS satellites during the experimentation, the test-bed was configured to work with GPS L1/L2 rather than GPS L1/L5 ionosphere-free combination.
A more detailed description of the test-bed infrastructure, including system performance can be found in (Barrios et al., Reference Barrios, Caro, Calle, Carbonell, Pericacho, Fernández, Esteban, Fernández, Bravo, Torres, Calabrese, Diaz, Rodríguez, Laínez, Romay, Jackson, Reddan, Bunce and Soddu2018).
2.3 Test-bed L1 SBAS legacy service
The L1 SBAS legacy service was broadcast using PRN 122 following the RTCA/DO-229E Minimal Operational Performance Standard (MOPS) (RTCA, 2016). As the service was declared only for testing use, the test-bed broadcast MT 0 messages every 6 s, signalling for avionics not to track the signals. The L1 SBAS data carried both corrections and integrity information for GPS satellites and regional ionosphere grid points (IGP) covering both Australia and New Zealand in its service area, as shown in Figure 5. The L1 SBAS information was applicable only to augmenting GPS L1 single-frequency positioning.
L1 SBAS MT27 service area (left) and MT18 IGP mask (right)

2.4 Test-bed DFMC SBAS service
The DFMC service was also broadcast using PRN 122 and initially followed the WG62 GAL GPS SBAS MOPS v0.3.8\_10 draft (DFMC, 2017), which was the latest draft version available at the start of the test-bed transmission. In October 2019, the broadcast was changed to the ED-259 DFMC MOPS, which was a revised standard for DFMC (EUROCAE, 2019). Since the DFMC service was not constrained by the ionosphere estimation in the region, it was broadcast to the entire footprint of the Inmarsat 4F1 geostationary satellite, as depicted in Figure 6.
Inmarsat 4F1 PRN 122 footprint

The DFMC SBAS service was designed to support the augmentation of GPS L1/L5 and GAL E1/E5a dual-frequency receivers. However, at the time of realisation of the test-bed, only a subset of the GPS satellites were broadcasting L5 signals, and the Galileo constellation was not yet complete. To mitigate the geometry degradation that would result from using two incomplete constellations, we decided to switch to GPS L1/L2 signals with GAL E1/E5a. This allowed the service to utilise all GPS and Galileo satellites that were available at the time, thus enabling experimentation to be performed with geometry more representative of an operational SBAS in the region.
In the case of Galileo, more than 18 satellites were available during this period of the test-bed. This is not a complete constellation, but is sufficient for minimum Galileo visibility conditions during flight tests. Although the status of the Galileo constellation is not considered a major limitation for this experimentation, the completed future constellation will allow slightly improved performance and greater redundancy.
3. Methodology
3.1 Flight test description
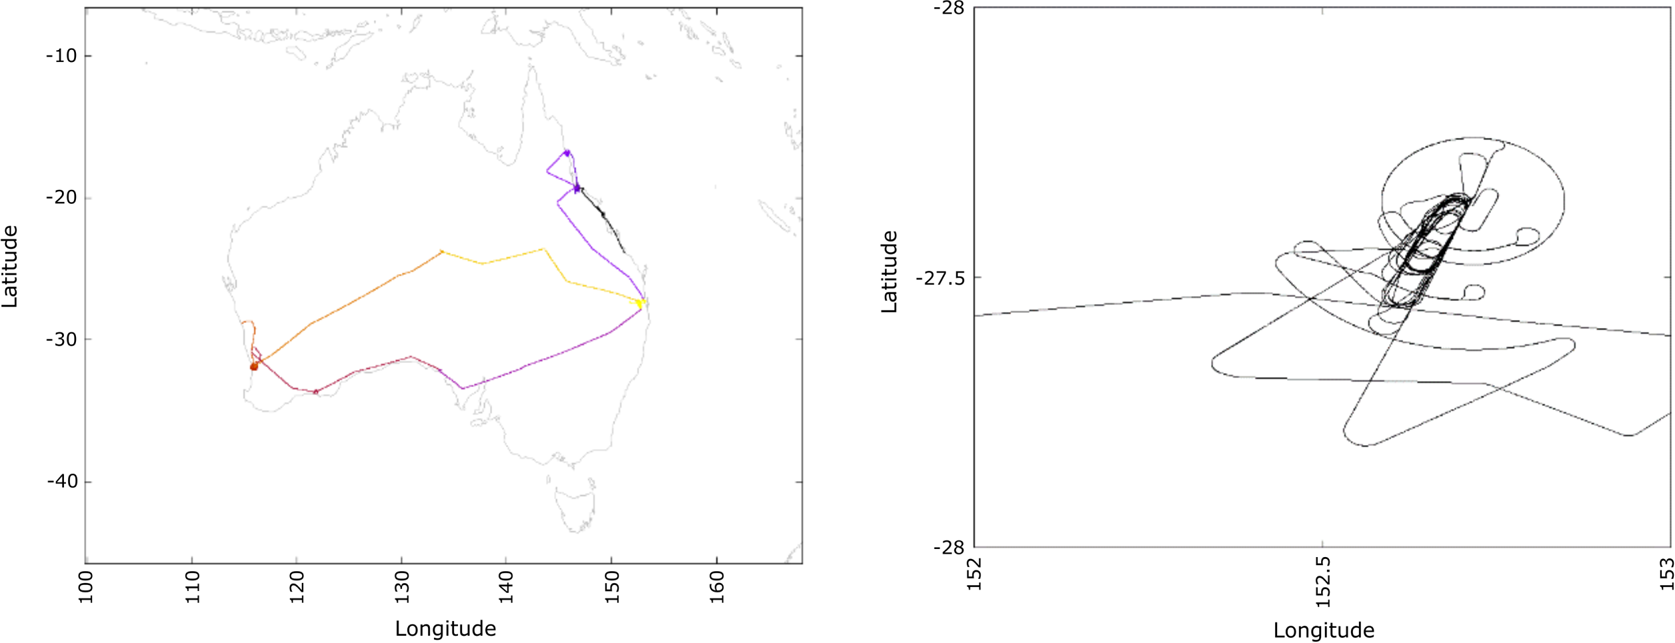
From April to August 2018, 14 flights were conducted between aerodromes in Western Australia, South Australia, Northern Territory, New South Wales and Queensland.
Figure 7 shows the coverage of the flight tests through Australian territory (left), and an example of the airport approaches tested in Brisbane airport (right).
Flight test coverage (left) and detail of manoeuvres at Brisbane airport (right)

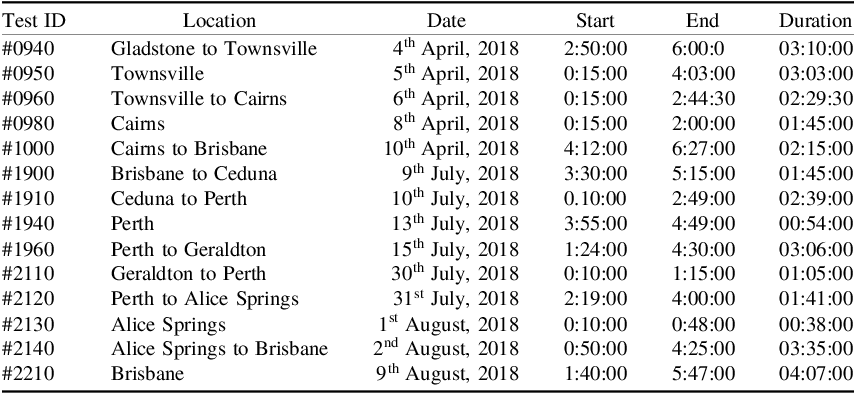
Table 1 lists the flight tests performed, indicating the location, date and time interval. The time interval is expressed in GPS time (hour-minute-second civil format). The flight IDs correspond to the Julian date on which the testing occurred. Each of the flights has been analysed from take-off to landing procedures. A total of 32 h of data in flight conditions is evaluated as part of the experimentation.
Flight tests performed

3.2 GNSS performance parameters
This research quantified the performance of the L1 SBAS and DFMC SBAS services by calculating three main GNSS parameters: accuracy, availability and integrity (Roturier et al., Reference Roturier, Chatre and Ventura-Traveset2001). These parameters were calculated by examining kinematic data recorded in flight and comparing the reported position to a reliable post-processed trajectory. The trajectory was computed by post-processed PPP techniques and the resultant coordinates were better than 10 cm in uncertainty.
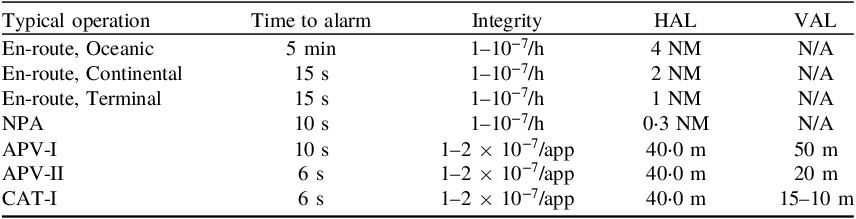
In Australia, each approach is associated with both a horizontal and vertical alert limit (HAL/VAL) as designed by the Civil Aviation Safety Authority (CASA) in conjunction with Airservices Australia. This is also consistent with ICAO standards elsewhere in the world. The tested alert limits are listed in Table 2.
Approach operations and associated Horizontal and Vertical Alert Limits during testing

To provide a measure of accuracy, horizontal and vertical errors were computed using a reference trajectory and system reported position between a selected start and finish window, approximating a precision approach into an aerodrome. To assess the integrity, the methodology quantified both horizontal and vertical protection limits (HPL/VPL) over the course of each approach and compared them with the error measured after comparing SBAS position solutions against a reference trajectory.
The computation of the HPL/VPL also allows the evaluation of the solution availability. System availability is defined as the percentage of time the system is used for navigation within a given time span. HPL and VPL are compared against the HAL and VAL, respectively, to determine availability. When either protection level is greater than the procedure alert limit, the system is no longer available, and the pilot is instructed not to use the SBAS procedure. Finally, the continuity risk is defined as the probability of the SBAS service being available at the start of the procedure, but becoming unavailable during its realisation.
In a general sense, ‘LPV-200’ was created as a modified APV-II approach, which uses an expanded 35 m VAL. The Standards and Recommended Practices (SARPS) specify the requirements of APV-II with a 20 m VAL, which was considered to be too similar to the CAT-I 15 m approach, leading to substitution of the VAL specified by the LPV-200 definition (Hernando et al., Reference Hernando, Marquez, Pintor, Roldán, Alvaréz and Lorenzo2015). These approaches are otherwise considered to be analogous for the purposes of this analysis. As indicated in Table 3, the ICAO SARPS define CAT-I approaches with a VAL of 10–15 m, so both 10 m and 15 m VALs were analysed separately.
ICAO SARPS for alerting (ICAO, 2016)

Stanford diagrams are commonly used to display the protection level and positioning error, indicating their magnitude relative to the alert limits specified for the approach (Tossaint et al., Reference Tossaint, Samson, Toran, Ventura-Traveset, Sanz, Hernandez-Pajares and Juan Zornoza2006). The diagram is segmented to show the Integrity status determined from the current values of HPE, VPE, HPL and VPL. Misleading information (MI) events occur whenever the position error (PE) exceeds the protection level while remaining less than the alert limit, or while the system is unavailable. Hazardously misleading information (HMI) events occur when the system claims to be available, but reports a receiver position that exceeds both protection level and the alert limit. These segments are detailed in Table 4.
Stanford diagram segments and definitions

Both MI and HMI events constitute integrity events, which must not occur more frequently than specified in Table 3. Each precision approach requires that the probability of integrity loss should be not greater than 2 × 10⁻⁷ during the operation. The SARPS also specify a required level of continuity, shown as a probability of continuity breaks occurring during the approach, which are detailed in Table 5. The continuity risk calculation shown in Equation (1) gives a measure of how likely the system is to function within the specified performance parameters throughout the approach operation:

ICAO SARPS for continuity (ICAO, 2016)

It must be stressed that the accuracy, availability, integrity and continuity of SBAS are defined as long-term signal-in-space requirements applicable during the complete lifecycle of the systems. Flight testing is a meaningful way of assessing SBAS performance; however, data from individual flights should be used with caution, as it is not representative of the complete system lifecycle and does not necessarily indicate that the service complies fully with the ICAO standards. In this sense, the results achieved during the individual flight tests must be put in context, particularly in regard to the integrity and continuity requirements. For example, a continuity break measured in a one-hour flight test will result in worse performance than the same duration break during a ten-hour flight test. However, even a ten-hour time span is insufficient to completely analyse the continuity of the system as, per ICAO requirements, many thousands of hours are needed to have reliable continuity statistics.
Finally, in the case of the integrity requirements, the probability of having a misleading event is so low that it should not be expected to observe an integrity fault during any singular flight test. However, it must be noted that SBAS standards specify a maximum allowable error for the receiver equipment. If the receiver is unable to meet this requirement, degraded performance is likely to occur.
3.3 Equipment, data collection and processing
The test equipment was installed on a Beechcraft King Air B200T aircraft. A geodetic-grade GNSS receiver (Septentrio AsteRx-U) was installed inside the cabin connected to an Antcom antenna mounted to the top centreline of the exterior of the airframe. The ANTCOM G5Ant-42A4T1 was used for flights 0940-1000, and was then replaced with an ANTCOM G8Ant-743A4T1-A2. This setup is capable of tracking GPS, GAL and L1 SBAS signals. After the flight test, receiver observation logs were retrieved and converted into receiver-independent exchange (RINEX) format.
At the time of testing, the MOPS for DFMC SBAS were not yet released, and hence there were no commercial DFMC receivers available on the market. For this reason, a software-defined radio front-end was used alongside the GNSS receiver to capture and decode the DFMC SBAS signals (Barrios et al., Reference Barrios, Caro, Calle, Carbonell, Pericacho, Fernández, Esteban, Fernández, Bravo, Torres, Calabrese, Diaz, Rodríguez, Laínez, Romay, Jackson, Reddan, Bunce and Soddu2018). The antenna was routed through a passive signal splitter, which allowed simultaneous processing of identical satellite observations by both the receiver and the front-end. Due to these limitations, certified avionics equipment was not used for flight testing. A fully operational and certified SBAS system received through high-quality certified avionics may result in improvements to the achievable performance indicated in these trials.
Captured RINEX observation data was then post-processed through the GMV MagicGEMINI software, which is capable of implementing L1 SBAS and DFMC SBAS user navigation algorithms to compute aircraft position and protection levels. In addition, a precise reference trajectory for each flight was used by the software to compute availability, accuracy and integrity statistics.
3.4 User processing model
The user processing for SBAS-L1 and SBAS DFMC are considered to be equivalent. The former processes GPS L1 pseudo ranges, while the latter processes GPS L1/L2 signals with GAL E1/E5a iono-free combinations. SBAS L1 (RTCA, 2016) and SBAS DFMC (DFMC, 2017) slightly differ in the format, resolution and updating frequency of their correction data. SBAS DFMC does not include ionospheric corrections as SBAS L1 does.
The SBAS-L1 user processing is defined by MOPS standard (RTCA, 2016). It consists of a weighted least-square PNT solution, in which the resulting covariance matrix is used to determine the protection levels. The least-square solution is defined as:

Where:
• y is the set of line-of-sight residuals after correcting orbit, clock and ionospheric components using the SBAS broadcast information with clock, orbit, ionospheric and tropospheric corrections.
• G is the design matrix with the unitary vector for each line-of-sight in WGS84 datum.
• W is the weight computed with an estimation of the satellite, tropospheric and ionospheric errors, with information also broadcast in the SBAS signal, and thus estimated from the processing of the SBAS test-bed reference stations input data:
(3) $$W{\rm{ = }}{1 \over {{\sigma _i}^2}}$$
• σi includes the variance error contributions for each line-of-sight from the SBAS data and the error models (i.e. σi ,flt, σi ,UIRE, σi ,air, σi ,tropo) as defined by (RTCA, 2016).
• x is the update to the receiver position in the iterative least square.

The covariance matrix of the least-square estimator uses the following equation:

The horizontal and vertical protection levels are then computed from the projection of the covariance matrix in the vertical dimension and the horizontal plane at a given confidence interval as shown:


with KH = 6 and KV = 5ṡ33 for precision approach modes, and:

In the MOPS standard (RTCA, 2016), the measurements smoothing algorithm implementation is kept as a degree of freedom in the receiver implementation, with the constraint that it must performing better than a reference algorithm provided in the document.
The equations of the smoothing filter implemented in MagicGEMINI are:


where:
• ${\rho _n}$
is the pseudorange measured by the receiver at epoch n.• ${\phi _n}$
is the phase measured by the receiver (in meters) at epoch n.• ${P_n}$
is the projected pseudorange using phase information.• ${\hat{P}_n}$
is the smoothed pseudorange to be used in the position solution.-
• $t$
is the time that has lapsed since the start of the smoothing process. • $\alpha$
(n) is the smoothing constant that evolves in the following way: (10) $$\alpha (n){\rm{ = }}\left\{ {\matrix{ {{1 \over n}\;({\rm{if }}{\hskip2pt}n \lt {\rm{Smoothing}}{\hskip2pt}{\mkern 1mu} {\rm{Time}});} \cr {{1 \over {{\rm{Smoothing}}{\mkern 1mu} {\rm{Time}}}}\;({\rm{if}}{\hskip2pt}{\mkern 1mu} n \ge {\rm{Smoothing}}{\hskip2pt}{\mkern 1mu} {\rm{Time}});\;} \cr } } \right.$$


Equations (2)–(10) define the weighted least-squares algorithm that MagicGEMINI used to process the observation data captured during flight tests. When using a smoothing time of 100 s, this filter reaches its steady state operation after 360 s of continuous operation. MagicGEMINI was configured based on the understanding that the standardised error models (receiver error, divergence error and multipath error) as defined at the time of writing were valid while the smoothing filter is in its steady state.
The fact that the line-of-sight is only utilised once the steady state is completed imposes a restriction on the available measurements, which will impact the performance results shown. However, the purpose of this paper is not to test experimental error models for the transient phase but to assess the performances that an aeronautical receiver could provide.
Note that the MagicGEMINI configurations were based on the standards and draft versions available at the time of the experiment. However, it is acknowledged that the smoothing algorithm and the error models for both the steady state and transient phase have been a point of significant discussion and adjustment as part of the evolution of the SBAS standards, and the implementation presented in this paper may not need to be universally followed nor correspond to that recommended in the subsequent versions of the standard.
Furthermore, in the case of DFMC, the absence of the ionospheric divergence creates the potential to increase the smoothing time and use lower-error measurements in the position solution, and thus this paper presents multiple smoothing times to explore the resultant behaviour of the DFMC solution.
4. Flight test campaign results
4.1 Introduction
The following sections present the results obtained from processing data collected during the flight test campaign. First, we present the overall results in terms of accuracy, availability and integrity. Secondly, we discuss in detail the specific results for some of the representative flights.
4.2 Kinematic accuracy results summary
The results from each test flight were post-processed and aggregated to provide overall accuracy statistics.
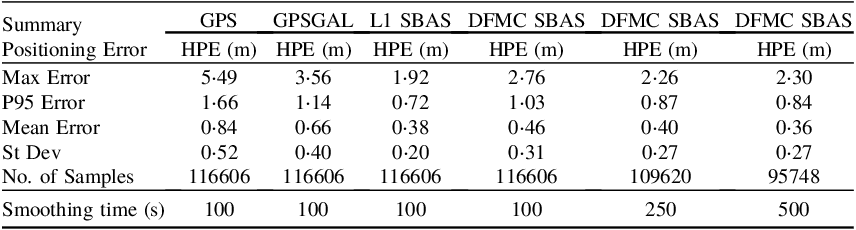
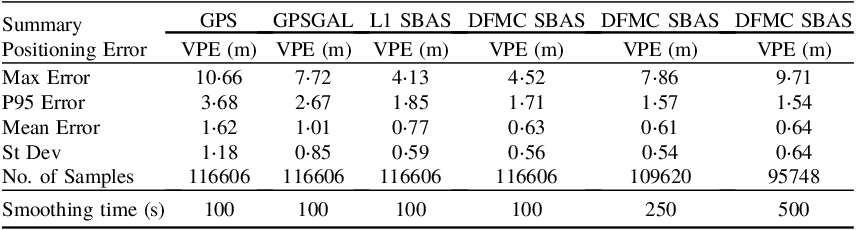
Table 6 lists the aggregated horizontal accuracy during the test campaign, while Table 7 lists the vertical accuracy. The accuracy indicators used are the maximum absolute error (Max Error), the 95th percentile level (P95 Error), the mean absolute error (Mean Error), and the standard deviation of the absolute error (St Dev). The P95 Error statistics presented indicate that 95% of the observed error will fall within this limit. In general, the mean error should not be read as indicative of a bias, as the positioning errors are evaluated considering absolute values, and the mean errors will not average to zero. This approach is considered more representative of the overall error in the navigation solution. These tables also present the number of epochs for which the computation of a position solution was able to be calculated (‘No. of Samples’), indicating the solution availability. Finally, the tables display the smoothing times in seconds used by each one of the DFMC SBAS solutions. A summary of the positional accuracy was evaluated for the following cases:
• GPS Single Point Solution (SPS) accuracy: GPS L1 single-frequency solution without SBAS augmentation. It is used as a reference to evaluate the improvements derived from the L1 SBAS corrections.
• GPS+ GAL SPS accuracy: GPS L1/L2+ GAL E1/E5a dual-frequency solution without SBAS augmentation. It is used as a reference to evaluate the improvements derived from the DFMC SBAS solution.
• L1 SBAS accuracy: GPS L1/L2 dual-frequency solution derived from the use of the SBAS corrections to the satellites and the ionosphere. The algorithm has considered the precision approach (PA) constraints and a smoothing time (ST) of 100 s.
• DFMC SBAS accuracy. GPS L1/L2 + GAL E1/E5a dual-frequency solution derived from the use of the DFMC SBAS corrections to the satellite. The algorithm has considered the PA constraints. Three different smoothing times: 100, 250 and 500 s have been evaluated and compared using otherwise identical DFMC SBAS solution.
Summary of Horizontal Position Errors – All flights (PA mode)

Summary of Vertical Position Errors – All flights (PA mode)

These tables indicate that the SBAS-augmented solutions provide better accuracy performance than the SPS solutions across all flights, on average. It can also be seen that DFMC SBAS offers improved performance in the vertical error, although the horizontal error remains smaller when using the L1 SBAS. The accuracy of the tested DFMC SBAS solutions tend to improve with longer smoothing time values, but on the contrary, its solution availability (measured by the number of samples) simultaneously decreases. Each of these results is representative of the expected SBAS system behaviour.
As described in Section 3.4, the SBAS positioning algorithm processes smoothed code observables into an epoch-by-epoch weighted least-squares estimator. In the case of the L1 SBAS service, a single-frequency receiver implements a hatch filter working exclusively with L1 observables and, therefore, is sensitive to the effects of code-carrier divergence (Sanz Subirana et al., Reference Sanz Subirana, Juan Zornoza and Hernández-Pajares2013, p. 79). For this reason, the L1 SBAS standard (RTCA, 2016) requires the smoothing time to be limited, using a 100-second smoothing filter as part of the receiver performance requirements. In a DFMC SBAS solution, dual-frequency receivers can implement divergence-free smoothing filters based on an ionosphere-free linear combination. Consequently, they can utilise longer smoothing times to further reduce the measurement errors. With longer smoothing times, observables with lower noise enter the weighted least-squares estimator, and the solution can achieve better accuracy. This paper has experimented with DFMC positioning algorithms using smoothing times of 100, 250 and 500 s.
One significant drawback of this approach is that the DFMC SBAS filter must be reset when a data gap occurs on either the primary or secondary frequencies, whereas the L1 SBAS is only affected by gaps in its single primary frequency. This justifies the degradation observed in some parameters of the DFMC SBAS solution with longer smoothing times; as the smoothing times increase, it becomes more probable that line-of-sight to certain satellites will become unusable due to an outage in either frequency, causing the associated filter to reset. Simultaneously, the observable remains unavailable for a longer time interval after a single epoch outage, while the filter returns to a steady state. With fewer satellites in view, it is more probable that the receiver will experience degraded geometry, leading to the observed higher maximum error values for the DFMC solutions in Tables 6 and 7. In the worst case, a situation with more numerous short-outages might lead to insufficient line-of-sight to compute a position solution, which would result in lower availability.
Nevertheless, it must be restated that the flight tests were performed with non-certified equipment, so it is probable that the receiver outages and noise pattern observed during the experimentation would occur more commonly and impact the results to a greater degree than would be realistic to expect when using future DFMC certified avionics. As one example, the latest version of the DFMC SBAS standard (EUROCAE, 2019) is planned to specify a smoothing time of 600 s.
Figure 8 visualises the 95th percentile (≈±2σ) results for each tested positioning mode.
Aggregated Horizontal Position Error (HPE) results

The other significant result is that although the SBAS solutions clearly outperforms non-SBAS solutions, the L1 SBAS and DFMC SBAS results both present comparable performance.
On one hand, DFMC SBAS permits the use of additional satellites (which improves the visibility geometry and makes the solution more robust to loss of any individual SV) and the processing of ionosphere-free observables (which removes the ionospheric error). On the other hand, the noise of the observables with DFMC SBAS is higher, as it is a combination of the observable noise on two frequencies.
In many cases, the quality of the L1 SBAS ionosphere corrections is such that the combination of L1 SBAS residual ionospheric error and single-frequency measurement noise still provides better performance than DFMC. This is particularly true at the central area of the L1 SBAS service region where the system is locally monitored by the reference network, which is also where most of the flight tests were conducted.
Overall, the DFMC SBAS solutions achieve numerous advantages by the absence of ionospheric modelling, which is computationally expensive due to constant spatial and temporal irregularities and requires the deployment of a very dense network of stations. Events such as scintillations, depletions or ionospheric storms make the ionospheric impact on GNSS signals difficult to model in real-time. As a consequence, undetected ionospheric behaviours are the most likely threat to the availability of a certified ‘Safety-of-Life’ positioning service for aviation.
Without the need to provide ionospheric corrections, the user solution is mostly independent of the ionosphere state, and because the ionosphere is not monitored, the required design and deployment process of an appropriate SBAS reference network is greatly simplified. Far fewer reference stations are needed, and the performance limitations around the border of the coverage area are mostly removed, making the region far more extensible.
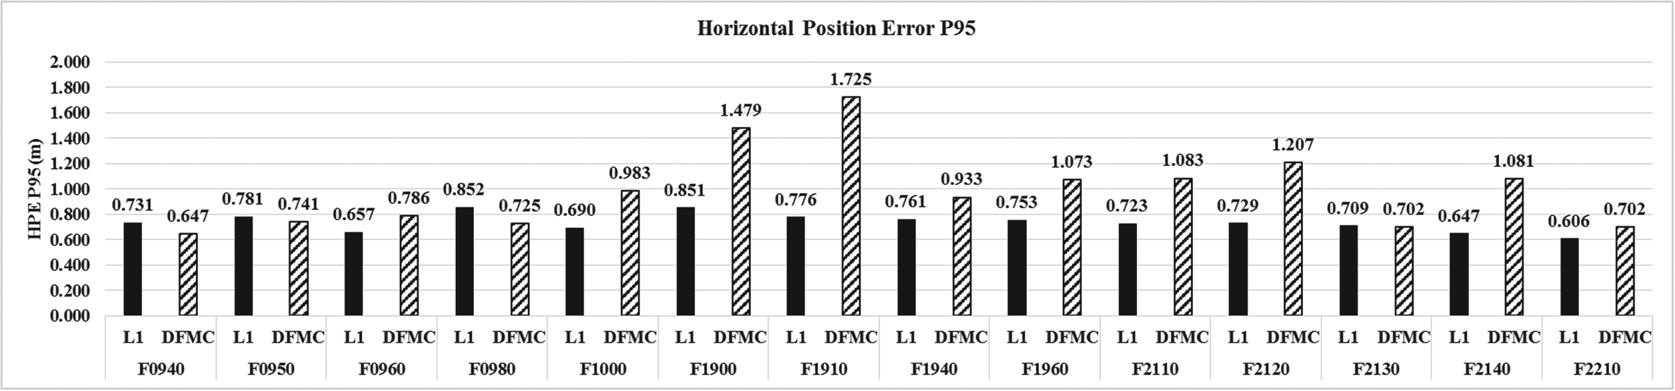
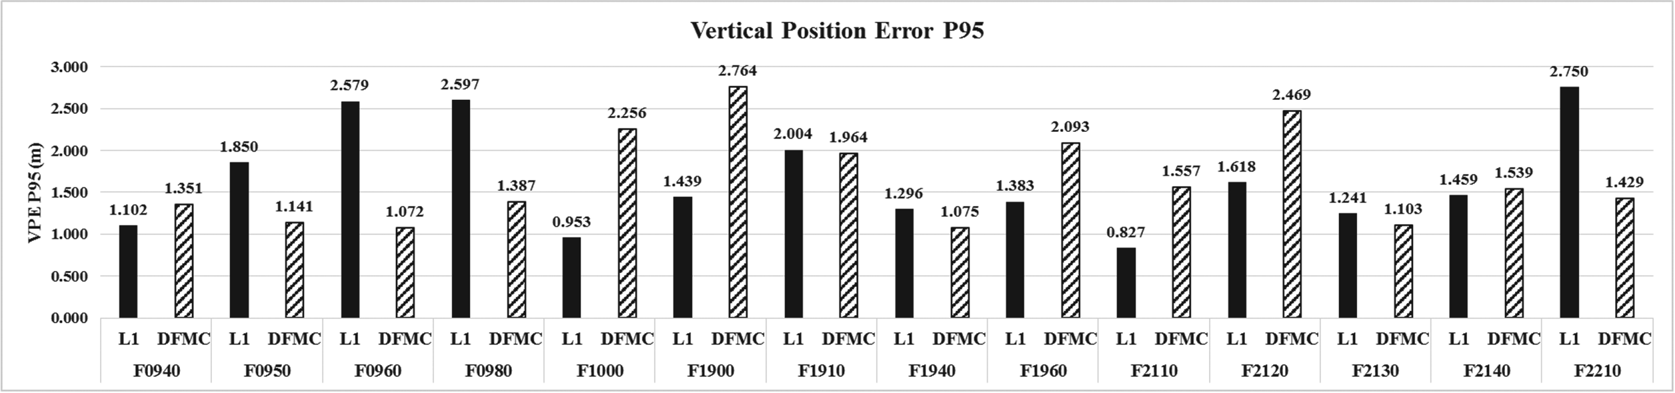
Figures 9 and 10 summarise the 95th percentile (P95, ≈±2σ) horizontal and vertical positioning errors for each flight and each positioning solution, with DFMC SBAS solution presented with a smoothing time of 100 s. The general trends described in Figure 8 are reproduced in the individual flight results, although some flights present exceptions to the overall behaviour. Nonetheless, it must be noted that despite performances representative of the SBAS capabilities, individually each flight is not long enough to achieve an overall statistical representation of the system averages, hence there are outliers present in the individual flight analysis, which have been aggregated into the analysis in Figure 8.
Horizontal Position Error (HPE) P95 for each flight

Vertical Position Error (VPE) P95 for each flight

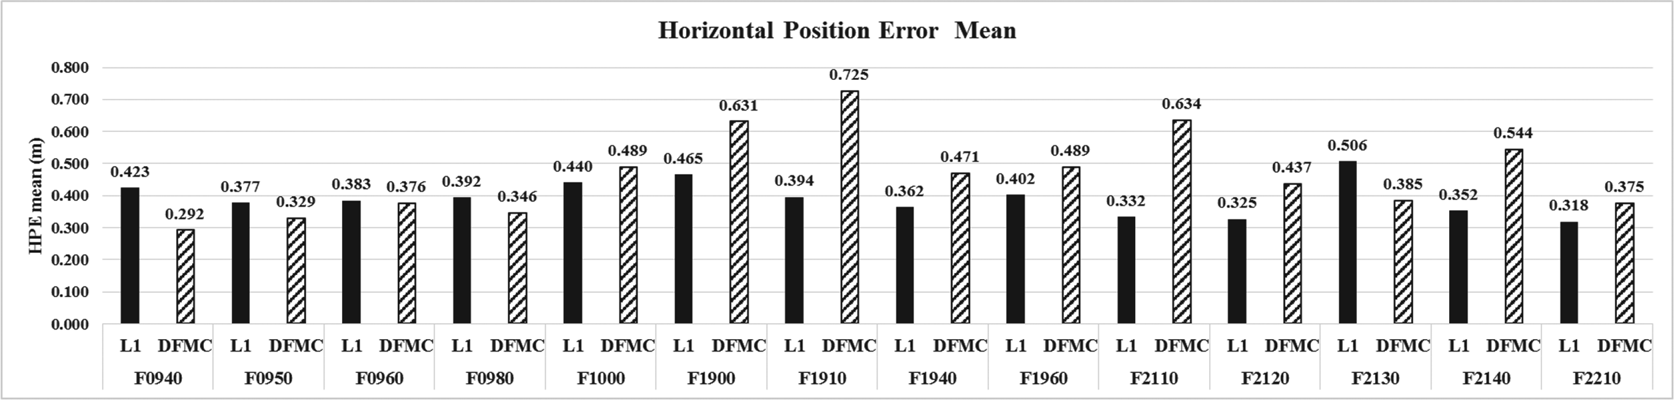
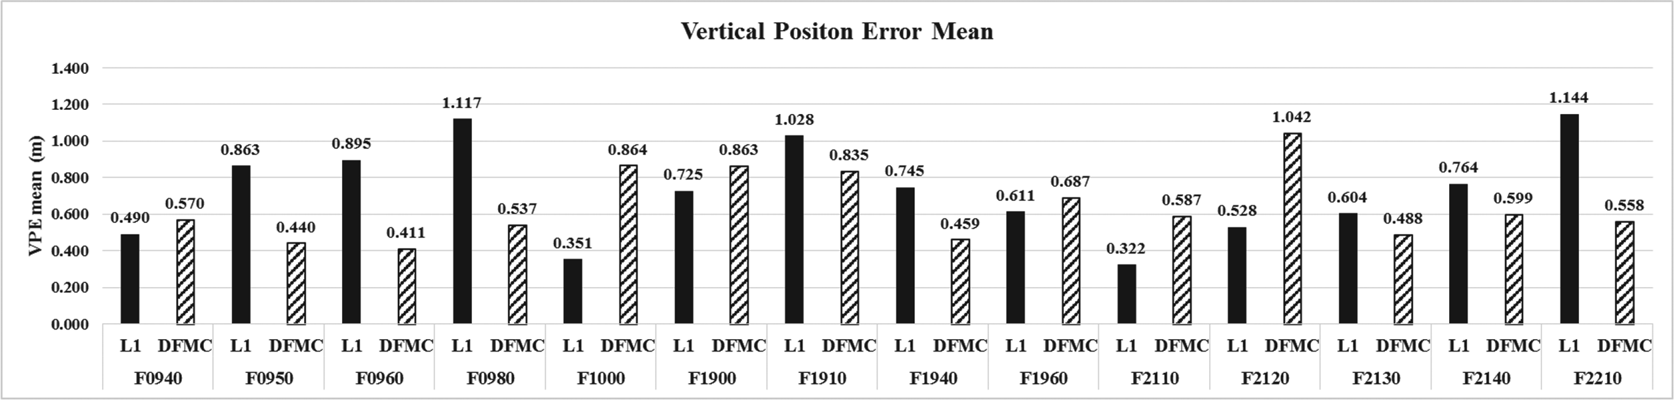
Figures 11 and 12 summarise the mean horizontal and vertical position error for each flight and for each tested positioning solution.
Horizontal Position Error (HPE) mean for each flight

Vertical Position Error (VPE) mean for each flight

4.3 Kinematic protection level results summary
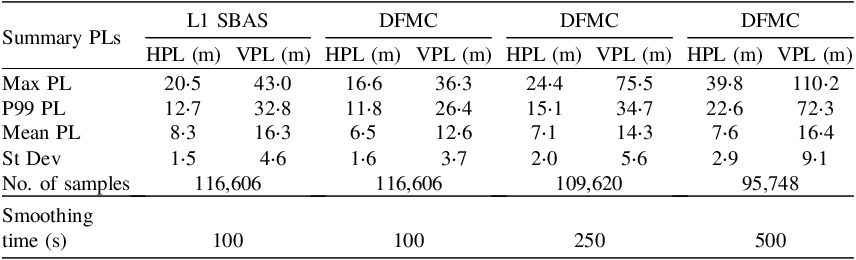
Table 8 provides the aggregated statistics of the protection levels for all test flights. On average the DFMC SBAS provided better HPL and VPL than the L1 SBAS. This results in a greater error margin for the safe provision of the navigation service, for which it is only relevant that the protection level remains lower than the alert limit. It should be noted that DFMC SBAS protection levels (particularly the 99th percentile statistics) are also degraded as the smoothing time is increased. Again, this is a consequence of the lower number of satellites available in the antenna line-of-sight, resulting from smoothing filter resets due to measurements outages across the two utilised frequencies. As described in the accuracy analysis, this degradation may not be as pronounced in an operational system with a certified receiver and might account for the higher number of data gaps observed using the chosen experimental equipment.
Summary of Protection Level – All flights

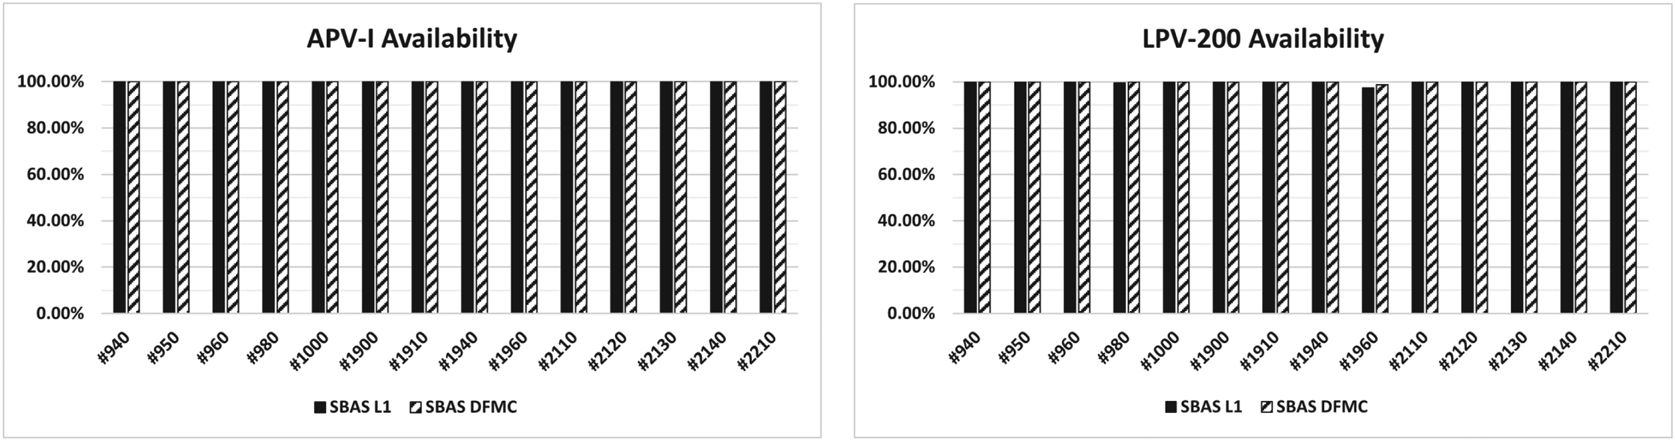
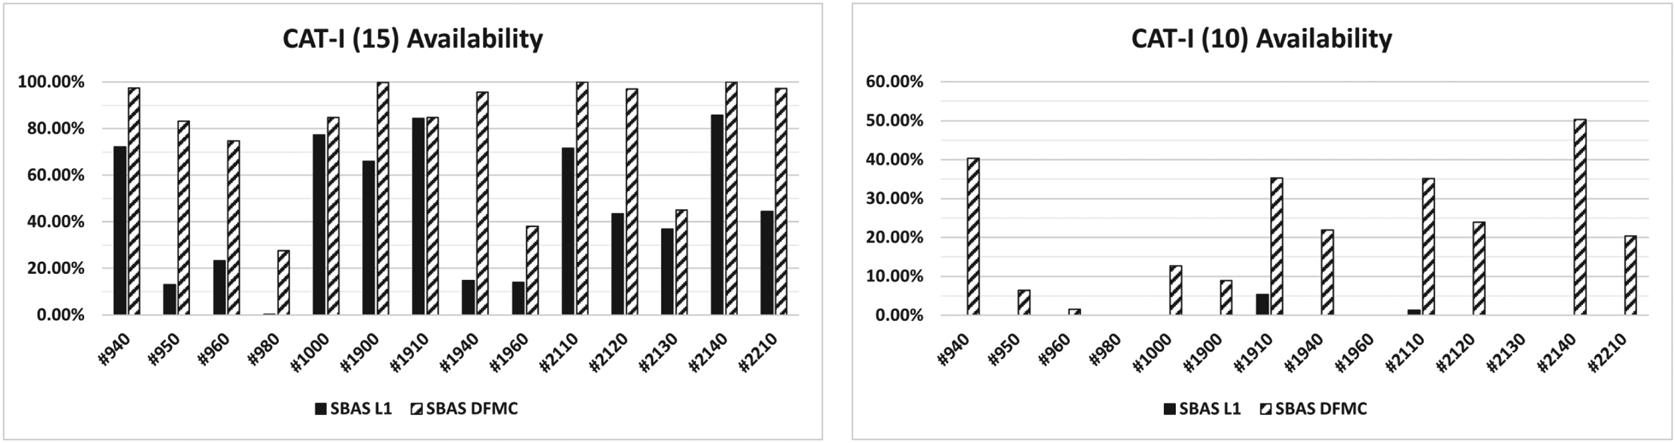
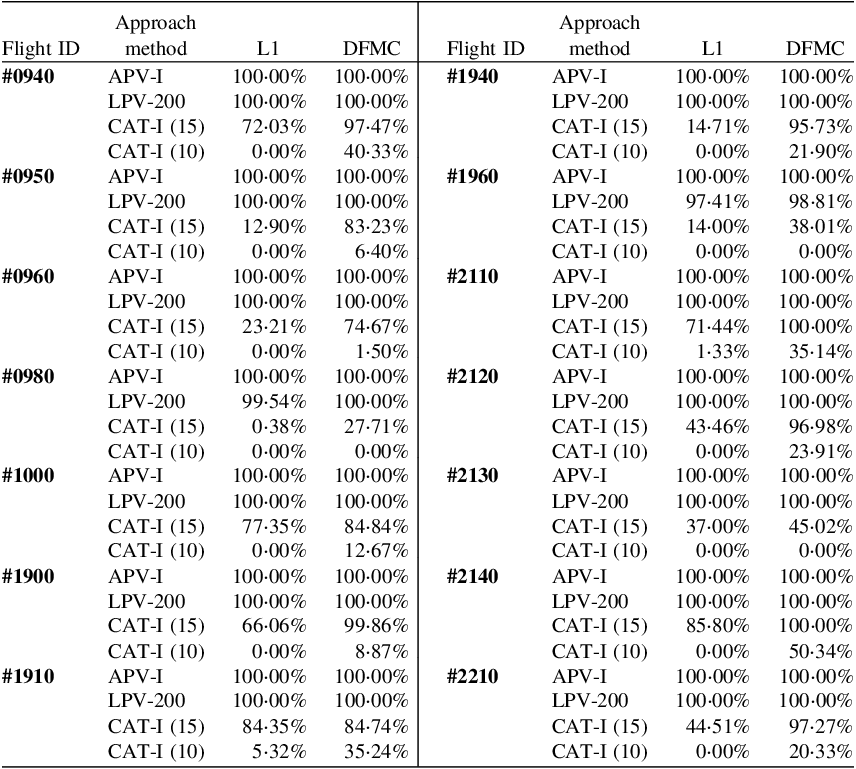
Figures 13 and 14 depict the availability achieved during each flight trial with each of the navigation procedures.
Availability per flight for APV-I and LPV-200 procedures

Availability per flight for CAT-I (15) and CAT-I (10) procedures

Figures 15 and 16 present an aggregated Stanford diagram for all test flights. These Stanford diagrams illustrate the level of integrity of the solution by plotting the position error against the protection level for each positioning solution. The colour is used to represent the density of points for a common result. Any points under the diagonal axis would be representative of MI/HMI events, in which the protection level was exceeded by the position error, considered to be an integrity failure. These figures confirm that no integrity failures were observed during the flight trials.
L1 SBAS Stanford Diagram for all flights; Horizontal (left) and Vertical (right)

DFMC SBAS Stanford Diagram for all flights; Horizontal (left) and Vertical (right)

Table 9 provides the availability statistics for all flights, and each corresponding precision approach tested. Each of the DFMC results are presented with a smoothing time of 100 s.
Availability statistics for all flights

All flights processed achieved the level of performance required for APV-I and LPV-200 procedures with the exception of Flight 1960, which experienced a small service outage to the LPV-200 approach. As expected, the results are much worse for CAT-I procedures. This is once again in line with level of service expected to be provided by the SBAS service.
The protection levels were found to be highly correlated with the dilution of precision (DOP), which is influenced by the geometry and number of SV tracked and used by the receiver during the approach procedure. Figure 17 highlights this correlation of DOP with VPL during Flight 1940, suggesting that the primarily influence is satellite geometry, rather than aircraft kinematics or filter resets. This correlation remained consistent across HPL and VPL for each the flights examined.
Correlation of DOP and VPL (Flight 1940)

Three representative flights have been chosen for further analysis, which are Flights 1940, 1960 and 2140. These particular flights were chosen to highlight the range of performance characteristics experienced during trials, and the variation between flights in different geographic locations and conditions. The following sections detail results for these three flights.
4.4 Detailed kinematic results – Flight 1940
Figure 18 shows graphs for HPE/HPL and VPE/VPL during flight 1940 for both L1 SBAS and DFMC. Whilst it can be observed that the position errors appear to be at a similar level, the DFMC error varied more significantly during the flight. Despite this, there is a clearly evident reduction in the protection levels (both horizontal and vertical) using DMFC, and additionally, the DFMC protection levels appear far less noisy compared to L1 SBAS.
Flight 1940: VPE and VPL plots for L1 SBAS (left) and DFMC (right)

Figures 19 and 20 show the Stanford diagrams for L1 SBAS and DFMC precision approaches for flight 1940. Analysis of the L1 SBAS solution for flight 1940 indicated no MI or HMI events during approach, with 100% service availability for both APV-I and LPV-200 approaches. As expected, the CAT-I approaches recorded lower availability, remaining available through 14ṡ71% of the 15 m VAL approach, and unavailable throughout the 10 m approach. The vertical protection levels are clustered between 13 and 22 m, with a small group of apparent outliers occurring around 27 m.
Flight 1940: Vertical Stanford Diagrams for L1 SBAS precision approaches

Flight 1940: Vertical Stanford Diagrams for DFMC SBAS precision approaches

Analysis of the DFMC solution for flight 1940 also indicated no MI or HMI events, with 100% service availability for both APV-I and LPV-200 approaches. CAT-I approaches achieved a significant reduction in both HPL and VPL compared to L1 SBAS. The 15 m VAL maintained 95ṡ73% availability (+81%), while the 10 m VAL was 21ṡ90% available (previously 0%). The vertical protection levels are clustered between 9 and 16 m, with a small group of outliers appearing near 20 m.
4.5 Detailed kinematic results – Flight 1960
Figure 21 shows HPE/HPL and VPE/VPL results during Flight 1960 for both the L1 and DFMC SBAS solutions. Figure 21 shows that the VPLs for DFMC SBAS are slightly smaller in comparison with L1 SBAS, however the HPE and VPE of the DFMC solution are more variable, breaching 2 m VPE more often during the flight. These local increases in HPE and VPE have not resulted in significant spikes in HPL or VPL, which remained lower in value and more consistent throughout.
Flight 1960: VPE and VPL plots for L1 SBAS (left) and DFMC SBAS (right)

Figures 22 and 23 show the Stanford diagrams for L1 SBAS and DFMC precision approaches for Flight 1960. Flight 1960 also indicated no MI or HMI events and 100% service availability for the APV-I approach, yet only achieved 97ṡ41% availability during the LPV-200 approach. The 15 m CAT-I VAL approach achieved 14ṡ00% availability, while the 10 m VAL reported 0% availability. These results indicate that Flight 1960 experienced quite variable performance using the L1 SBAS solution; the VAL is loosely clustered between 12 m and 35 m, with another cluster between 36 m and 42 m that shows higher VPE. The LPV-200 approach uses a 35 m VAL, so this cluster has caused the system to lose availability.
Flight 1960: Vertical Stanford Diagrams for L1 SBAS precision approaches

Flight 1960: Vertical Stanford Diagrams for DFMC precision approaches

The DFMC SBAS solution also indicated no MI or HMI events, achieving 100% availability for the APV-I approach, yet only 98ṡ81% availability during the LPV-200 approach.
The DFMC SBAS LPV-200 approach saw an increase of 1ṡ4% availability, the CAT-I 15 m VAL approach achieved 38ṡ00% availability (+24ṡ01%), and the 10 m VAL was also 0% available. The DFMC SBAS solution shows much of the data is clustered between a VAL of 11 m and 28 m, with another small cluster around 35 m. Again, LPV-200 uses a 35 m VAL; thus, this cluster has caused the system to lose availability during the approach.
4.6 Detailed kinematic results – Flight 2140
Figure 24 shows HPE/HPL and VPE/VPL results during Flight 2140 for both L1 and DFMC SBAS solutions. The large HPL and VPL spikes observable around epoch 354,500 in the L1 solution have been reduced significantly in the DFMC solution and are no longer the local maxima. Both DFMC solutions have produced less variability, with reduced small-scale oscillations and overall improved precision.
Flight 2140: VPE and VPL plots for L1 SBAS (left) and DFMC (right)

Figures 25 and 26 show the Stanford diagrams for L1 SBAS and DFMC precision approaches for Flight 2140. The L1 SBAS solution for Flight 2140 indicated no MI or HMI events during approach, with 100% service availability for both APV-I and LPV-200 approaches. The CAT-I approaches recorded lower availability as expected; the 15 m VAL approach maintained 85ṡ80% availability, while the 10 m VAL reported 0ṡ00% availability. These results suggest that the L1 SBAS solutions may be able to meet CAT-I (15 m) standards in some cases but are unlikely to achieve the requirements for CAT-I (10 m) precision approaches. The VPLs are clustered between 12 m and 18 m, showing the greatest density around 12ṡ5 m with a positive skew and few outliers near 19 m.
Flight 2140: Vertical Stanford Diagrams for L1 SBAS precision approaches

Flight 2140: Vertical Stanford Diagrams for DFMC SBAS precision approaches

The DFMC solution for Flight 2140 also indicated no MI or HMI events, with 100% service availability for both APV-I and LPV-200 approaches. The CAT-I approaches achieved lower availabilities as expected, however the DFMC solution achieved a 2ṡ53 m reduction in HPL and 4ṡ67 m reduction in VPL compared to L1, resulting in increased availability for both CAT-I DFMC approaches. The 15 m VAL approach maintained 100% availability (+14ṡ2%), while the 10 m VAL had 50ṡ35% availability (previously 0%). The VPLs are clustered between 9 m and 13 m, with the greatest density around 11 m and no obvious skew. The DFMC solution of Flight 2140 has reduced the variability of the protection levels and reduced skew.
5. Conclusions
From the 14 flight scenarios analysed, 13 scenarios were found to meet the ICAO requirements for availability during the APV-I and LPV-200 approaches. One scenario (Flight 1960) experienced a large spike in VPL, exceeding the 35 m VAL and resulting in loss of availability during a portion of the LPV-200 approach. This behaviour was observed in both L1 SBAS and DFMC SBAS solutions. All other flights achieved 100% availability for the APV-I and LPV-200 approaches.
CAT-I results generally did not meet ICAO requirements; most availabilities were significantly lower than the standard for both 10 m and 15 m VAL, though two flights achieved 100% availability for the 15 m VAL using DFMC SBAS.
Compared to L1 SBAS, the DFMC SBAS solution generally maintained an equivalent level of precision, reduced protection levels during approach, and improved service availability.
The analysed performance of both L1 and DFMC SBAS positioning solutions suggests performance suitable for use in civil aviation and highlights the potential for DFMC SBAS to perform more robustly than L1 SBAS corrections. The system has reported sufficient availability, both with L1 and DFMC, to enable aerodrome approaches to be designed in keeping with the ICAO SARPs, and without reliance on ILS infrastructure.
The L1 SBAS and DFMC SBAS signals have the potential to allow CAT-I aerodrome approaches to be safely and reliably conducted throughout Australia and New Zealand. As the DFMC SBAS approach inherently mitigates ionospheric impacts, it may be considered as a more robust method of vertical guidance, particularly suited to flight operations in equatorial regions. Future flight testing and detailed analysis using operational DFMC corrections across more geographic regions would help to quantify the impact of any significant atmospheric effects near the equator and provide further insight into the behaviour and limitations of the DFMC SBAS solution. Additional research is suggested to further examine the relationship between smoothing time, position error, protection levels and solution availability using an operational DFMC system, to support a thorough investigation of the optimal smoothing time configuration for the region.
Acknowledgements
The primary author would like to thank Julián Barrios, Miguel A. Fernández and Fernando Bravo from GMV for providing technical assistance with data processing and visualisation, and for taking the time to assist with review and revisions to this paper. Thankyou to Airservices Australia for conducting the flight trials during the SBAS test-bed and collecting the data that formed the basis of this research, and for their subsequent support and review. I would also like to thank FrontierSI for supporting this research, specifically Eldar Rubinov for your help and guidance, and, of course, my Master's research partner Chris Lambert for your dedicated work on processing and analysis.
Conflict of interest
None.