Nomenclature
- AI
-
Artificial intelligence
- AUC
-
Area under the curve
- CAE
-
Convolutional auto-encoder
- CBLSTM
-
Convolutional bi-directional long short-term memory
- CNN
-
Convolutional neural network
- DR
-
Discrimination and reconstruction
- FN
-
False negative
- FP
-
False positive
- FSE
-
Fujitsu systems europe
- GAN
-
Generative adversarial network
- DL
-
Deep learning
- DR
-
Discrimination and reconstruction
- LSTM
-
Long short-term memory
- MAD
-
Multivariate anomaly detection
- MHM
-
Machine health monitoring
- RNN
-
Recurrent neural networks
- RUL
-
Remaining useful life
- STD
-
Standard deviation
- SVM
-
Supporting vector machine
- TN
-
True negative
- TP
-
True positive
Symbols
- C t
-
centroid of statistical features for training data
- D v
-
distance to centroid for validation data
- μ
-
mean value
- σ
-
standard deviation (STD)
- υ
-
boundary factor for one-class support vector machines
- S
-
skewness value
- τ
-
detection threshold
1.0 Introduction
In the last decade, deep learning (DL) has seen remarkable success in image recognition and natural language processing, and researchers are now eager to apply DL to machine health monitoring (MHM). Since most machine health data come from healthy machines, data from real-world faulty machines is very scarce, making many MHM problems anomaly detection problems for time-series data. In a survey of real-world applications for anomaly detection, Choi et al. [Reference Choi, Yi, Park and Yoon1] summarised DL-based techniques, highlighting certain application specific approaches and the lack of a universal approach. They compared recently developed deep anomaly detection models for time series using benchmark datasets and offered guidelines of selecting models and training strategies. Zhao et al. [Reference Zhao, Yan, Chen, Mao, Wang and Gao2] provided an extensive review of the application of DL to MHM problems and identified four categories of DL architectures that can be applied: auto-encoder models, restricted Boltzmann machines models, convolutional neural networks (CNN) and recurrent neural networks (RNN). They identified the ability to build machine health workflows without the need for hand-crafted features tailored to each machine and the ability to work with large data sets as the key advantages of DL methods. We have recently observed an exponential growth in the number of studies of applying DL to MHM and mechanical fault diagnostics. There were over 1,000 research papers and many review papers in the literature between 2019 and 2021 [Reference Wang, Taylor and Rees3]. Despite many application cases, we believe that the MHM application of DL methods remains in its infancy and is likely to see continued substantial and rapid development that may further benefit the MHM field. A key point that critics could argue is whether DL methodologies are always superior to more traditional approaches to solving MHM problems.
In this paper, we will discuss this question using a real-world helicopter sensor fault dataset provided by Airbus, which is a challenging machine learning problem of unsupervised classification. In the 2019 worldwide artificial intelligence (AI) challenge with this dataset hosted by Airbus, the first prize was won by Fujitsu Systems Europe (FSE) with an F1-score of 93% using a DL model based on the generative adversarial network (GAN), refer to the original paper of the method by Li et al. [Reference Li, Chen, Jin, Shi, Goh and Ng4]. Another comprehensive study using the Airbus dataset by Garcia et al. [Reference Garcia, Michau, Ducoffe, Gupta and Fink5, Reference Garcia, Michau, Ducoffe, Gupta and Fink6] compared the performance of various modified and the existing image encoding methods for the convolutional auto-encoder (CAE) model. They achieved the best F1-score of 91% using the scalogram as the image encoding method. We will use these two studies as the benchmark for us to compare with basic statistical analyses and traditional machine learning methods. We conclude in this comparative study that the DL-based techniques have great potential but they are not necessarily always superior to traditional methods.
The rest of the paper is structured as follows. The information about the Airbus dataset is summarised in Section 2, followed by the review of the results generated using the DL approaches and other potentially useful DL techniques in Section 3. In Section 4, the data are analysed using conventional methods with some commonly used statistical features. A simple statistical method, a distance-to-centroid method and a one-class supporting vector machine (SVM) were applied and their results are reported and compared to those of the deep learning methods. In Section 5, concluding remarks are presented.
2.0 The Airbus helicopter sensor fault dataset
One of the main challenges in aerospace industry is to test the validity of flight test data from heavily instrumented aircraft due to possible faulty sensors. Ensuring that healthy sensors are used for aircraft health monitoring is of vital importance because faulty sensors can lead to incorrect or misleading detection and diagnosis of aircraft faults, which in turn affects the safe flight of aircraft. Because of the sheer volume of measured signals that need to be validated, manual validation is no longer possible. It is crucial to automate the validation process. For this purpose, Airbus collected and released a set of helicopter vibration measurement data from different flight tests – publicly available on https://doi.org/10.3929/ethz-b-000415151.
Damage tolerant structures and redundant systems are relevant design features for aircraft safety. Multiple vibration sensors installed on a helicopter may arguably be seen as an increased redundancy and tolerance of sensor damage. In all operating conditions of the helicopter collected from different flights, multiple accelerometers were placed at different positions of the helicopter, in different directions (longitudinal, vertical, lateral) to measure the vibration signals with a constant sampling rate of 1,024Hz and sampling length of 1 minute. The training data is composed of 1,677 accelerometer data sequences from healthy sensors. The testing (or validation) data has 594 sequences consisting of streams from either healthy or faulty sensors. Measurement locations and directions in the testing data may or may not be identical to those of the training data. All signals in the dataset were normalised so that absolute values do not have physical meaning.
With this dataset, Airbus hosted a worldwide AI challenge in 2019 to classify the testing sequences into healthy and faulty sequences. Firstly, only the training data were released for model training to ensure that all the models were trained without a priori knowledge about the testing data. After the submission of trained models, Airbus released the testing data.
3.0 Review of results by deep learning methods
Among the 140 competing teams, FSE won the first prize with an F1-score of 0.93 using a DL model based on multivariate anomaly detection with the generative adversarial network (MAD-GAN) (https://www.fujitsu.com/emeia/about/resources/news/press-releases/2019/emeai-20191211-fujitsu-wins-first-prize-for-predictive.html). There is no publication about the details of the winning method. In the original paper of MAD-GAN [Reference Li, Chen, Jin, Shi, Goh and Ng4], an unsupervised multivariate anomaly detection method was proposed based on GANs. The authors used the long short-term memory based recurrent neural networks (LSTM-RNN) as the base models for both the generator and discriminator in the GAN framework. Their MAD-GAN framework treated the entire variable set concurrently and each data stream independently to capture the latent interactions amongst the variables. They used a novel anomaly score (DR-score) to detect anomalies through the discrimination and reconstruction (DR) phases. The test results showed that the proposed MAD-GAN is an effective method in detecting anomalies caused by cyber attacks on some complex real-world digital systems. Apparently, FSE’s winning result proved the efficacy of MAD-GAN in detecting anomalies caused by faulty sensor measurements.
Garcia et al. [Reference Garcia, Michau, Ducoffe, Gupta and Fink5] stressed the fact that it is uncommon to find application cases of unsupervised DL (e.g. AE and CNN)-based anomaly detection. They compared six image encoding strategies such as Gramian angular field, Markov transition field, recurrence plot, grey scale encoding, spectrogram and scalogram to transform the raw time series data into images for a CAE network. They defined a more robust encoding method by modifying each of these six existing algorithms. Training the DL model only on healthy condition data, they extracted the 99th percentile in the distribution of the residuals of all sub-series to define the detection threshold τ. They then monitored the maximum residual over the sub-series (for the detection of local anomalies) and measured it against the threshold τ beyond which an anomaly is considered detected. Using the Airbus dataset, they conducted a comprehensive study comparing the modified and the existing encoding methods and showed an improved performance by using the encoded images against using the raw time series. All the modified versions were observed to perform better than their un-modified counterparts, in which the scalogram indicated the best performance with an F1-score of 0.91 and area under the curve (AUC) score of 0.92.
There are several highly cited studies in the literature that demonstrated improved MHM results delivered by DL, which may potentially be applied to the Airbus dataset. General consensus is that it is difficult to feed the raw sensory data like the Airbus dataset directly into classification and regression models. This is why many previous works focused on feature extraction/fusion methods that requires expensive human labour and high-quality expert knowledge. Based on the development of DL methods in previous years, which redefined representation learning from raw data, Zhao et al. [Reference Zhao, Yan, Wang and Mao7] designed a deep neural network structure of convolutional bi-directional long short-term memory networks (CBLSTM) to address the raw sensory data. The CBLSTM firstly used CNN to extract local features that are robust and informative from the sequential input. The bi-directional LSTM was used to encode temporal information, where the LSTM captures long-term dependencies and models the sequential data, and the bi-directional structure allows the past and future contexts to be captured. Then, fully connected layers and the linear regression layer were stacked on top of bi-directional LSTMs to predict the target value. They applied this method to a tool wear test dataset, and found that the CBLSTM was able to predict the actual tool wear with raw sensory data input. The experimental results showed that their model outperformed several state-of-the-art baseline methods.
Li et al. [Reference Li, Zhang and Ding8] proposed a novel intelligent remaining useful life (RUL) prediction method based on DL. The time-frequency domain information was explored for prognostics, and multi-scale feature extraction was implemented using the CNN. A popular rolling bearing dataset prepared from the PRONOSTIA test platform was used to show the effectiveness of the proposed method. By comparing other approaches, they demonstrated the superiority of the proposed method with highly accurate RUL prediction. Using transfer learning to enable and accelerate the training of deep neural network, Shao et al. [Reference Shao, McAleer, Yan and Baldi9] developed a new DL framework to achieve highly accurate machine fault diagnosis. They demonstrated that the proposed method was faster to train (e.g. less epochs) and more accurate (e.g. quantified by both positive and negative predictions) by comparing with other existing methods. They first converted original sensor data to images using a wavelet transform to obtain time-frequency distribution images. They used a pretrained network to extract lower-level features. They then fine-tuned the higher levels of the neural network architecture with labelled time-frequency images. They used three datasets of induction motors, gearboxes and bearings with sizes of 6,000, 9,000 and 5,000 time-sequences, respectively, to verify the effectiveness and generalisation of the proposed technique. They achieved a test accuracy of nearly 100% on each dataset, and a significant improvement from the previous benchmark of 94.8–99.64% in accuracy with the gearbox dataset.
4.0 Results by non-deep learning-based techniques
We will use the results from the above two studies with the Airbus dataset where F1-scores were 0.93 and 0.91 by FSE and Garcia et al., respectively, as the benchmark for us to compare with simple statistical analyses, a distance-to-centroid method and a one-class SVM classifier.
4.1 Simple statistical analysis method
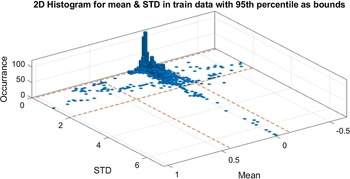
Using basic statistical analyses, we propose a new simple statistical technique in the paper to classify the sensor health data. We firstly calculate the two most commonly used statistics, i.e. the mean μ and the standard deviation (STD) σ, for every sequence (1,677 in total) in the training data. We then visualise the distributions of the mean and STD values by a 2D histogram (histogram2 in Matlab) as shown in Fig. 1. As we can see that the distributions are widely spread on both side of the mean values and mostly on the right side of the STD values. With a given rate of outliers, e.g. 5% (or 2.5% on either side) as opposed to the two-sigma principle for a Gaussian distribution, we can draw the boundary lines as indicated by the four red dashed lines in Fig. 1. This rate can be prescribed based on the practical requirements of false positive (or false alarm) rate or false negative (or missed detection) rate. For example, in aerospace industry false negative can be fatal thus it should be minimised by using a relatively large rate of outliers, such as the 5% chosen here.
2D histogram of mean and STD values in the training dataset (red dashed lines are bounds set by 95th percentiles).

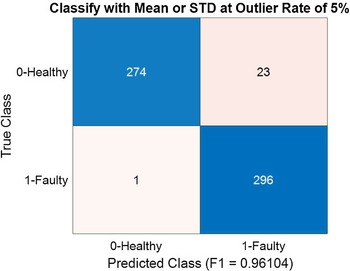
In classification with the testing (or validation) data, we obtain the μ and σ values for each of the 594 sequences and compare them with the boundary values obtained from the training data. If either the μ or σ value from a sequence in the testing data goes beyond the respective boundary values, we classify this as positive, i.e. the sequence was from a faulty sensor. This represents the essence of our simple statistics-based classification method. The classification result is presented in a confusion matrix shown in Fig. 2. In the testing data, the ground truth is that there are 297 negative sequences (measured by healthy sensors) and 297 positive sequences (measured by faulty sensors). We can see that the true positive (TP) rate, or the recall score, is very high at 99.66%, and a good F1-score of 0.961, which is in fact better than the results delivered by the DL-based methods at considerably reduced computational cost and complexity. The F1-score here is defined as:
 \begin{equation}{\rm{F}}1{\rm{\;}} = {\rm{\;}}{{2 \times {\rm{TP}}} \over {2 \times {\rm{TP\;}} + {\rm{\;FP}} + {\rm{\;FN}}}}\end{equation}
where TP, FP and FN are true positive, false positive and false negative, respectively.
Confusion matrix using a simple statistical analysis method with a recall score of 99.66% (296/297) and a F1-score of 96.1%.

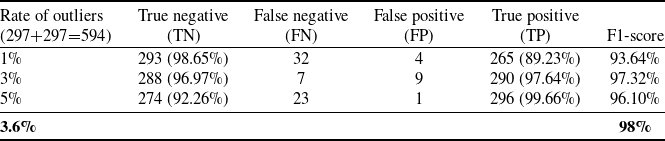
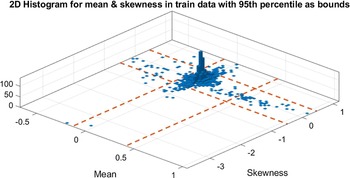
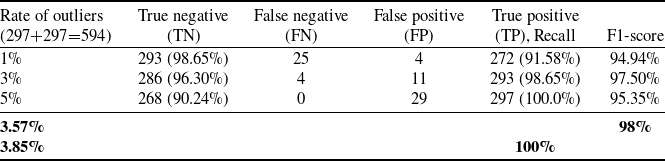
When other outlier rates are chosen, the results are summarised in Table 1. We can see the results at the outlier rate of 3% have improved the classification performance with an F1-score of 0.9732. If we would know a priori the ground truth in the testing data, we could further optimise the F1-score by searching for the outlier rate. We found that the best F1-score of 0.98 can be achieved by setting the outlier rate to 3.6% while using the μ and σ values as the features. We can replace the STD with the skewness S (a 3rd order statistic), where the corresponding results can be seen in Fig. 3 and Table 2. Obviously, replacing STD with skewness produces lower F1 scores. The mean plus skewness combination may not be able to detect the possible faulty-sensor sequence of all-zero values, which has a STD of zero and a skewness of infinity (or NAN – not a number).
Classification with mean and STD as features

Classification with mean and skewness as features

2D histogram of mean and skewness values in the training dataset.

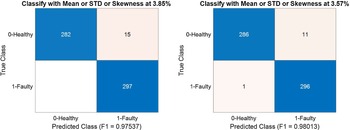
The corresponding results with the three-feature combination of μ, σ and S are listed in Table 3. We can see that an extra feature of skewness only improves the performance marginally from the μ and σ combination at the outlier rates of 1 and 3%, and produces weaker performance at the 5% outlier rates. Further with the three-feature combination, we have found the highest recall score (100%) at outlier rate of 3.85%, and the highest F1-score (98.01%) at 3.57% outlier rate, as shown in Fig. 4. It is worth noting that the detection criterion is through an ‘OR’ logical operator, where as long as one of the features goes out of bounds, we will have a positive (or faulty sequence) detection. Perhaps the ‘OR’ operation among the three features made the difference for the superb performance by the simple statistical analysis method, which will be explored further in Section 4.2. In addition, we added the fourth feature of kurtosis (the 4th order statistic) and found that the added feature does not help improve the performance. Despite the fact that it would be difficult to choose the right outlier rate before knowing the ground truth a priori, we can demonstrate that the simple statistical analysis method with any reasonable outlier rate is at least comparable to the two DL-based methods discussed previously.
Classification with mean, STD and skewness as features

Confusion matrices using a simple statistical analysis method with the highest recall score of 100% (left) and the highest F1-score of 98.01% (right).

4.2 Absolute distance to centroid method
To verify that the ‘OR’ operation among the three features was the key to achieve the remarkable performance by the simple statistical analysis method, we can fuse the three features into a distance-to-centroid metric for classification with the selected outlier rates, which is another novelty of the paper. The outlier is measured by the absolute distance to the centroid of the three statistical features. Using the same statistical features such as mean, STD and skewness for the training data, we firstly calculate the centroid (same as the median for this Airbus dataset), denoted as C t = [C μ , C σ , C S ]. For the validation data, we calculate the features (mean μ, STD σ and skewness S) for each of the 594 sequences, then we obtain the absolute distances D v by the sum of the three absolute differences
 \begin{equation}{D_v} = \left| {\mu - {C_\mu }} \right| + \left| {\sigma - {C_\sigma }} \right| + \left| {S - {C_S}} \right|\;\end{equation}
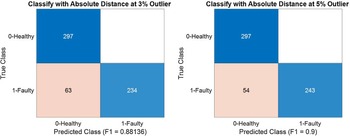
With two selected rates of outliers at 3 and 5%, we obtained the confusion matrices shown in Fig. 5. We can see that the absolute distance to centroid method is not performing as well as the simple statistical method with the ‘OR’ operation and the benchmark DL methods by the F1-score, despite that the former has the highest precision score of 100%. The low recall score (79% and 82%), meaning too many missed detections of faulty sensors, tend to prevent this method from being the ideal choice for this application which is to identify faulty sensors and for other aerospace applications. The results presented in Fig. 5 confirms the importance of the ‘OR’ operation among the three features to achieving the better performance by the simple statistical analysis method.
Confusion matrices using the absolute distance to centroid method with the highest precision score of 100% but lower F1-scores than those in Section 4.1 and the benchmark scores by the DL methods.

4.3 One-class SVM classification with simple statistics
SVMs were developed to classify datapoints separated by complex (i.e., non-linear) multidimensional boundaries [Reference Cortes and Vapnik10]. Subsequently, SVMs were extended to address single-class classification problems, where the points belonging to the single class are separated by a hyperplane from the points regarded as ‘outliers’. For this reason, one-class SVMs are considered as robust unsupervised outlier detection algorithms, and they have been widely used in machine fault monitoring and anomaly detection problems over the past two decades [Reference Fernández-Francos, Marténez-Rego, Fontenla-Romero and Alonso-Betanzos11, Reference Widodo and Yang12]. One advantage of using one-class SVMs for machine condition monitoring is that they only require healthy data to fit a hyperplane that is then used to identify anomalous behaviour (i.e. points outside the hyperplane). They also have the benefit of providing a strong generalisation ability using relatively small-sized datasets [Reference Bi, Bennett, Embrechts, Breneman and Song13], which is a crucial aspect for machine condition monitoring applications.
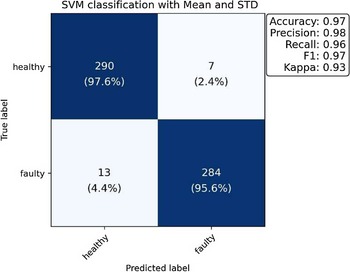
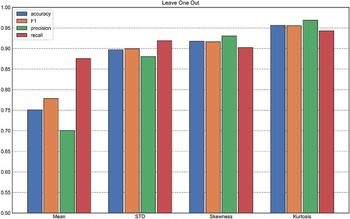
Therefore, we tested the ability of a one-class SVM to identify the anomalous or faulty sequences in the Airbus dataset. The one class SVM was set up with radial-basis-functions kernel and a boundary factor of υ = 0.1 (usually the default value). Instead of giving the full sequences to the SVM, we used the same pre-computed statistical features (mean, STD, skewness and kurtosis) as inputs. When using mean and STD only, a F1-score of 97% was achieved (Fig. 6), which compares well with the F1-score of 96% in Fig. 2. We also conducted a leave-one-out analysis to see which features were the most important out of the four tested, the accuracy metrics for each case are presented in Fig. 7.
Classification result using a one-class SVM with mean and STD as features.

Leave-one-out analysis showing the effect of excluding one of four different statistical features from the one-class SVM classification.

It seems that the most important feature is the mean, as when it is left out the accuracy drops significantly, while when leaving out the kurtosis, all four accuracy-metrics improve to almost 95%. This is in agreement with the previous results with simple statistical analysis method.
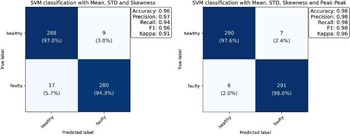
We further show in Fig. 8 the performance of different combinations of statistical features, including mean-STD-skewness as well as the same combination including peak-to-peak (maximum minus minimum of each sequence). We can see that the mean-STD-skewness combination performs slightly worse than mean-STD only, while including peak-to-peak produces the best result with a recall score of 0.98 and F1-score of 0.98.
Classification results of one-class SVM with different combinations of statistical features.

4.4 Analysis of the ground truth data
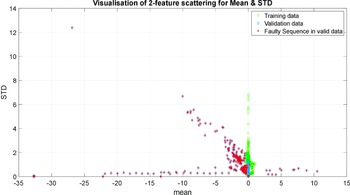
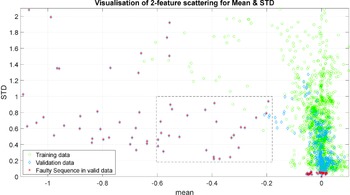
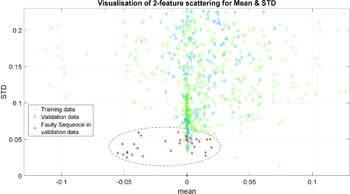
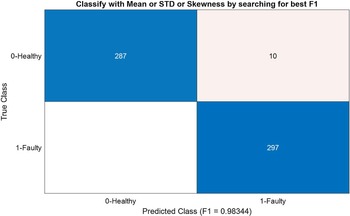
To analyse the ground truth data, we propose a simple way of visualising the training and validation data. Figure 9 displays scatter plots of two statistical features, μ and σ, along with zoomed-in versions of two marked areas in Figs 10 and 11. The marked areas contain 26 and 33 positive data sequences acquired by faulty sensors, which are challenging to distinguish from negative points in the training data (represented by green circles). In particular, the area in Fig. 11 presents a difficult case, requiring a lower threshold of σ < 0.06 for better classification. Without this threshold, the best classification result achievable through simple statistical analysis is an F1-score of 93.5%. However, with the lower σ threshold at 0.06, the F1-score can be increased to 98.34% by adjusting other bounds or thresholds that have a lesser impact on the F1-score (see Fig. 12). In addition, nine out of the ten false positive (FP) points shown in Fig. 12 can be located within the area of σ < 0.06 in Fig. 11.
Scatter plot of the two statistical features.

Scatter plot of the two statistical features – zoomed version of Fig. 9 (dashed box with 26 positives is the first difficult area in to classify).

Scatter plot of the two statistical features – zoomed version of Fig. 9 (dashed oval with 33 positives is the second difficult area to classify).

Classify with mean of [−0.2, 0.7], or STD of [0.06, 1.5] or skewness [−0.6, 0.7] where the lower threshold of STD at 0.06 is the most influential bound.

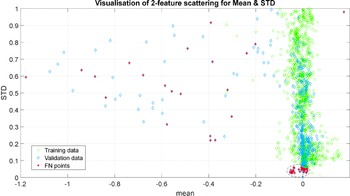
It is suspected that the distance-to-centroid method misclassified most of these two difficult areas, resulting in a F1-score of only 90%. These areas account for approximately −10% in true positive (TP) cases and +10% in false positive (FP) cases if misclassified, i.e. (26+33)/594 = 0.0993, which may explain why the distance-to-centroid method reaches a ceiling F1-score of around 90%, as shown in Fig. 5. This suspicion is supported by Fig. 13, where 54 false negative (FN) points are marked by red asterisks. It is clear from Fig. 13 that the dashed circle area in Fig. 11 is mostly misclassified (33 out of 43).
Classify with distance to centroid method at 5% outlier rate, misclassified (FN) points in red * symbols and the dashed circle area is mostly (33 FN out of 43) misclassified.

5.0 Concluding remarks
In traditional machine learning, unsupervised classification can be a challenging problem. Deep learning-based methods have demonstrated significant potential to address this challenge. With the Airbus dataset, deep learning methods, such as the GAN and CAE, can deliver good performance in classifying sensor data into ‘good’ or ‘bad’ when the deep learning models are trained on ‘good’ data only. In this paper, we are not disputing the effectiveness of deep learning methods, rather we want to remind people that traditional statistical analysis and machine learning methods can often perform as well as, and sometimes better than, the newer and more sophisticated deep learning methods. In the example of the Airbus dataset, most of our simple statistical analysis methods and the one-class SVM with simple statistical features can outperform the deep learning counterparts. The absolute distance to centroid method performed less effectively than the DL learning benchmarks. However, one might argue that we could have seen the testing data prior to forming our framework, which would make the comparison unfair. Our counter argument would be to begin by using proven simpler methods as benchmarks before starting the journey of applying more complex and computationally expensive deep learning methods. For example, we have demonstrated that we could use the mean and standard deviation and 5% outlier in the training data, refer back to Fig. 1, to set up the boundaries/thresholds for anomaly detection without the need of any fine tuning by the testing data.
In conclusion, for MHM problems, it is not necessarily true that DL methods are always superior to traditional methods, and it is a good practice to start solving a MHM problem with simpler methods. Similar views and arguments can be found in a case study by Wang et al. [Reference Wang, Taylor and Rees14] in another DL application to MHM. Based on the results present here, we therefore recommend that where possible all future published studies of applying DL methods to MHM include appropriately selected traditional reference methods.