Introduction
Advanced maternal age causes reproductive system changes, including reduction of primordial follicle pool, decline in oocyte quality, increase in oocyte aneuploidy, and therefore reduced fertility (Barbieri et al., Reference Barbieri, Sluss and Powers2005). Menopause marks the end of the reproductive cycle for females, while the pressure on contemporary women continues to increase due to the increased average age of marriage and increased child-bearing age (Hunt and Hassold, Reference Hunt and Hassold2008; Merriman et al., Reference Merriman, Jennings and McLaughlin2012). How to improve success rates among advanced reproductive age women and how to reduce the risk of infertility among young women have become issues that researchers must solve.
Maternal ageing has evident adverse effects on both body conditions and reproduction. First, maternal ageing alters the endocrine levels of the mother herself, reduces oocyte reserves in the ovaries, and causes ovarian shrinkage and reproductive tract defects, and therefore pregnancy failure (Okamoto et al., Reference Okamoto, Kawamura and Kawamura2013). Secondly, maternal ageing has many adverse effects on oocytes: clustered distribution of mitochondria, spindle defects, rapid increase in the incidence of polyploidy (Rambags et al., Reference Rambags, van Boxtel and Tharasanit2014), and elevated ROS levels (Lister et al., Reference Lister, Kouznetsova and Hyslop2010; Yun et al., Reference Yun, Lane and Jones2014). Although there have been numerous reports on the effect of maternal ageing on oocytes (Schwarzer et al., Reference Schwarzer, Siatkowski and Pfeiffer2014), data on the effect of maternal ageing on DNA methylation of oocytes are limited.
Mammalian gametes originate from embryonic cells and are labelled with their own DNA methylation and histone modification marks, which ensures embryonic development (Mardis, Reference Mardis2008; Mortazavi et al., Reference Mortazavi, Williams and McCue2008). DNA methylation is a fundamentally important epigenetic modification of the mammalian genome that has a wide range of effects on gene expression. During the process of germ cell differentiation and maturation, the methylation level of cells undergoes great change due to reprogramming (Takahashi et al., Reference Takahashi, Takahashi and Igarashi2003; Cil et al., Reference Cil, Turkgeldi and Seli2015). Defects in this process have a major effect on embryonic development and are associated with several genetic diseases (McClintock, Reference McClintock1939; Blasco et al., Reference Blasco, Lee and Hande1997; Neumann and Reddel, Reference Neumann and Reddel2002). DNA methylation markers in oocytes are essential for the regulation of gene expression and proper embryonic development and offspring health.
The present study investigated the effects of maternal ageing on oocyte DNA methylation and gene expression profiles by single-cell RNA-sequencing (RNA-seq) and single-cell DNA whole-genome methylation sequencing and found that methylation and expression of reproduction-related genes, especially those related to mitochondria function, were altered.
Materials and methods
Animals
Eight-month-old ICR females were purchased from a company [SPF (Beijing) Biotechnology Co., Ltd] and raised to 18 months under the same feeding conditions; control animals were 8-week-old ICR mice purchased from the same company, and were used after 1 week of feeding. All mice were housed in a room under controlled temperature (23 ± 1°C), and ICR mice care and handling abided to the Animal Research Committee Guidelines of the Institute of Zoology, Chinese Academy of Sciences.
Oocyte collection
Germinal vesicle-stage oocytes of aged mice and control young mice were collected after individuals were sacrificed by cervical dislocation, and cumulus cells were completely removed by repeat pipetting. Because the numbers of oocytes in the individual aged mice were very few, 20 oocytes were collected from 12 mice and mixed in one droplet, eight oocytes were used for RNA-seq, and 12 were used for whole-genome bisulfite sequencing (WGBS).
Single-cell sequencing
Because the numbers of oocytes in aged mice were very few, single-cell sequencing was used to analyze the oocytes. For RNA-seq and whole-genome methylation sequencing, only 12 and 8 oocytes, respectively, were used.
Statistical analysis
All data were analyzed using bioinformatics techniques, the RNA-seq data and whole-genome methylation sequencing data were analyzed using the protocol published by Pertea et al. (Reference Pertea, Kim and Pertea2016). Data were mapped to the mouse genome (assembly mm9), which was downloaded from the University of California, Santa Cruz (UCSC), USA genome browser, both mapping rates were >90%, and the methylation conversion rate was >95%, Differences were filtered at P-value < 0.01 and |log| > 2.
Software
The following software were used:
Fastqc software (https://github.com/s-andrews/FastQC/releases)
Bowtie2 software (http://bowtie-bio.sourceforge.net/index.shtml/)
SAMtools (http://samtools.sourceforge.net/)
HISAT2 software (http://ccb.jhu.edu/software/hisat2)
TopHat software (http://tophat.cbcb.umd.edu/)
StringTie software (http://ccb.jhu.edu/software/stringtie)
R 3.5.2 (https://www.r-project.org, version 3.4.2)
Bismark (http://www.bioinformatics.bbsrc.ac.uk/projects/bismark/)
Mouse genomes (ftp://ftp.ncbi.nlm.nih.gov/genomes/M_musculus/)
Quantitative real-time polymerase chain reaction (PCR)
Quantities of target gene mRNA were measured using the SYBR Green Real MasterMix Kit (Tiangen, Beijing, China) and the Mx3005P quantitative PCR system (Stratagene, La Jolla, CA, USA), as described in the manufacturer’s instructions. Real-time PCR results for the marked genes were tested three times, the gapdh gene was used as the internal control.
Results
Differential expression genes
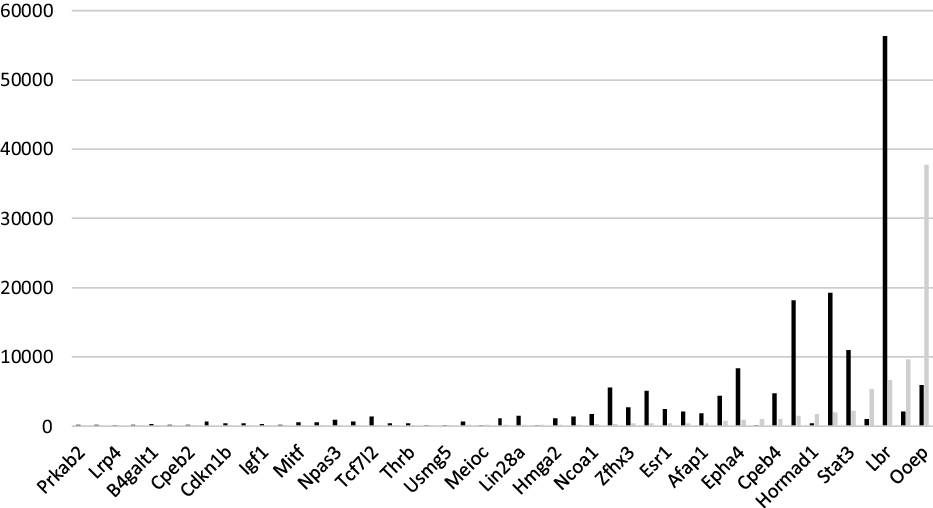
Through analysis of RNA-seq data, more than 1000 differentially expressed genes (P < 0.01) were identified, of which 184 were significantly different genes (log > 2): 166 genes were downregulated and 16 genes were upregulated (Supporting Information Table 1). Expression levels of some genes are shown in Fig. 1.
Differentially expressed genes in oocytes from aged mice, in which black indicates the 8-week-old mice group and grey indicates the aged mice group.

Gene ontology (GO) enrichment and pathway enrichment results
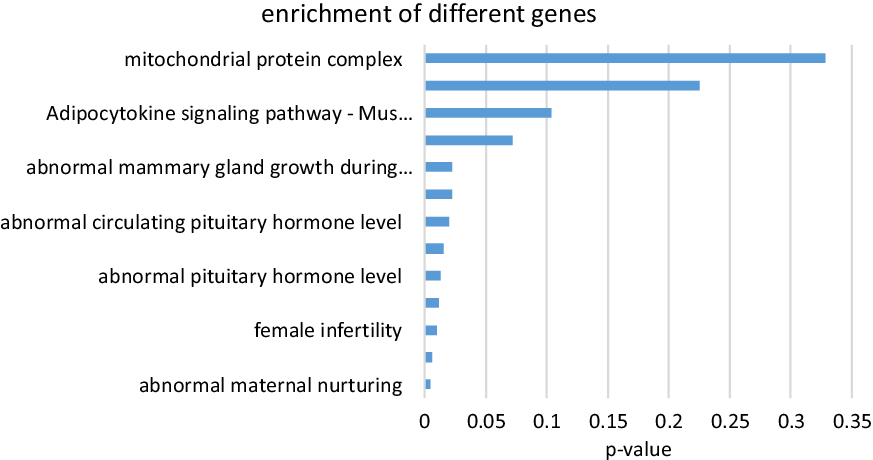
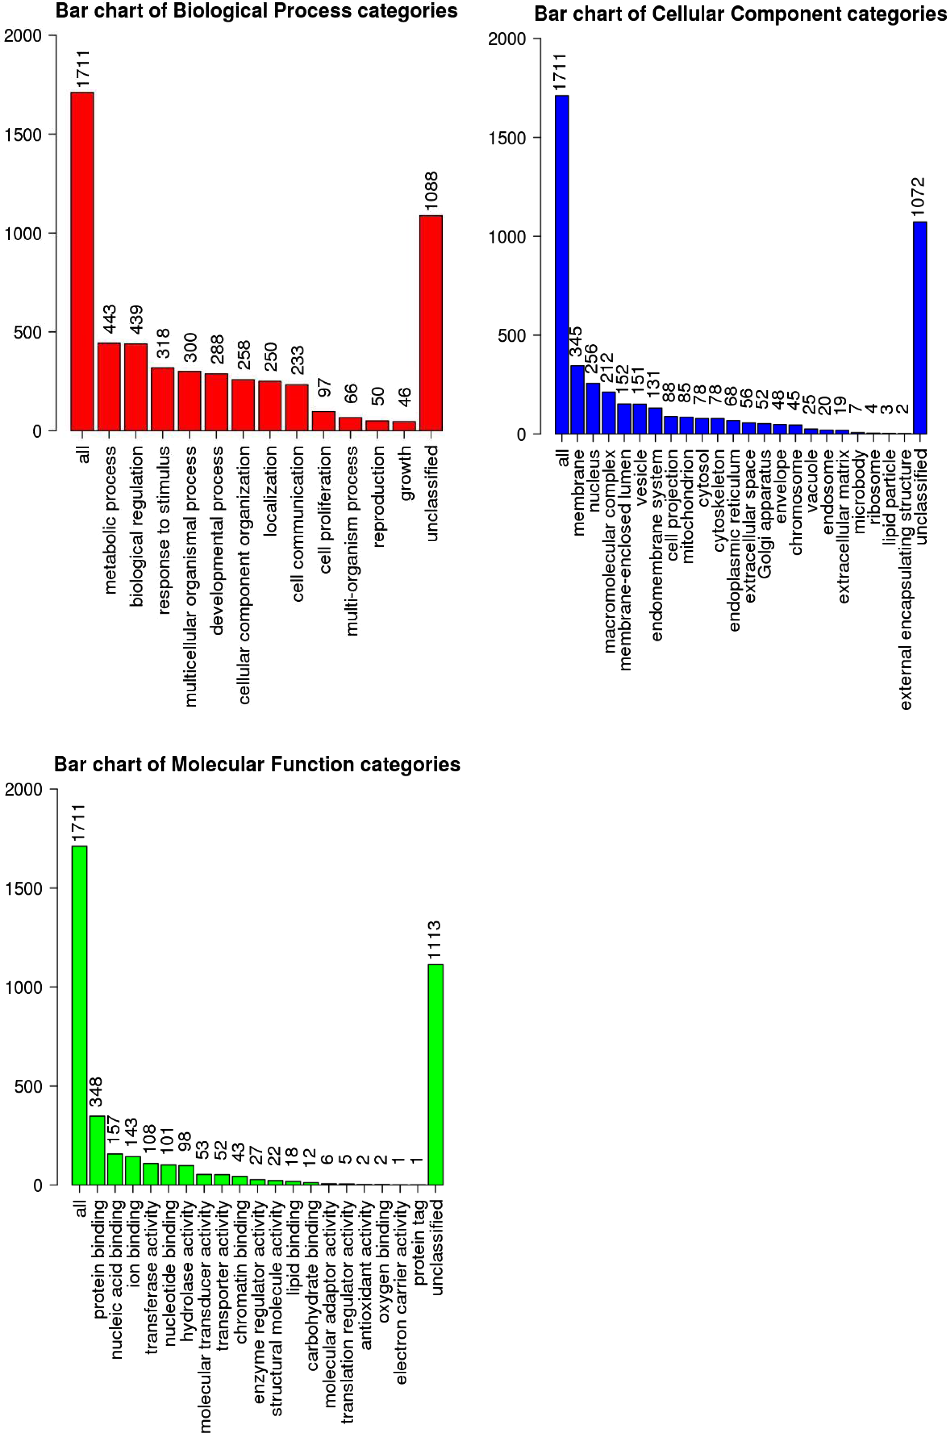
We performed GO enrichment and related pathway enrichment analysis for the differentially expression genes, and found some gene expression changes related to ageing. Genes were located in mitochondria-related, reproductive, and metabolism-related pathways, and related genes were screened. Results of enrichment and screening are shown in Figs 2 and 3.
Gene ontology enrichment of different genes. The horizontal coordinates are P-values, all results were significantly different.

Results of enrichment. All data were analyzed using R programming language. Figures were obtained using WebGestalt (WEB-based Gene Set Analysis Toolkit) software. The figure shows that 50 genes were related to reproduction.

Real-time PCR results
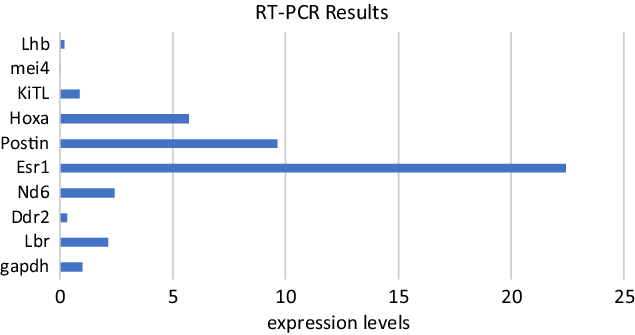
We selected nine differential expression genes for validation by real-time PCR, and used gapdh as an internal reference, expression of each gene was verified three times. Results are shown in Fig. 4.
Verification of differentially expressed genes using real-time PCR. PCR results were consistent with RNA-seq results.

Genome-wide methylation-seq results
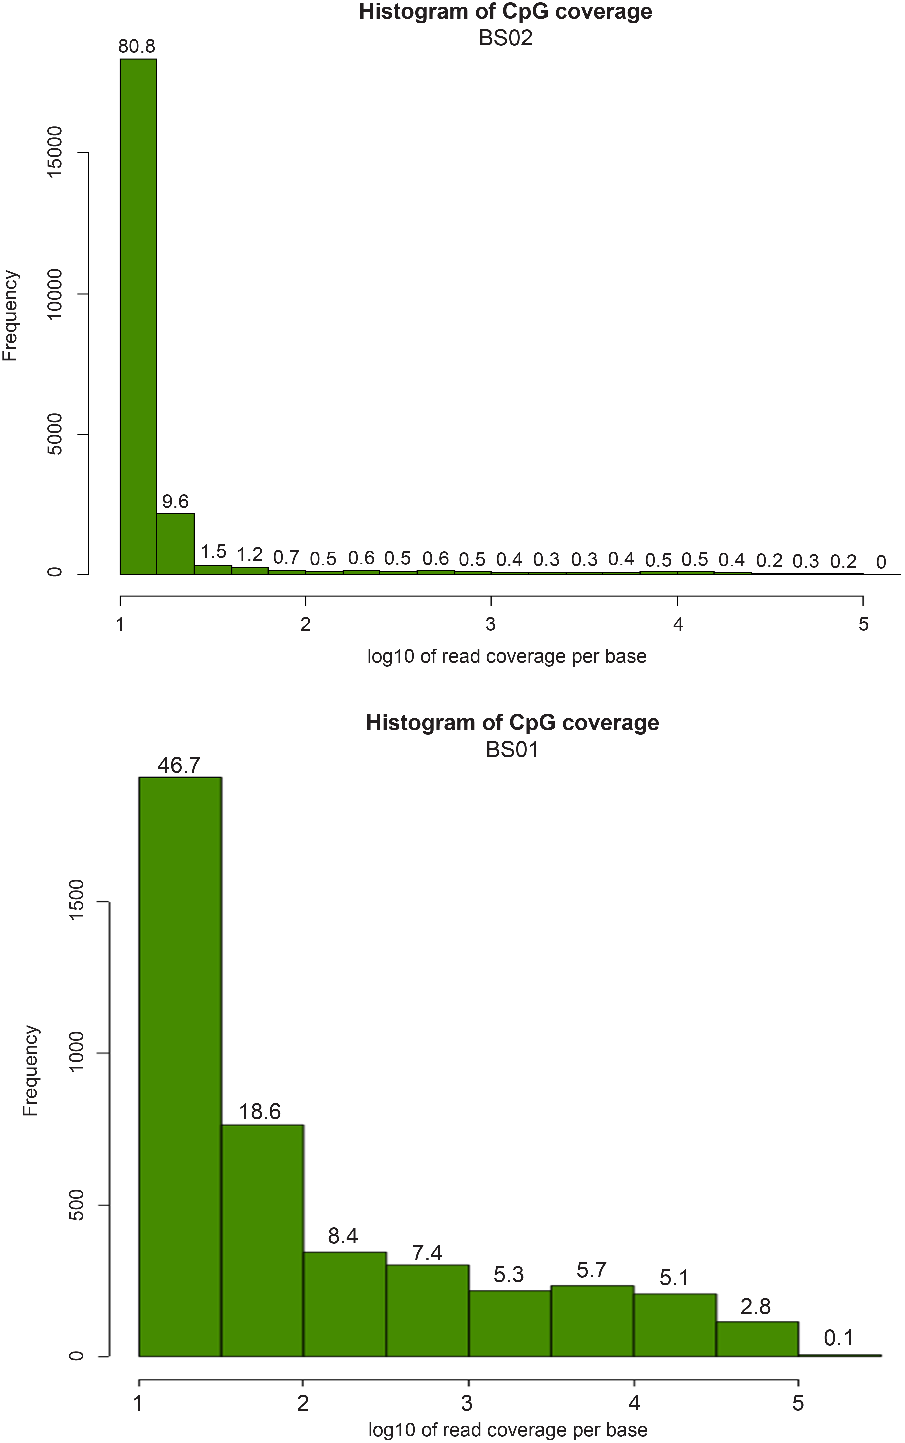
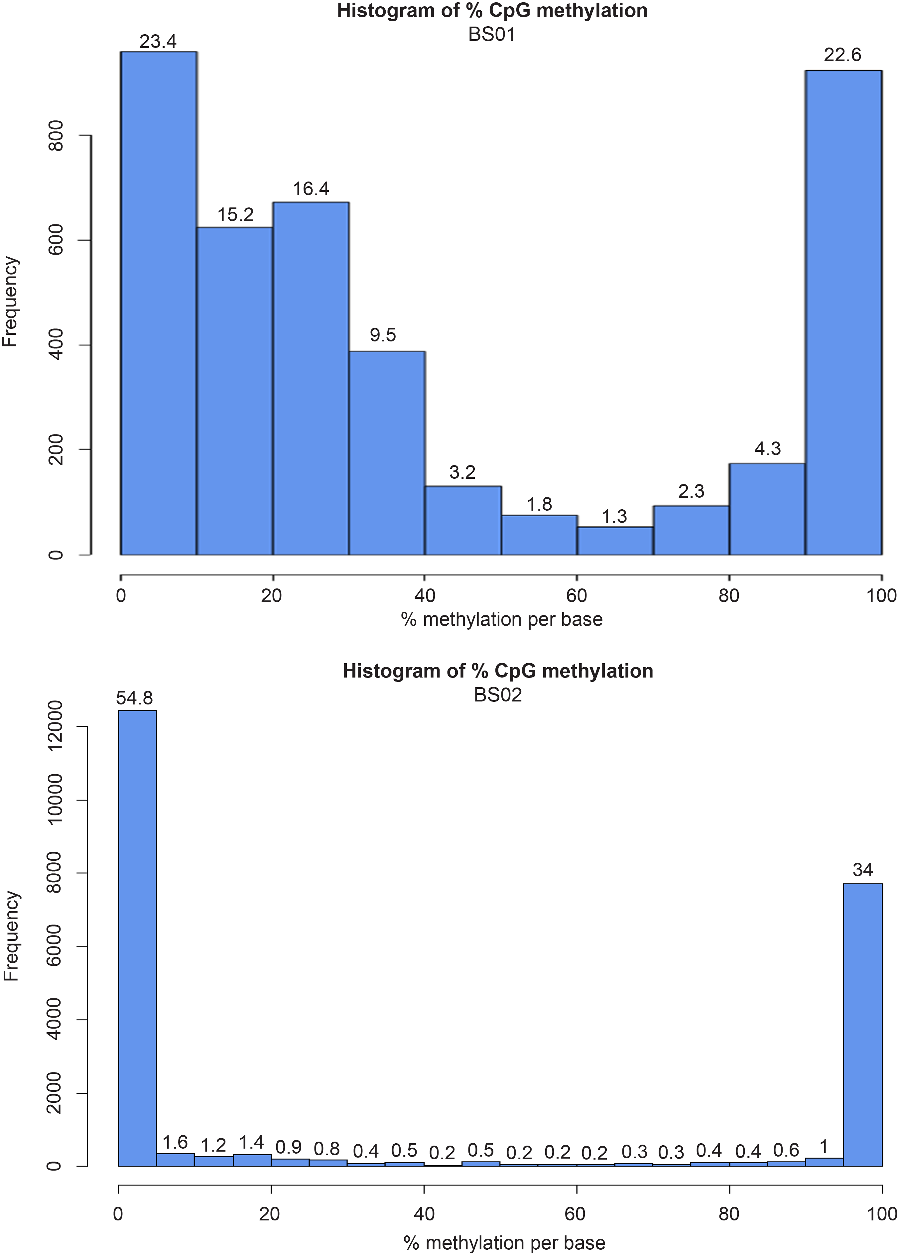
We labelled the methylation group of aged ICR females as BS01 and the methylation group of young ICR females as BS02, then calculated the CpG coverage and methylation coverage of the two sets of data. There were significant differences in CpG coverage and methylation levels between the two groups; results are shown in Figs 5 and 6.
Histogram of CpG coverage of two groups: BS01 indicates the control mice group and BS02 indicates the aged mice group. All data were analyzed using Bismark, SAMtools and R software. The figure show significant differences between two groups.

Histogram of % CpG methylation: BS01 indicates the methylated group of ageing mice, and BS02 indicates the methylated group of the 8-week-old mice. The histograms show that there were marked differences between the two groups.

Correlation analysis
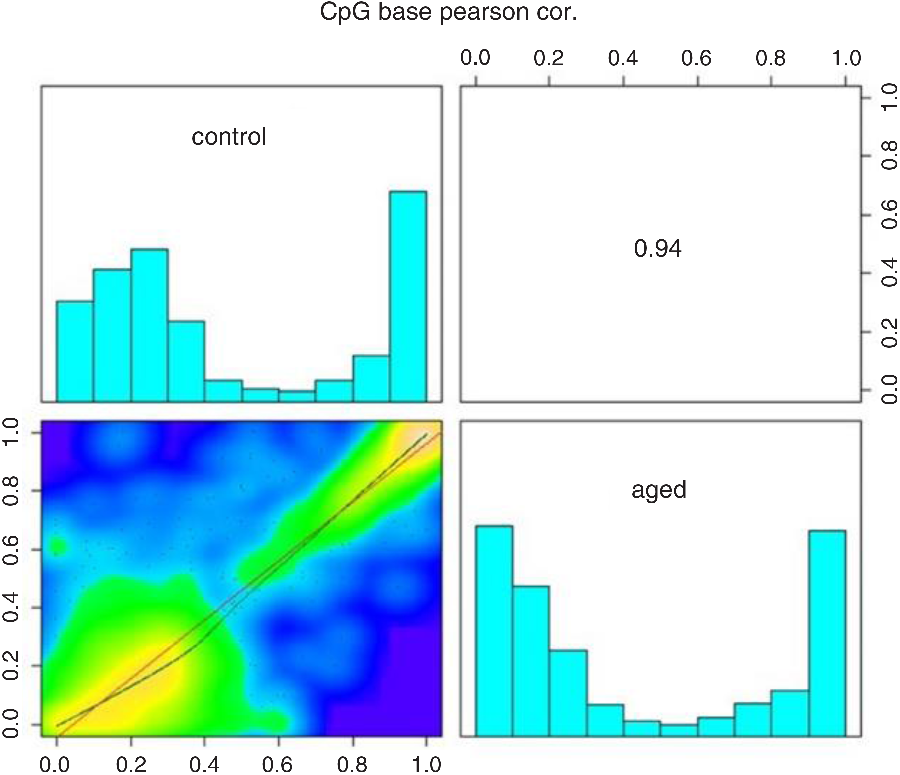
Correlation between the two sets of data was very high, and methylation levels in different regions were changed. This finding also demonstrated that methylation levels had changed significantly in oocytes of aged mice compared with the control young mice. Correlation analysis results are shown in Fig. 7.
Correlation analysis diagram, in which ‘control’ represents 8-week-old ICR mice and ‘aged’ represents aged ICR mice. The plots show that the two groups were highly correlated.

Hypermethylation and hypomethylation levels analysis
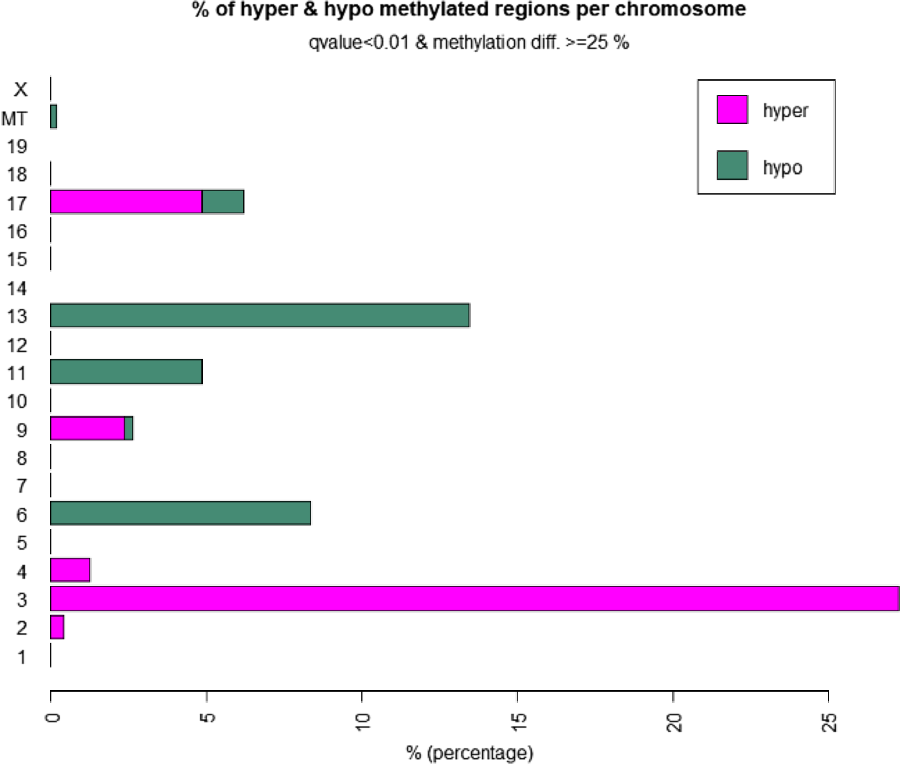
The methylation data from the two groups was analyzed further. There were significant gaps on each chromosome at hypermethylation and hypomethylation levels. These gaps may be the main cause of differences in gene expression between the two groups of mice, as shown in Fig. 8.
Analysis of hypermethylation and hypomethylation levels. The abscissa shows the methylation level and the ordinate shows the chromosome number. Main differences were found on chromosomes 3, 6, 13 and 17.

Discussion
With the continuous advancement and development of society, marriage and child-bearing ages are also rising, this change has led to increases in infertility and fertility risk rate among older mothers. Babies born from older parents are more likely to have various hereditary diseases, and environmental factors have also greatly affected risk during maternal births. Previous studies using aged mice models have focused on the quality of the cardiovascular and cerebral systems, as well as oocyte quality after ovulation, including aneuploidy, sister chromosome association disorder, and mitochondrial activity changes (Babayev and Seli, Reference Babayev and Seli2015; MacLennan et al., Reference MacLennan, Crichton, Playfoot and Adams2015).
Epigenetics also plays a critical role in development and offspring health. It is not known if maternal ageing causes epigenetic defects in germ cells. In the present study, we compared DNA methylation and gene expression changes in oocytes from young mice and aged mice (reared to 18 months, equivalent to human females about the age of 50). Our sequencing results showed that both transcriptome and methytome profiles of aged oocytes exhibited significant changes.
Maternal aged females have some phenotypic reproductive changes, such as ovarian atrophy and sclerosis, and decline in oocyte number and quality. The gene expression profile of oocytes changed after maternal ageing, and the expression of numerous important genes was altered. Notably, expression of genes related to hormone secretion (Il5ra, Samsn1, Pik3ap1, Tnfrsf21), mitochondria-related genes (Ccnb2, Cdc25a, Cdc25c, Igf1) and some reproductive system-related metabolic genes (Ccnd1, Elk1, Nras, Pten, Tcf7l1, Tcf7l2, Gsk3b) were changed to various degrees. These changes affect the growth and maturation of the oocyte, resulting in a marked decrease in the quality of the oocyte, and the number of oocytes that could develop normal function was also significantly increased.
The level of DNA methylation in oocytes has a fixed erasure and re-establishment process; if this process changes, development and maturation of the oocyte will be greatly affected. DNA methylation occurs twice during reprogramming: first in early embryonic development, and second in gamete formation, which occurs in germ cells. Our results of methylation sequencing showed that the level of DNA methylation also significantly changed at the corresponding chromosome level of the above differentially expressed genes. Expression levels of these differentially expressed genes may be regulated by epigenetic modifications; changes in these DNA methylation modifications also directly or indirectly affect the phenotype of maternal ageing. Previous studies have also demonstrated that changes in methylation modification during methylation remodelling will affect oocyte maturation and embryonic development (Seisenberger et al., Reference Seisenberger, Andrews and Krueger2012).
Due to the long period of time taken by natural maternal ageing in mice (18 months in this study), the females lost fertility. It is difficult to verify if epigenetic changes affect embryonic development and pregnancy and if these changes affect progeny behaviour. These changes may affect the function of related organs or the function of cells. Changes in the reproductive system may further affect some of the functions of offspring, for example the occurrence of epigenetic diseases; this needs future clarification. The above conclusions provide preliminary clues for future follow-up research.
Supplementary material
To view supplementary material for this article, please visit https://doi.org/10.1017/S0967199420000143
Data availability statement
The mm9 genome of mouse data is publicly available on the UCSC genome browser (https://genome.ucsc.edu). All R packages are freely available.
Financial Support
This study was supported by a grant from National Natural Science Foundation of China (31871504).
Conflict of Interest
The authors declared that they did not have any commercial or associative interests that represent a conflict of interest in connection with the work submitted.
Ethical Standards
ICR mice care and handling abided by the Animal Research Committee Guidelines of the Institute of Zoology, Chinese Academy of Sciences.