Ever since Charles Beard's An Economic Interpretation of the Constitution was first published in 1913, scholars in history, economics, and political science have debated the motivation of the framers at the Constitutional Convention. Beard argued that “the members of the Philadelphia Convention which drafted the Constitution were, with few exceptions, immediately, directly, and personally interested in, and derived economic advantages from, the establishment of the new system.”Footnote 1 Specifically, he argued that the framers voted around two interests: those who primarily owned “realty” and those who primarily owned “personalty” or securities.
This view dominated historical interpretations of the Constitutional Convention until the mid-twentieth century, when historians Robert Brown and Forrest McDonald wrote detailed critiques of the Beard thesis.Footnote 2 Brown argued that wealthy people were not staunch supporters of the Constitution and that the framers were much more democratic than Beard had portrayed. McDonald went much further. He gathered quantitative measures of the economic interests of the delegates as well as their demographics. He also inferred delegate votes for 16 separate roll calls. This was done by using statements made by the delegates in place of their votes and by inferring the votes of other members of a delegation based on the recorded position of each state. McDonald concluded that “the facts did not substantiate [Beard's] assumptions.”Footnote 3 Although McDonald did not present a statistical analysis of delegate voting, this resolved the issue for many historians.
Beginning with two articles in this Journal, Robert McGuire and Robert Ohsfeldt (hereafter M&O) revitalized the Beard thesis and the question of whether the delegates were motivated by their personal economic interests.Footnote 4 These studies, and several of their others, form the basis for McGuire's recently published book To Form a More Perfect Union. M&O used regression analysis to show the marginal effects of various personal economic interests but they did not claim, as Beard had, that owning real estate or securities fully explained voting patterns. Rather, they showed that personal ideology, constituent ideology, and constituent economic interests were also important.
In other words, the studies of Beard and M&O showed that delegates were not impartial as is often assumed in economic models of constitutional decision-making nor were they the disinterested participants claimed by historians.Footnote 5
Despite the arduous work and reams of regressions produced by McGuire and M&O, potential questions still remain. First, because the votes of individual delegates were not recorded, M&O used the delegate votes inferred by McDonald.Footnote 6 This limited their analysis to the same 16 roll call votes. Second, M&O coded the votes of the remaining delegates that McDonald left uncoded, using a few assumptions of their own. This allowed them to include the same 53 delegates in their regression analyses, whether the delegate was actually present or not. Thus, it is not clear if the analysis actually tests for factors that affected voting behavior, strictly speaking.
We re-examine the effect of these research decisions, and others, by first creating a pooled regression that has the same independent variables as one of the combined regressions reported by M&O in “Constitutional Economics.”Footnote 7 The major difference between their specification and ours is that M&O used the percentage of pro-national votes for each delegate as the dependent variable, which created a single collective observation for each delegate. We analyze the votes in a pooled cross-section. Pooling the votes in this manner leaves enough total observations to consider various subsamples of the data.
The results of our baseline specification match the results in M&O's “Constitutional Economics” very closely. We then consider a number of changes to the sample methods and compare regressions based on these samples to the baseline case. With each modification of the data, we generally find that their original results are strengthened, except for the importance of constituent economic interests. We conclude that proxies for personal economic interests and personal ideology are better predictors of delegate voting behavior than the proxies for constituent economic interests and constituent ideology. This suggests that Beard's view about delegates being guided by their own personal interests may have been even more important than previously claimed, even if it does not strictly match his theory about delegates voting in two economic coalitions.
BACKGROUND
The 55 delegates at the Convention voted in state blocks. The size of each block varied by state depending upon the number of delegates each state assigned to the Convention and the number of delegates attending. This ranged from two delegates for New Hampshire to eight delegates for Pennsylvania. Each state's vote was determined by the vote of a majority of delegates from that state. The Convention journal and Madison's notes recorded the vote of each state, but they did not record the vote of each delegate. Thus in order to distinguish among individual delegates, it is necessary to infer how they might have voted.
M&O analyzed delegate voting based on 16 roll call votes previously inferred by McDonald.Footnote 8 McDonald used attendance records, James Madison's notes, and other sources, to infer the position of delegates in attendance. Given the majority rule requirement for each state, McDonald was often able to infer positions of additional delegates based on the state vote. For example, McDonald notes that Alexander Hamilton of New York probably voted in favor of roll call 34 because it was part of the Hamilton Plan for government and one of Hamilton's co-delegates stated that Hamilton had voted for the same principle just a week earlier.Footnote 9 With this information, McDonald inferred that the two remaining delegates from New York must have voted against the proposal because New York's vote was nay.
Using this method of inferring delegate votes from primary source material and state votes to fill in remaining delegates, McDonald was able to infer between 31 and 40 votes per roll call, capturing almost all of the delegates in attendance for the 16 roll calls. However, he did not infer the votes for the Pennsylvania delegates on any of the roll calls, and he did not infer votes for three of the four delegates from Delaware on roll call 559, the final vote he considered.
McDonald then computed the percentage of times each delegate's inferred vote matched the Pennsylvania state vote, which he claimed was the most nationalistic delegation. Using these data, McDonald handily rejected Beard's notion that delegates aligned themselves into two camps around the securities and real estate they owned. As limited as it was, McDonald's descriptive analysis remained the only quantitative work on delegate voting at the Constitutional Convention for three decades.Footnote 10
Thirty years after McDonald's influential work, M&O recognized the opportunity for a more nuanced approach.Footnote 11 Rather than seeking to determine if voting patterns matched a simple categorization of whether a delegate owned real estate or securities, M&O used regression analysis to investigate whether various factors influenced delegates at the margin. They wanted to consider a variety of factors and variables, but with so few observations for each roll call, M&O chose to supplement McDonald's data by coding the remaining delegates. In other words, they primarily coded delegates from Pennsylvania and those not in attendance.Footnote 12 The additional inferences gave M&O 53 usable observations for each roll call.Footnote 13
For the Pennsylvania delegation, M&O simply assumed that the Pennsylvania delegates were always unanimous. They all represented personalty interests, they were all from the Philadelphia area, and evidence for their disagreement appeared limited.Footnote 14 For the remaining uncoded delegates, M&O imputed positions by assuming: all delegates who signed the Constitution, except three, would have voted with the majority on every issue; the remaining three delegates who signed the Constitution (Bassett, Blount, and Paterson) voted with the minority; and all the other delegates would have voted with or against the majority if Max Farrand stated they favored the Constitution or opposed it, respectively.Footnote 15
Using this expanded set of data, M&O applied logit analysis to each roll call separately.Footnote 16 Even with the expanded sample, the maximum likelihood routine often would not converge due to insufficient variation. As a result, some of the explanatory variables had to be dropped across various vote regressions. In other studies, M&O's unit of analysis was the percentage of times a delegate was coded consistent with a pro-national position.Footnote 17 The pro-national position was defined as giving more power to the national government and less power to the states. Using all the inferences in this context, whether or not the delegate voted on a particular roll call, may have been appropriate because it prevented the possible percentages of pro-national voting from varying by delegate simply due to differences in attendance on different roll calls.Footnote 18
THE BASELINE SPECIFICATION
In order to conduct our analysis we must first present a baseline case. As mentioned, M&O probably inferred positions for nonvoting delegates because the number of voting delegates on each separate roll call was relatively small. Even with the expanded sample, logit regressions often required dropping certain variables because all delegates with a certain characteristic were imputed to have voted the same on a given roll call.Footnote 19 Maximum likelihood procedures will not converge under such circumstances. In trying to replicate their results, we found that none of their specifications would converge if the sample was limited to the delegates McDonald thought were in attendance. This was also true for the parsimonious regressions presented in McGuire's More Perfect Union.
Pooling the roll calls seems like a natural way of increasing the degrees of freedom and introducing more variation into the sample. It might even allow a more complete specification to be utilized. In order to pool, however, the dependent variable must contain a common characteristic.
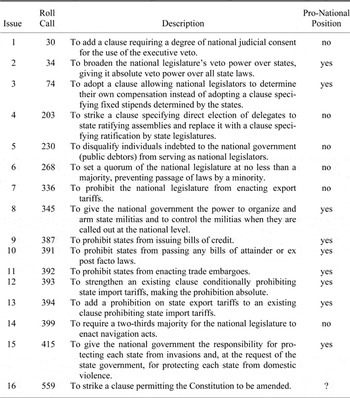
Following M&O and McDonald, we characterize each roll call based on whether passage would strengthen or weaken the national government relative to the state governments.Footnote 20 McDonald assumed that Pennsylvania's vote always reflected the pro-national position, but M&O more reasonably reviewed the roll calls individually to determine the proper pro-national interpretation of each roll call. M&O were able to classify each roll call, except for roll call 559, which does not appear to strengthen or weaken the national government in a discernable manner.Footnote 21 The description of each vote is given in Table 1. We accept M&O's interpretations, and code each delegate with a one if they were inferred to have voted in favor of a pro-national position on that vote, and a zero otherwise. However, we treat the roll calls as a pooled cross-section, rather than aggregating them into the percentage of pro-national votes for each delegate, as done by M&O.
MCDONALD'S 16 ROLL CALLS

Sources:
Adopted from McGuire, More Perfect Union, table 3.2 and table 5.1.
M&O report that McDonald's codes are inconsistent with several state votes on roll calls 30, 74, and 228.Footnote 22 They were able to establish that roll call 228 was actually roll call 230 and based their interpretation on this roll call instead. They could not correct roll calls 30 or 74. In addition, they note that roll call 399 was thought by constitutional historians to have been involved in a vote trade. As a result, M&O do not include roll calls 30, 74, 399, or 559 when calculating the percentage of pro-national votes for each delegate (recall, the last could not be classified as pro-national or pro-state).Footnote 23
For our baseline case, we also drop roll calls 30, 74, and 559. However, we do not drop roll call 399—at least not initially. Inferences on this roll call are very likely to be consistent with how each delegate voted despite the possible vote trade. This is because delegates who were allegedly parties to the vote trade always stated positions consistent with the vote trade they were about to cast or they remained silent. Later, we consider the robustness of the results to dropping this roll call, as well as each of the other roll calls in turn.Footnote 24
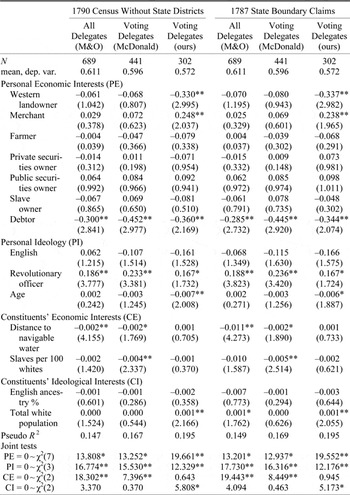
To make our comparisons as direct as possible, the explanatory variables are the same as those used by M&O in their regressions explaining the percentage of pro-national votes for each delegate and subsequently replicated in More Perfect Union.Footnote 25 The variables are presented in Table 2. Following M&O and McGuire, the explanatory variables are grouped into four categories: personal economic interests (PE), personal ideology (PI), constituents' economic interests (CE), and constituents' ideology (CI). All the personal delegate variables are dummies except for delegate age. All the constituent variables are ratios except for distance to navigable water, which is in miles.Footnote 26 For the baseline sample, we use all of the M&O inferences on every roll call except we do not include roll calls 30, 74, and 559. This produces 689 individual observations.Footnote 27
The same set of 53 delegates are included for every roll call, and the values for the explanatory variables for each delegate do not change across roll calls. Thus the only variation in the explanatory variables in our pooled sample is across delegates. Yet the mean value for voting pro-national varies considerably across roll calls, from a low of 0.39 (on roll call 392) to a high of 0.77 (on roll call 387). Thus there must be other factors that vary across roll calls that are not included among the independent variables. To address this concern, we include a set of roll call dummy variables to capture systematic variation across roll calls. The estimated marginal effects of the explanatory variables then represent the marginal impact of that variable on the deviation from the mean underlying tendency for delegates to vote pro-national on that particular issue. Because values for the explanatory variables do not vary across roll calls, we cannot include dummy variables for individual delegates.Footnote 28
The first column of Table 2 presents estimates from logit analysis for the baseline regression. The estimated coefficients are transformed into the marginal probabilities of voting pro-national, computed at the means of the other variables. To conserve space, the individual roll call dummy coefficients are not reported. These pooled results are very similar to those from M&O on the combined percentage of times a delegate was inferred to vote pro-national.Footnote 29 The only variables generating statistically significant coefficients are those indicating whether the delegate was in debt, whether he was an officer in the Revolutionary War, and the distance of the delegate's county from navigable water. The sign and significance of each variable matches those reported by M&O except they also found the percentage of English in the state to be significant at the 10 percent level. Thus the vast increase in degrees of freedom from treating the sample as a pooled cross-section rather than aggregating into a single cross-section does not reduce the estimated standard errors enough to make a statistically insignificant variable for M&O statistically significant here.
MARGINAL PROBABILITIES FOR VOTING PRO-NATIONAL

* significant at p ≤ 0.10.
** significant at p ≤ 0.05.
Notes:
The dependent variable is a binary variable indicating if the delegate's position is pro-national. Regressions include dummies for each of the 13 roll calls included, which are not reported in the table. Estimated marginal effects from logit regressions are calculated at the mean of the other variables. The absolute values of the t-statistics appear in parentheses.
M&O test the relevance of each category by a series of non-nested tests. The more straightforward method is to test the joint significance of the variables in each category, as presented at the bottom of the column. Under this method, we reject the null hypothesis of no relationship for personal economic interests, personal ideology, and constituents' economic interests, but not for constituents' ideology. Again, this matches M&O's findings except for the last. Thus our baseline case corroborates most of their findings and interpretations except we do not support the importance of constituent ideology. Thus whereas M&O stress the importance of each category in influencing delegate behavior at the margin, we might be inclined to place delegates' personal characteristics above that of their constituencies on the whole. We might also place the importance of economic interests above that of ideology. In other words, delegates may have been even more narrowly self-interested than M&O suggest.
However, such a conclusion may be premature. As also found by M&O, the significance of each category is driven by the significance of one single variable. Consider for example the personal economic interests category. Out of seven variables total, only the debtor dummy is significant. Dropping the debtor variable does not make any of the other variables individually or jointly significant. Thus, the significance of PE under the joint test rests solely on the inclusion of the debtor variable. This is troubling because only three of the 53 delegates are classified as debtors. The debtor variable captures any characteristic that these three individuals might have in common that differs from those of the other delegates. With so few individuals in this group, the list of potential factors they have in common could be quite large and might have nothing to do with the delegate's debt.
We are therefore more cautious in attaching importance to any category when its significance is driven exclusively by one variable. The same is true of the PI and CE categories and, regarding M&O's results, the CI category as well. Initially, our own conclusions regarding the influence of any of these categories is more tenuous than that of M&O.
CONSTRUCTION OF THE DATA AND SAMPLE CHOICE
We now turn to issues related to the construction of the data set. In this section, we first consider different methods of inferring votes. We then consider the effect of this particular sample of roll calls by repeatedly sampling 12 of the 13 roll calls with replacement.
Reducing the Sample to Voters Only
The first issue involves the use of nonattending delegates and the method of inferring votes for members of the Pennsylvania delegation. M&O inferred 144 yea or nay votes on the 13 roll calls for delegates that McDonald believed were absent.Footnote 30 This represents roughly 20 percent of their sample.Footnote 31 Thus, it is not clear if the regressions produced from these data accurately reflect marginal impacts on voting behavior per se. Furthermore, M&O assumed that the Pennsylvania delegates always voted the same as each other. This assumption could lead to an estimation bias in favor of characteristics the Pennsylvania delegates had in common and against characteristics on which they differed. The variable values common to all the Pennsylvania delegates include not only constituency variables (all of them) but also some personal variables (specifically the variables indicating if a delegate was a farmer, slave owner, or debtor). This suggests there could be a bias in favor of statistical significance for each of the constituency variables and a few of the personal variables, and a bias against the remainder of the personal variables. The Pennsylvania delegation was the largest and comprised 15 percent of the sample. Hence, the decision to code the Pennsylvania delegation unanimously may have had a noticeable effect on the results.
To address these concerns, in this section, we limit the sample to the delegates coded by McDonald. These data do not include delegates that McDonald believed were not in attendance nor votes for any of the Pennsylvania delegates. Removing the nonattending delegates should make the interpretation of the parameters clearer. Instead of describing how delegates might have voted if they were present, the regressions now strictly represent effects on the inferred votes of those who actually attended.
With pooled roll calls there are enough total observations to analyze the smaller sample. This was not the case when each roll call was examined in a separate regression.Footnote 32 Recall that McDonald inferred votes for every delegate he believed was in attendance (except for the Pennsylvania delegates) and only for those delegates believed to be in attendance. This smaller sample includes 441 usable observations on the 13 roll calls.
Estimates from this reduced sample are reported in the second column of Table 2. The results are similar to those in the first column, except for the number of slaves in a delegate's home state, which is now significant. The other measure of constituents' economic interests, distance to navigable water, weakens in its significance but is still considered statistically significant at the 10 percent level. Both variables in this category are now individually significant, perhaps strengthening the overall importance of constituent economic interests on delegate voting. The overall significance of the other variables and all the joint tests, remain the same. Our conclusions, therefore, are not greatly affected by limiting the sample to delegates in attendance. We might, however, now have more confidence in stressing the importance of constituents' economic interests, because both variables in this category are statistically significant.
By not including the extended sample based on M&O's imputed votes, we have removed one potential cause for concern. However, as explained below, we believe a bias favoring state level variables and opposing personal variables may remain inherent in McDonald's data as well. Our next exercise is to check the validity of McDonald's inferences by returning to primary source material. This produces important changes to the regression estimates.
Revising Inferences for Voting Delegates
As noted, M&O found several inconsistencies between McDonald's inferred votes and the recorded state vote on three separate roll calls. Given this, we now re-examine primary source material to check McDonald's inferences as well. Our data-gathering techniques match those of McDonald, but we have the benefit of materials published more recently as well as electronic search mechanisms.Footnote 33 Unlike McDonald, we were able to infer votes for some members of the Pennsylvania delegation. These inferences suggest that the Pennsylvania delegation was not always unanimous as M&O assumed. Nevertheless, we were not able to infer as many total observations as McDonald.
Of the delegates both we and McDonald thought were in attendance for the 13 roll calls, McDonald inferred 156 observations that we could not infer (roughly 58 percent more than us). Because we devoted over 200 hours to the search and had significantly more sources available, it is not clear how McDonald was able to infer so many more observations than we did.Footnote 34 One possibility is that, unless presented with directly conflicting evidence, McDonald simply assumed each delegate voted the same as the vote recorded for their state. This is supported by two observations. First, among the 156 observations that McDonald coded that we could not, he inferred a delegate vote that differed from the recorded state vote only four times. Second, McDonald inferred votes for all delegates in attendance except the delegates from Pennsylvania and three delegates from Delaware on roll call 559. Delaware was recorded as divided on roll call 559 but in every other vote in which Delaware was not divided, these same three delegates were always assigned the same code as the vote recorded for their state. It seems highly unlikely that he inferred votes from primary source material for all the other delegates in attendance on every other roll call in the sample. If our hunch is correct, and McDonald coded delegate votes based on the vote of their state unless he found information to the contrary, then this practice could bias regressions in favor of the importance of those constituency variables that vary only by state, and against personal variables, which could vary within a delegation.
We were able to infer votes for 331 of the observations McDonald coded on all 16 roll calls, including 267 of the 441 observations McDonald coded on the 13 roll calls analyzed here. We also inferred votes for additional delegates McDonald did not code, including some of the Pennsylvania delegates on various roll calls, and other delegates that McDonald had marked as not present but for whom we found evidence suggesting they had attended. In total, we inferred 370 delegate votes, including 302 of which apply to the 13 roll calls. McDonald, however, also inferred votes in which Farrand's attendance records, and other sources, indicated the delegate was absent. Our voting inferences agree with McDonald on 88 percent of the overlapping delegates for which we both code yea, nay, or absent on the 13 roll calls. However, the remaining differences and missing observations may be important.
Estimates using our inferred votes on the 13 roll calls appear in the third column of Table 2. These results differ substantially from the previous set of estimates. First, among the personal economic interests variables, we find western landowners and merchants were significantly different at the margin from those who did not own western land or were not merchants. The debtor variable remains significant as before. The joint test on the variables in the personal economic interests category is now significant at a higher level of confidence than previous cases in which other sets of inferred votes were used.
For the personal ideology variables, we now find that older delegates are significantly less pro-nationalistic at the margin. The revolutionary officer variable remains statistically significant, though to a lesser degree. The joint test for personal ideology is still significant at the 5 percent level.
None of the constituent economic interests variables are statistically significant, either individually or jointly. In contrast, total white population, a proxy for the ideology of constituents, is now significant and the joint test for this category is also significant, but only at the 10 percent level.
Thus our conclusion from using our own set of inferences is that personal economic interests and personal ideology play significant roles in affecting delegate voting at the margin. The evidence in favor of constituent ideology is stronger than before (although still weak), but we find no support for delegates being significantly influenced at the margin by their constituents' economic interests. In other words, these data more strongly support M&O's new economic interpretation of the Constitution, at least in terms of the importance of personal delegate interests, than their own data.
The conclusions based on our inferences rather than McDonald's show more support for personal variables and less support for constituency variables overall. Although our codes overlap with McDonald's on almost 90 percent of the delegate votes that he and we were both able to infer, it is possible the differences in the regression estimates may be due strictly to differences in these codes. It is more likely, however, that the regression differences are due to our choice to leave uncoded delegate votes blank, rather than adopt what we believe to be McDonald's procedure of filling them in based on the recorded state vote.Footnote 35
Roll-Call Sample Choice
McDonald investigated 16 separate roll call votes, but M&O included only 12 of these in their aggregated regressions.Footnote 36 We included the same set of 12 plus one additional roll call, vote 399, in this study. Roll call 559 was dropped because there is no clear interpretation about how its passage would impact the strength of the national government vis-à-vis the states. Roll calls 30 and 74 were dropped because McDonald's inferences for several delegates were inconsistent with the recorded state votes, thus he probably analyzed different roll calls but reported these numbers by mistake. The same was true for the fifth roll call which McDonald misidentified as 228, but M&O were able to ascertain the correct roll call as 230. Had they not figured this out, inferences on that roll call also would have had to have been dropped. Finally, M&O decided to drop roll call 399 because of allegations of a vote trade, whereas we did not.
Thus the choice of roll calls is driven by a variety of factors. First, M&O's potential sample was driven by McDonald's selection of these particular 16 roll calls out of 569 numbered roll calls at the convention. Second, M&O were able to identify correctly one of the roll call numbers McDonald had in error but were unable to do so for two other roll calls that apparently were also in error. Finally, M&O decided to drop roll call 339 out of concern that it involved a potential vote trade. All except the last involve a certain degree of arbitrariness, and we believe it is not necessary to drop roll call 399. Therefore, the actual sample of roll calls could have differed greatly from the set that has been studied.
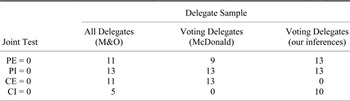
To check the robustness of our results, we re-estimate each regression, while dropping one of the 13 roll call votes one at a time. The results of the joint tests for each category are summarized in Table 3. Only the personal ideology variables are statistically significant (at the 10 percent level) in every iteration, regardless of whether M&O's, McDonald's, or our vote inferences are used. Hence, we can reaffirm the importance of this category in affecting delegate behavior. The other interesting difference between our inferences and McDonald's inferences concerns constituent interests. Different samples of the roll calls using McDonald's inferences show that constituents' economic interests are always jointly significant and constituent ideology is never significant. Our inferences produce virtually the opposite result. This is true with the full sample of 13 roll calls presented in Table 2 or with alternative samples of the 13 roll calls presented in Table 3. Thus, conclusions regarding the importance of constituent economic interests depend on whether McDonald's inferences or our inferences are used. Conclusions based on M&O's inferences (which again represents a supplement of McDonald's inferences) are the most fragile to the sample of roll call votes considered.
ROLL CALL SAMPLES AND THE JOINT SIGNIFICANCE OF EACH CATEGORY

Note:
Figures denote the number of times the joint test is statistically significant at 10 percent or better when one of the roll calls is dropped from the regression, one roll call at a time.
CONSTRUCTION OF THE CONSTITUENCY VARIABLES
Among the constituency variables, only distance to navigable water, calculated from the delegate's county, is delegate-specific.Footnote 37 The other variables, slaves per 100 whites, percent English ancestry, and total white population, are measured at the state level. To create these variables, M&O used the states listed in the 1790 census. However, state boundaries included several districts at the time that were enumerated separately in the census. In 1787, the year of the convention, Maine was a district of Massachusetts, Kentucky was part of Virginia, the Southwest Territory (later to become Tennessee) was claimed by North Carolina, and both New York and New Hampshire claimed what would become the state of Vermont.
The question is whether the delegates thought they represented people living within official state boundaries or some greater or smaller territory. To the extent they could foresee future state boundaries, using states without the separately enumerated districts would be appropriate. However, if delegates considered inhabitants in the areas claimed by their state to be part of their constituency as well, then it would make sense to include state districts where appropriate. Without knowing the delegates' positions, it is not clear which is the best way to proceed. But there is reason to believe the states took their additional land claims seriously and expected them to last. For example, in 1784 several counties in North Carolina seceded from the rest of the state and petitioned for admittance to the United States as the independent state of Franklin. The new state did not receive enough votes from the other states for admittance. Hence, Franklin was not officially part of the state of North Carolina, nor part of the new republic at the time of the Constitutional Convention. But the following year in 1788, the North Carolina militia entered Franklin and arrested its governor and forced him to swear allegiance to the state of North Carolina. Once the land was firmly back under control of North Carolina, the former governor of Franklin was elected to represent the area in the state legislature. By the time of the census in 1790, North Carolina ceded all claims on these lands to the federal government, which became the Southwest Territory. During the census, the population of the Southwest Territory was listed separately from the rest of North Carolina as the state of Tennessee. Thus the relevant population for determining the constituency of the state of North Carolina at the time of the convention is unclear. Similar issues arise for whether or not to include Maine as part of Massachusetts, Kentucky with Virginia, and Vermont with New York or New Hampshire.
Our final alteration to the data is to recalculate variables based on boundaries that include these districts. For slaves, English heritage, and white population, we add the census values for Maine to those of Massachusetts, Kentucky to Virginia, and Tennessee to North Carolina. However, we keep Vermont distinct. Despite New Hampshire and New York failing to recognize its sovereignty, Vermont acted independently as far back as 1777. It elected its own governor, issued its own currency, and even exchanged ambassadors with several nations, including the United States. Our choice of which states to combine is merely an exercise in considering how important these decisions might be to interpreting the regression analysis. We do not necessarily endorse it as the “correct” data construction. Reasonable arguments could be made to consider fewer, or more, combinations of states and districts.
Because the slaves and English variables are ratios relative to the white population, adding state districts has very little impact. However, the total white population of the combined areas differs from the original values quite a bit. Virginia, which was already the most populous state at the time, becomes even larger. Massachusetts, with the inclusion of Maine, replaces Pennsylvania as the second largest state. North Carolina is much larger than New York with Tennessee included but much smaller than New York without it.
The final three columns of Table 2 present the new logit estimates for M&O's data, McDonald's data, and our data, using the alternative state boundaries. The results suggest that the same general patterns emerge. The only discernable difference is that the white population variable is now borderline significant when using all the delegates under the M&O data whereas originally it was not significant. In total, using the demographics as best reflected in 1787, rather than the state names appearing in the 1790 census, generates at least one variable as statistically significant in each category under the M&O method. However, the small magnitude of the white-population effect, coupled with the complete lack of significance of the English variable, still results in insignificant results for the joint effect of the constituent-ideology category. All other joint tests, for each method, remain the same. Thus we conclude that the choice of how to treat the state populations in 1787 does not have a strong effect on the results—at least not for the sample and specification examined here.
CONCLUSION
Several studies have used state votes from the Constitutional Convention to analyze the structure of coalitions.Footnote 38 We have good reason to believe that there was sizable disagreement among delegates from the same state, which suggests that such an approach may be misleading. Analyzing state-level data assumes away differences within delegations and inherently biases regressions in favor of state-level variables. It may also bias the data against delegate interests.
Examining delegate votes is preferred, but few delegate-level votes have been recorded. In this article, we re-examine 16 roll call votes that have been used to study the behavior of delegates at the Constitutional Convention. The popularity of these data has shaped our understanding of the motivation of the framers more than any other data set. However, just as there are good reasons to be concerned with biases toward state-level effects in studying blocks of delegates, there may be concerns about biases in the delegate data in this data set. Methodological choices in the inferences of delegate votes may have biased the data against delegate interests and in favor of constituency interests.
We considered several different methods of inferring votes. For each of these adjustments we believe the potential bias in favor of state/constituency effects, and away from personal effects, was reduced. As a result of our modifications, we found that both personal economic interests and personal ideology increased in importance. In other words, our re-examination of the data serves only to strengthen a modern interpretation of the Beard thesis, which claims that delegate voting behavior was affected by personal interests at the margin.
Future research could investigate the robustness of the results to alternative specifications or classifications of delegate characteristics. It might also look at a wider set of issues across a larger number of roll calls. Moving in this direction should help us understand the motivation of the framers more broadly and why the Constitution contains provisions for some economic interests, but not others.