Introduction
Developing countries in tropical regions face considerable losses in their agricultural economy because the unmarked seasonality of their climate allows pests to thrive and propagate more easily than in temperate countries (Nyssen et al., Reference Nyssen, Poesen and Deckers2009). Mountainous tropical regions show high environmental heterogeneity that promotes niche partitioning and increases the higher risk of invasion by successively introduced pest species (Duyck et al., Reference Duyck, David and Quilici2006; Geurts et al., Reference Geurts, Mwatawala and De Meyer2012). Most studies of temperature-dependent process rates in insect pests have concerned temperate regions (Gilbert et al., Reference Gilbert, Powell, Logan and Bentz2004; Hodkinson, Reference Hodkinson2005; Logan et al., Reference Logan, Régnière, Gray and Munson2007). Tropical regions have received little attention although they represent important places for agriculture development (Nyssen et al., Reference Nyssen, Poesen and Deckers2009; Young, Reference Young2009). There is thus an urgent need for accurate and efficient risk assessment tools that will allow governments to focus their management efforts on the most vulnerable sites (Perez et al., Reference Perez, Nicklin, Dangles, Vanek, Sherwood, Halloy, Martinez, Garret and Forbes2010).
A species' fitness in a particular ecosystem depends on its responses to environmental conditions. Survival probability is an important component of fitness that reflects the level of tolerance of organisms to the environment (Gilchrist, Reference Gilchrist1995). Survival of ectotherms, such as insects, is mainly influenced by temperature and occurs within a definite temperature range, with an optimum between high and low lethal temperatures (Angilletta, Reference Angilletta2009). Temperature-related survival is commonly modeled with tolerance curves, which are useful within insect pest management programs as they allow the identification of vulnerable sites when coupled to temperature regimes that occur in a particular landscape (Logan et al., Reference Logan, Régnière, Gray and Munson2007). The objective of this study was to compare the performance of three models to simulate the temperature-related survival of the immature stages of three species of invasive potato tuber moth (PTM), Phthorimaea operculella (Zeller), Symmetrischema tangolias (Gyen), and Tecia solanivora (Povolny), when parameterized with a limited number of data. Unlike many temperate regions where studies benefit from increasingly abundant experimental and observational data (Luo et al., Reference Luo, Ogle, Tucker, Fei, Gao, LaDeau, Clark and Schimel2011 and other publications from the same issue), the tropical Andes lack sufficient data on many pest species threatening their agricultural landscapes. Data on extremely lethal temperatures are often absent, which is frequently a drawback for accurate modeling of species survival rates (Niño, Reference Niño2004; Sporleder et al., Reference Sporleder, Kroschel, Quispe and Lagnaoui2004; Jaramillo et al., Reference Jaramillo, Chabi-Olaye, Kamonjo, Jaramillo, Vega, Poehling and Borgemeister2009). We were particularly interested in evaluating the ability of the models to predict the deleterious effect of temperature even when fitted to datasets that do not include data on lethal temperatures.
Study system
Within the last 30 years P. operculella, S. tangolias, and T. solanivora have been invading the potato fields of the Northern Andes and represent today one of the most serious agricultural pest problems in the region (Dangles et al., Reference Dangles, Carpio, Villares, Yumisaca, Liger, Rebaudo and Silvain2010). These three species seem to differ in their physiological responses to temperature (Dangles et al., Reference Dangles, Carpio, Barragan, Zeddam and Silvain2008), which play an essential role in defining their geographic distribution along the environmentally heterogeneous Northern Andean landscapes. They have been observed co-occurring in some places of Colombia and Ecuador, even within the same potato storage structure or sack (Dangles et al., Reference Dangles, Carpio, Barragan, Zeddam and Silvain2008). The degree of damage to field or stored potato depends on which species are present and on the sequence of invasion. Since they have proven to respond differently to control strategies (Sporleder et al., Reference Sporleder, Kroschel, Huber and Lagnaoui2005; Rebaudo et al., Reference Rebaudo, Dangles, Lery, Lopez-Ferber and Zeddam2006) their co-existence may complicate the establishment and success of control tactics. Integrated pest management of these pests will therefore greatly benefit from a thorough understanding of their thermal niches.
Materials and methods
The models
The first model we tested was Sharpe & DeMichele's model (Sharpe & DeMichele, Reference Sharpe and DeMichele1977, modified by Schoolfield et al., Reference Schoolfield, Sharpe and Magnuson1981) originally developed to describe poikilotherm development rate. Although widely used to model ectotherm development, for example, that of the PTM P. operculella (Sporleder et al., Reference Sporleder, Kroschel, Quispe and Lagnaoui2004), its numerous parameters may be difficult to estimate from a small number of data points covering a narrow range of temperatures. The second model we evaluated was a second-order polynomial function used by Sporleder et al. (Reference Sporleder, Kroschel, Quispe and Lagnaoui2004) to describe the mortality rate of P. operculella. Even though these authors managed to fit it fairly well to their data, this model may fail to produce the unimodal shape typical of survival curves. Finally, we tested a model developed by Régnière et al. (Reference Régnière, Powell, Bentz and Nealis2012). This model takes into account the simultaneous effects of temperature on survival rate and development time that determine the overall survival relationship to temperature.
Data compilation
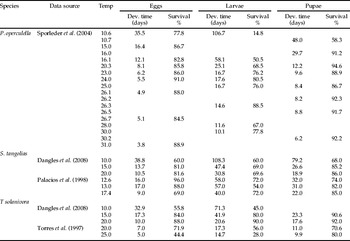
To study the influence of temperature on survival of the immature stages (egg, larva, and pupa) of the three species of PTM we collated published data of laboratory experiments performed in the Andean region (table 1). From these sources, only data acquired under constant temperatures (±2 °C) were considered. In all studies, relative humidity ranged from 60 to 90%.
Survival and development time data at several constant temperatures for immature stages of the three species of PTM obtained from several published sources.

Modeling survival
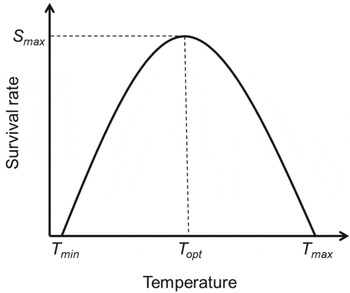
Temperature-related survival of ectotherms has been shown to have a parabolic shape, with low survival at low and high temperatures (fig. 1) (van der Have, Reference van der Have2002). In this study, we assess the performance and robustness of three different models for simulating this type of response in PTM.
General shape of the relationship between survival rate and temperature, with an optimum temperature, T opt, where survival rate is maximized (S max), and a minimum and a maximum temperature (T min and T max) at which survival rate is zero.

Sharpe and DeMichele's model
This model was developed by Sharpe & DeMichele (Reference Sharpe and DeMichele1977) to describe the kinetics of insect development based on several assumptions about the underlying developmental control enzymes. It has been widely used to describe poikilotherms' temperature-dependent development (Gilbert et al., Reference Gilbert, Powell, Logan and Bentz2004). We decided to include Sharpe and DeMichele's model (as modified by Schoolfield et al., Reference Schoolfield, Sharpe and Magnuson1981) in our study because of its biological significance and because it has been successfully used to simulate tuber moth development and survival in other studies (Roux, Reference Roux1993; Sporleder et al., Reference Sporleder, Kroschel, Quispe and Lagnaoui2004). The equation of survival is:
 $$s\left( T \right) = \displaystyle{{\displaystyle{{{\rm d}T} \over {298.16}}\exp \left[ {\displaystyle{e \over R}\left( {\displaystyle{1 \over {298.16}} - \displaystyle{1 \over T}} \right)} \right]} \over {1 + \exp \left[ {\displaystyle{\,f \over R}\left( {\displaystyle{1 \over g} - \displaystyle{1 \over T}} \right)} \right] + \exp \left[ {\displaystyle{h \over R}\left( {\displaystyle{1 \over i} - \displaystyle{1 \over T}} \right)} \right]}}$$
with T mean temperature expressed in K, R the universal gas constant (1.987 cal.K−1.mol−1), and d, e, f, g, h, and i parameters to be estimated (see the ‘Model parameterization’ section below).
Sporleder's polynomial model
Sporleder et al. (Reference Sporleder, Kroschel, Quispe and Lagnaoui2004) described the relation between mortality rate M(T) and temperature for different life stages of P. operculella with a second-order polynomial function of the form:
 $$M\left( T \right) = m_{\rm 1} T^{\rm 2} + m_{\rm 2} T + x,$$
where m 1, m 2, and x are parameters to be estimated. While second degree polynomials are appropriate to describe a parabolic relationship they usually provide a poor extrapolation beyond the range of observations. Nevertheless, we decided to test this rather simple model on survival data of the three species of PTM because it had already been used to simulate mortality of one of the species of PTM (Sporleder et al., Reference Sporleder, Kroschel, Quispe and Lagnaoui2004). To model the survival data, we expressed survival rate as the inverse of mortality rate:
 $$s\left( T \right) = {\rm 1} - M\left( T \right).$$
Régnière's model
Régnière et al. (Reference Régnière, Powell, Bentz and Nealis2012) assume that the survival rate s(T) at a given temperature T is constant throughout a life stage, and that the overall probability of survival during the life stage is simply a matter of exposure duration
 ${\overline t_T}$
(the average stage duration at temperature T) to that temperature-dependent survival rate. Here, a second-degree polynomial logistic model was used to describe s(T), the relationship between survival rate and temperature, yielding:
 $$s\left( T \right) = \left( {\displaystyle{1 \over {1 + {\rm e}^{a + bT + cT^2}}}} \right)^{\overline t _T} $$
with a, b, and c parameters to be estimated. To obtain a continuous description of the relationship between temperature and stage-specific survival, it is necessary to replace
$\overline t_T $
in equation (4) by the development-time response function τ(T) to temperature of each life stage and species. For this, we fitted the Sharpe–Schoolfield model (Schoolfield et al., Reference Schoolfield, Sharpe and Magnuson1981) to mean development time data, by the maximum likelihood method of Régnière et al. (Reference Régnière, Powell, Bentz and Nealis2012).
Model parameterization
Parameters of the three models were estimated using log-likelihood assuming that the number of survivors out of the initial number in each treatment is binomially distributed, with s(T) representing survival probability. Some of the datasets of S. tangolias were incomplete and lacked information about sample sizes. In those cases, in order to parameterize our models, we assumed an arbitrary number of 100 individuals. Parameters of the development-time response function, τ(T), of the three life stages of the three species are given in Appendix 1 in Supplementary material.
Model evaluation
We used the Bayesian Information Criterion (BIC) (Schwarz, Reference Schwarz1978) to compare the performance of the three models within each immature stage of each species:
 $${\rm BIC} = \left( {-{\rm 2} ^*{\rm} LL} \right) + \left( {k^*{\rm Ln}\left( n \right)} \right),$$
where LL is log-likelihood of the model, k is the number of parameters in the model, and n is sample size (i.e. number of data points). BIC allows classifying models according to their performance, the model showing the smallest value of BIC being the best. We also computed posterior model probability (Raftery, Reference Raftery1995; Burnham & Anderson, Reference Burnham and Anderson2004), which is the probability of the model being correct for the data:
 $$p_i = \Pr \left\{ {g_i \left| {{\rm data}} \right.} \right\} = \displaystyle{{\exp \left( { - {\textstyle{1 \over 2}} \, \rm\Delta \,{\rm BIC}_i} \right)} \over {\sum\nolimits_{r = 1}^R {\exp \left( { - {\textstyle{1 \over 2}} \, \rm\Delta \,{\rm BIC}_r} \right)}}}, $$
where g i is the model, ΔBIC i is the difference between the BIC of model g i and the minimum BIC value among the set of models, and R represents the set of models. We follow the rule of thumb proposed by Raftery (Reference Raftery1995, Table 6) to interpret posterior probabilities. According to this author, the evidence for supporting model g i over the others is weak if posterior probabilities are smaller than 0.75, positive if they lie between 0.75 and 0.95, strong if they lie between 0.95 and 0.99, and very strong if they are larger than 0.99.
In addition, we assessed the models’ robustness by evaluating their ability to predict the actual altitudinal limits of the species. While we are aware that species may not be at equilibrium with the environment and have probably not yet filled their potential range, the current altitudinal limits of the species are probably close to equilibrium with climate and might be explained by survival probability because of major thermal-related physiological constraints (Dangles et al., Reference Dangles, Carpio, Barragan, Zeddam and Silvain2008). We calculated with the three models the probability of survival of each species in 50 field sites where moth abundance has been regularly monitored by our team between 2006 and 2008. The probability of survival of each life stage of each species at each site was calculated using WorldClim mean yearly temperature and the ‘Map Algebra’ tool from ArcMap. The decision to use mean yearly temperatures (as opposed to minimum or maximum temperatures) was based on the strong correlation found between mean temperature and elevation in the Ecuadorian Andes (Dangles et al., Reference Dangles, Carpio, Barragan, Zeddam and Silvain2008). Minimum and maximum temperatures in the tropics are punctual events, both in space and in time (e.g. low early morning temperatures associated with freeze in some valleys), that show poor correlation with altitude (Dangles et al., Reference Dangles, Carpio, Barragan, Zeddam and Silvain2008 and see Appendix B in that same paper). We therefore considered that mean temperature was the best surrogate to investigate altitude-related physiological limitations of our insects. To obtain total survival of each species, we multiplied survival rates of eggs, larvae, and pupae. We then adjusted linear models to the relationships between survival probability and altitude. Finally, predicted survival probabilities along the altitudinal gradient were compared to the observed altitudinal limits and observed abundance of the three species (Dangles et al., Reference Dangles, Carpio, Barragan, Zeddam and Silvain2008).
Results
Model performance
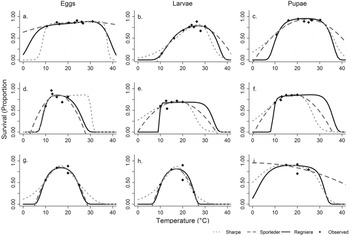
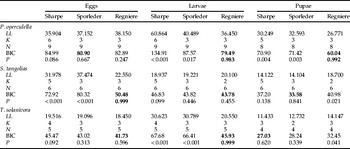
The BIC shows that Régnière's model is most often the one that best explains the data relative to its number of parameters (table 2). Calculations of posterior probabilities show that in four cases (P. operculella's larvae and pupae, S. tangolias’ eggs, and T. solanivora's larvae) the evidence for supporting Régnière's model over the others is either strong or very strong. Only in one case (S. tangolias’ pupae) there is positive evidence for supporting Sporleder's model over the other two. In all other cases, there is weak evidence supporting any of the three models. Fig. 2 shows the curves generated by the three models for the three stages of the three species. This figure shows how the three models differ mainly in their predictions of survival at extremely high and low temperatures. Parameter values for the three models can be found in Appendix 2.
Survival probability in relation to temperature of eggs, larvae, and pupae of P. operculella (a, b, c), S. tangolias (d, e, f), and T. solanivora (g, h, i). Bullets represent observed survival and lines predicted survival by the three models.

Performance of the three models fitted to survival data of eggs, larvae, and pupae of the three species of PTM. LL, log-likelihood; k, number of parameters; n, number of data; BIC, Bayesian Information Criterion; P, posterior probability. Lowest BIC values are in bold font. Bold font in P values indicates strong or very strong support for one model over the others.

Model robustness
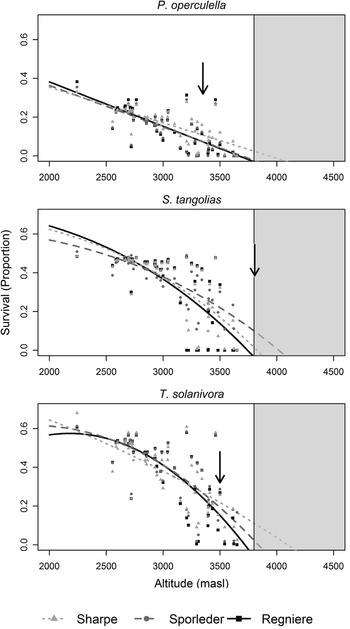
Simulations with the models using the mean annual temperature of the 50 monitoring sites allowed us to obtain a relationship between predicted survival probability and altitude (fig. 3). For P. operculella this relationship is best described by a linear model (s=ax+b, with S representing survival probability and x altitude in m.a.s.l., and R 2 = 0.57, 0.56, and 0.55 for predictions by Sharpe and DeMichele's, Sporleder's, and Régnière's models, respectively). S. tangolias’ survival probability is best described by a cubic model of altitude (s=ax 3+b, R 2 of 0.57, 0.61, and 0.53 for Sharpe and DeMichele's, Sporleder's, and Régnière's models, respectively). T. solanivora's survival probability is best described by a second-order polynomial of altitude (s=ax 2+bx+c, R 2 = 0.56, 0.56, and 0.59 for Sharpe and DeMichele's, Sporleder's, and Régnière's models, respectively). Using these relationships, we assessed the models’ ability to predict actual moth high altitude limits. For P. operculella and T. solanivora, the three models predict moth survival at higher altitudes than the maximum one where moths have ever been observed so far (i.e. 3350 and 3500 m.a.s.l., respectively). Sharpe & DeMichele's model greatly overestimates this limit (predicting survival of the two species at altitudes higher than 4000 m.a.s.l.), while the altitudinal limits predicted by the other two are closer to the observed limits. In the case of S. tangolias, Régnière's model is the only one that accurately predicts the observed altitudinal limit of the species. It is important to note that these altitudinal limits are valid for the Ecuadorian Andes and that moth altitudinal distribution in other places (i.e. Peru or Bolivia) may differ due to different climatic conditions in such places or to local adaptations of insects. No correlation is found between moth's predicted survival and observed abundance (Appendix 3). Neither a logarithmic nor a polynomial model fit significantly to the data (R 2 values ranged between 0.21 and 0.39).
Predicted survival rates (bullets) of P. operculella, S. tangolias, and T. solanivora by the three models in 50 sites located along an altitudinal gradient in the Ecuadorian Andes. Predicted survival of P. operculella, S. tangolias, and T. solanivora were adjusted to linear, cubic, and second-order polynomial models, respectively. Adjusted models are represented by lines. The gray area symbolizes altitudes above the agricultural frontier, where no crop is cultivated (Gondard & Mazurek, Reference Gondard, Mazurek, Gondard and León2001; Liger, Reference Liger2010), and arrows represent maximum altitudes where moths have been recorded during field monitoring in Ecuador (Dangles et al., Reference Dangles, Carpio, Barragan, Zeddam and Silvain2008).

Discussion
Comparing various models of insect survival
Accurately predicting the level of success of an invasive insect species in a particular territory necessitates a good description of its climatic niche (Sinclair et al., Reference Sinclair, Vernon, Jaco Klok and Chown2003; Logan et al., Reference Logan, Régnière, Gray and Munson2007). Temperature-related survival constitutes a direct measurement of organisms’ tolerance and is an essential component of fitness (Gilchrist, Reference Gilchrist1995; Angilletta, Reference Angilletta2009). Several studies have investigated the influence of temperature on insect survival (Ma, Reference Ma1997; Perez-Mendoza et al., Reference Perez-Mendoza, Weaver and Throne2004; Bonato et al., Reference Bonato, Lurette, Vidal and Fargues2007), but this temperature response has rarely been incorporated in predictive phenological models for insects (Bentz et al., Reference Bentz, Logan and Amman1991; Gilbert et al., Reference Gilbert, Powell, Logan and Bentz2004; Ma & Bechinski, Reference Ma and Bechinski2008). Nevertheless, survival responses to temperature have been found to differ from developmental responses, especially in relation to optimum and extreme temperatures (Ma, Reference Ma1997; Perez-Mendoza et al., Reference Perez-Mendoza, Weaver and Throne2004; Bonato et al., Reference Bonato, Lurette, Vidal and Fargues2007). In particular, in places where temperatures approach lethal extremes, a precise assessment of physiological limits is important for accurately predicting the risk posed by invasive pests (Régnière et al., Reference Régnière, Powell, Bentz and Nealis2012). In the specific case of the Ecuadorian Andes, mean temperatures at high altitudes may be frequently close to the lower threshold temperatures for survival, and species’ distribution is restricted to altitudes with suitable temperatures (Dangles et al., Reference Dangles, Carpio, Barragan, Zeddam and Silvain2008).
In this study, we compared the ability of three different models to predict temperature-related PTM survival. We were particularly interested in assessing the behavior of these models when fitted with a small dataset that did not cover the whole possible temperature range. Small datasets are indeed a common caveat for many agricultural pests in the tropics, thereby impeding sound predictions of insect survival at temperature extremes (Niño, Reference Niño2004; Sporleder et al., Reference Sporleder, Kroschel, Quispe and Lagnaoui2004; Jaramillo et al., Reference Jaramillo, Chabi-Olaye, Kamonjo, Jaramillo, Vega, Poehling and Borgemeister2009). Even though our analyses of posterior probabilities with the BICs showed that in most cases there was weak evidence for supporting one model over the other two, a qualitative assessment of different response curves showed that their predictions differed mostly at temperature extremes. In particular, Régnière's model consistently produced bell-shaped curves with close to 0% survival at low and high temperatures, whereas in two cases (P. operculella eggs and T. solanivora pupae) Sporleder's polynomial model was unable to produce bell-shaped curves and predicted high survival all along the temperature range. The ability of Régnière's model to produce bell-shaped curves allowed a better estimation of the observed altitudinal limits of the species. Nevertheless, the three models predicted survival of P. operculella and T. solanivora to altitudes higher than the maximum altitudes where moths have been found during field monitoring in Ecuador (Dangles et al., Reference Dangles, Carpio, Barragan, Zeddam and Silvain2008). The same was observed for predictions of S. tangolias survival by Sporleder's and Sharpe & DeMichele's models. This could mean that the actual upper range distribution of these species may not be limited by low temperatures but by other factors such as biotic interactions (competition and predation) or by the agricultural line which corresponds to the potato crop line (Gondard & Mazurek, Reference Gondard, Mazurek, Gondard and León2001; Liger, Reference Liger2010). This suggests that future lines of research should assess the actual factors limiting the altitudinal distribution of these species in a better manner.
Potential applications
Accurate measures of temperature tolerance are crucial for predicting the consequences of global climate change on pests' fitness and distributions (Deutsch et al., Reference Deutsch, Tewksbury, Huey, Sheldon, Ghalambor, Haak and Martin2008; Jaramillo et al., Reference Jaramillo, Chabi-Olaye, Kamonjo, Jaramillo, Vega, Poehling and Borgemeister2009). Based on simulations of warming tolerance of the Coffee Berry Borer, Hypothenemus hampei, Jaramillo et al. (Reference Jaramillo, Chabi-Olaye, Kamonjo, Jaramillo, Vega, Poehling and Borgemeister2009) predicted devastating effects of global warming on future coffee production. Survival models are useful for evaluating the risk posed by pest species to farmers’ crop and agricultural products (Tang et al., Reference Tang, Wang, He, Jiang and Wang2008). Agricultural landscapes in tropical countries are highly threatened by an increasing number of pest species, but studies are scarce and data are difficult to obtain. We hence believe that the value of Régnière's model lies in its ability to simulate more accurately PTM survival at low and high temperatures when fitted to very few data. This may be particularly useful for models that include insect dynamics under extreme temperature conditions. For example, simulating natural, long-distance dispersal events – during which, insects may be exposed to extremely low atmospheric temperatures (Isard et al., Reference Isard, Gage, Comtois and Russo2005) – requires accurate understanding of the effects of extreme conditions on insect survival. Survival models, as the one proposed in this study, could thus improve our ability to simulate such dispersal events and the actual threats posed by invasive pests.
Predictions of insects population dynamics with models running at fluctuating temperatures have been found to produce more realistic results than with constant temperatures (Gilbert et al., Reference Gilbert, Powell, Logan and Bentz2004). In a further step, it would thus be interesting to run the survival models under fluctuating daily temperatures, rather than constant annual means. We could expect that the ability of Régnière's model to more accurately predict low temperature mortality will make it more precise when working with temperatures that frequently approach low, lethal temperatures.
The supplementary material for this article can be found at http://www.journals.cambridge.org/BER.
Acknowledgments
This work was part of the research conducted within the project Innovative Approaches for integrated Pest Management in changing Andes (C09-031) funded by the McKnight Foundation. This work was part of Verónica Crespo-Pérez's doctoral project, financed by grants from the French Embassy in Ecuador and from the Département Soutien et Formation des communautés scientifiques du Sud (DSF) of the IRD. We would like to thank two anonymous reviewers whose constructive suggestions greatly improved the quality of our contribution.