


Introduction
Often, new discoveries in science, or even new fields of science, have followed technological break-throughs. For example, modern astronomy followed the invention of the Galilean telescope. The development of World War II radars enabled the discovery of the reflection of micro-wave radiation from precipitation, and opened the field of radar meteorology. Similarly, the flight of aircraft radar altimeters in polar regions led to the discovery of the penetration of radio waves into glaciers, and opened the field of radio-glaciology. Reviewing these and other developments as I prepared this lecture, I gained a greater appreciation of the broad range of technology used by glaciologists, and the enormous impact of technology on the advancement of glaciology.
The other lectures here mention many of the major contributions of technology as an integral part of the development of their sub-disciplines, a view that I think reflects the centra! role of technology in modern glaciology. My own viewpoint, as a former experimental physicist, is that technology is usually something to be invented for the solution of scientific problems. To an experimental physicist, technology is also something to be adapted, but rarely is it just ready to serve as a tool for scientific advances. I think glaciologists have a similar approach, with emphasis on the adaptation of new technology. At the concurrent “Symposium on Remote Sensing in Glaciology”, for example, you see papers on glaciology, presented primarily by glaciologists. It is also interesting to note that, after meteorologists, glaciologists were among the first to use satellite remote sensing.
Background
The early tools of glaciologists were simple, by today's standards, tools for measuring forces, temperature, and distance. During the last 50 years, our means of collecting data have advanced considerably, and so have the means of recording data – the cameras, the electronic devices, and the computers. However, reading Snow structure and ski fields by our founder, Dr Gerald Seligman, I gained a strong sense that the instruments of his time were at least as important to glaciology, as a quantitative science, as our instruments are now. The first chapter of Dr Seligman's book is “Instruments and methods”, in recognition of the great importance of the so-called simple tools. Today, for comparison, “Instruments and methods” is a small section at the end of the Journal of Glaciology.
Some of Seligman's instruments were: a scale for snow density, a wind meter, the microscope, which has been a very important tool, and a magnifying camera. You can see on page 2 that instructions were not always adequate, his magnifying camera required some clever trial-and-error methodology. Improvising in the field is often required, even today. These tools plus thermometers, tape measures, surveying transits, levels, and a few similar devices were the primary technology in use 50 years ago. This was the technology that was used to study the structure of ice in its many forms, such as the beautiful snow-crystal photography and classification by Reference Bentley and HumphreysBentley and Humphreys (1931). The microscope and the camera remain essential tools for glaciologists for studying the properties of ice, for example, the study of ice-grain boundaries (Reference Susuki and KuroiwaSusuki and Kuroiwa, 1972) and the grain structure of ice in polarized light.
Photography, in its many forms, certainly has been one of the most important tools for glaciologists. The moraines, the cirques, and the flow lines are shown in vivid detail in the photographs in the very interesting book of Reference Post and LaChapellePost and LaChapelle (1971). Photography has many forms, including aerial photography (Fig. 1) showing for example the crevasse patterns of Ice Stream B in Antarctica (Reference RoseRose, unpublished), the enhanced satellite imagery (Reference Lucchitta and FergusonLuchitta and Ferguson, 1986; Reference Swithinbank and LucchittaSwithinbank and Luchitta, 1986) and falsecolor representations of multi-spectral satellite data in Reference WilliamsWilliams (1987). Sometimes the imagery displays data from multiple sensors, such as the combination of visible and radar imagery in Figure 2 from Reference Hall and OrmsbyHall and Ormsby (1983).
RC-8 mapping camera mounted in U.S. NSF/Navy C-130 aircraft. Recently used by U.S. Geological Survey for aerial photography of ice streams and crevasse fields in West Antarctica (Reference Vornberger and WhillansVornberger and Whillans, 1986).

False-color image of Malaspina Glacier, Alaska, combining digital data from the Landsat multi-spectral scanner and the Seasat SAR imaging radar. Composite shows morainal patterns and interlobate features not evident in single-sensor data (Reference Hall and OrmsbyHall and Ormsby, 1983).

During the last 50 years, a variety of instruments has been adapted or invented by glaciologists – from those I just mentioned to radars, seismometers, mass spectrometers, ice-core drills, micro-wave radiometers, and so forth (Table I). Glaciologists have eagerly utilized and adapted new technology to study the size, distribution, internal structure, velocity, deformation, accumulation rate, boundary conditions, physical properties, and chemical constituents of ice. In some cases, the new instruments are just new ways of measuring the same thing, but measuring more precisely, and sometimes on global scales. For example, lasers measure distance, but a laser on a satellite could map changes in ice-sheet thickness – over the whole ice sheet, over and over again.
Glaciological Instruments
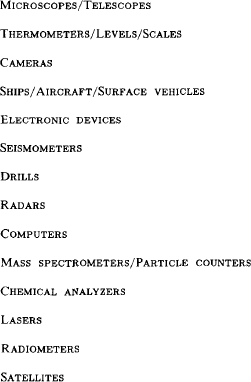
During this century, our means of getting to the Earth's ice masses to collect data have advanced – from sailing ships such as Nansen's Fram to modern research icebreakers such as Polarstern. Submarines collect data under the sea-ice pack, airplanes and satellites collect data from above vast areas of ice, and, in the future, polar missions of the space shuttle will carry new instruments for ice measurements.
Turning back in time, motor toboggans were first used by Scott, and skis have long been a primary means of surface travel on glaciers. The connection between the technology of the ski and the technology of the modern snowmobile is often a long rope, solemnly connected to the throttle, in case part of the technological system falls into a crevasse. More seriously, perhaps, it should be noted that combining old and new technology is often essential to acquire the information needed for glaciological research.
Major Advances and Responsible Technology
One way to focus the relationship between technological developments and advances in the science of glaciology is to consider some of the major advances over the last 30 years or so, and the responsible technology (Table II). Another viewpoint might be the spatial and temporal scales, or the generalized dimensions, probed and recorded by our instruments. For example, consider the internal dimensions, the measurement of glacier thickness and internal layering – first by vacuum-tube seismometers, then by radio echo-sounding, and now sounding of subglacial layers with digital seismometer systems.
Major Advances and Responsible Technology

Ice-core drilling opened several new dimensions to glaciologists. Physically, it opened the inside of glaciers to probing of ice temperature, fabric, deformation, and subglacial characteristics of critical importance to understanding ice dynamics. Of even broader interest, it opened the past record of atmospheric composition, temperature, precipitation, and contaminants for thousands of years. Modern experimental methods of physics and chemistry have been essential for the extraction of information from the ice, such as isotope ratios and carbon dioxide concentration.
A major new dimension was opened by satellite all-weather sensors – global views of snow and ice fields, at daily intervals. Global sea-ice extent is now continually monitored by passive micro-wave imagers. The Weddell Sea polynya and smaller areas of open water within the winter ice pack were discovered over a decade ago. Satellite altimeters map ice-sheet elevations and possibly elevation change. Data buoys, transmitting position and pressure, have advanced our knowledge of sea-ice dynamics. Ice-sheet velocities are routinely measured by satellite geodetic positioning. High-speed computers are essential for satellite-data analysis, as well as modeling glacier dynamics. Changes in ice margins are mapped by photography and satellite altimetry.
Tracing the development and use of the technology for these advances – the people involved, the institutions, the countries – would take several papers. Therefore, I selectively cover these advances, and some other technology, by discussing some samples of instrumentation and related scientific results. Most of the examples are from the sub-disciplines of sea-ice and ice-sheet glaciology, with which I am most familiar. However, parallel developments have occurred in most aspects of glaciology, and other equally good examples could be chosen.
Seismic sounding, which provided the first measurements of ice-sheet thickness, had progressed to the state of the bulky vacuum-tube, strip-chart recording equipment shown in Figure 3a, by the time of the International Geophysical Year. During the 1957-58 Sentinel Mountains Traverse, the Texas Instruments 7000B Portable Seismograph System provided data on the grounding of the West Antarctic ice sheet, well below sea-level, and evidence of a basal moraine entrained within the ice (Reference Bentley and CraryBentley, 1971). This well-loved system has only recently given way to the more compact and sensitive solid-state digital recording system shown in Figure 3b. Data from the new system (Fig. 4), analyzed with modern techniques for signal extraction, has provided the first evidence that Antarctic ice streams are underlain by deformable tills, which may be the major factor maintaining fast ice flow (Reference Alley, Alley, Blankenship, Bentley and RooneyAlley and others, 1986; Reference Blankenship, Blankenship, Bentley, Rooney and AlleyBlankenship and others, 1986).
a. Portable seismograph system used in West Antarctica during 1957-58 Seminal Mountains Traverse, with vacuum tubes and wet-chemical photographic processing of oscillograph records. b. Modern digital-recording seismograph system used on Ice Stream B during 1985-86. with solid-stale electronics and digital magnetic-disk recording (by courtesy of C.R. Bentley).

Digitally processed reflection seismogram from West Antarctic Ice Stream B, showing subglacial till (Reference Rooney, Rooney, Blankenship, Alley and BentleyRooney and others, 1987).

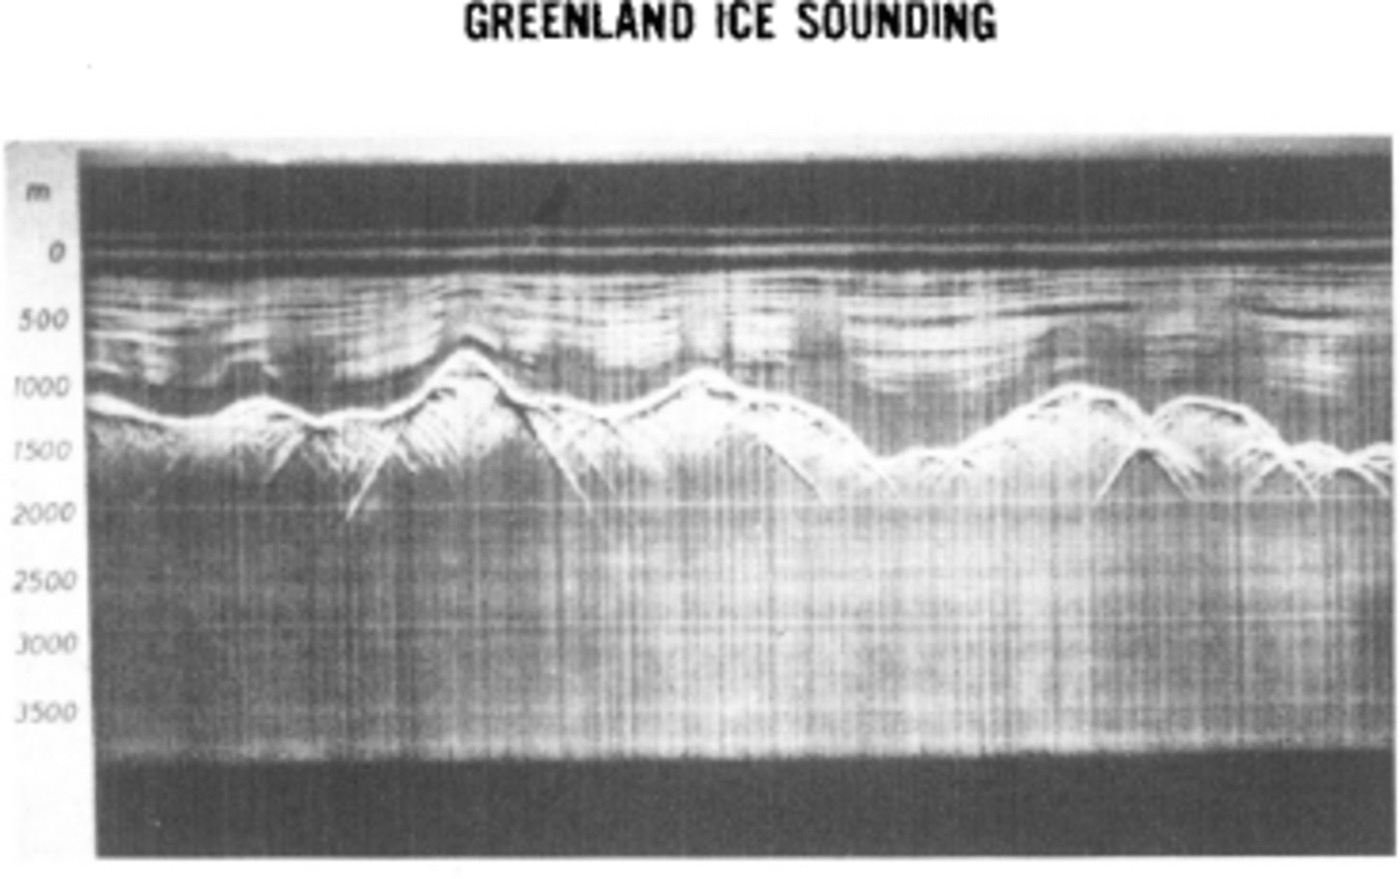
Radar (or radio-echo) sounding, by which ice thickness was first measured with a standard U.S. Air Force radar altimeter (Reference Waite and SchmidtWaite and Schmidt, 1962), enabled profiling of ice thickness from the surface (Fig. 5; Reference WalfordWalford, 1964; Reference JiracekJiracek, 1967) and profiling of surface and bedrock elevations from aircraft (Reference Evans, Evans, Gudmandsen, Swithinbank, Hattersley-Smith and RobinEvans and others, 1969; Reference RobinRobin and others, 1969). The history, theory, and equipment for glacier studies using electromagnetic waves have been described in detail by Reference Bogorodskiy, Bogorodskiy, Bentley and GudmandsenBogorodskiy and others (1985). In fact, most of our knowledge of the thickness and bedrock topography of glaciers has come from radar sounding, which has also pro vided data on internal reflections (Fig. 6; Reference GudmandsenGudmandsen, 1975) and the subglacial interface (Reference Oswald and RobinOswald and Robin, 1973). The internal reflections, which appear to be related to variations in acidity and volcanic activity (Reference HammerHammer, 1980), have been used as internal horizons for comparison with modeled ice flow (Reference WhillansWhillans, 1976). During the mid-1970s, using a new higher-power Danish radar and high-gain antennae mounted on a long-range C-130 aircraft, a joint U.K.-Danish-U.S. program extended radar sounding to half of Antarctica with 400 000 km of flight track (Reference DrewryDrewry, 1983).
a. First radar sounding of thick polar plateau ice at South Pole, 1964-65, by Jiracek and Bentley. Bottom echo through 2800 m of ice is visible at right and internal echoes at left. b. Waite's radar system used for South Pole soundings, installed inside miniwannigan for thickness profiling on Skelton Glacier (Reference JiracekJiracek, 1967).

Radar-sounding profile of Greenland ice sheet showing internal layers and bedrock reflections obtained with Danish equipment from U.S. C-130 aircraft, c. 1970 (by courtesy of P. Gudmandsen).
Satellite-radar altimetry was proposed by Reference Robin, Robin, Evans and BaileyRobin (1966) for surveying of ice-sheet topography and by Reference ZwallyZwally (1974) for determination of ice-sheet mass balance by repetitive elevation mapping. In 1975; the GEOS-3 satellite, with a radar altimeter designed for oceanographic research, provided the first satellite measurements of ice-sheet elevations (Reference Brooks, Brooks, Campbell, Ramseier, Stanley and ZwallyBrooks and others, 1978), followed by the shortlived Seasat in 1978 (Reference Brooks, Brooks, Williams, Ferrigno, Krabill, Oliver, Oliver, James and JagoBrooks and others, 1983; Reference Zwally, Zwally, Stephenson, Bindschadler and ThomasZwally and others, 1983[b]). Radar altimetry is also used for mapping ice-front positions and other surface features (Reference Thomas, Thomas, Martin and ZwallyThomas and others, 1983; Reference Partington, Partington, Cudlip, Mclntyre and King-HelePartington and others, 1987; Reference Zwally, Zwally, Stephenson, Bindschadler and ThomasZwally and others, 1987). Since 1985, the U.S. Navy Geosat has been measuring ice elevations up to latitudes of 72° (Fig. 7) and in the early 1990s the European ERS-1 will extend coverage to lat. 81.5 . Although estimates of surface-elevation change are being obtained (Reference ZwallyZwally, 1986) from radar-altimeter data with 1-2 m precision, laser altimetry with ten times greater precision will enable elevation-change determinations and studies of the mass balance over most of the ice sheets.
Three-dimensional display of Greenland ice-sheet surface topography south of lat. 72°N., as obtained from Seasat radar altimetry in 1978 and plotted on a desk-top image-analysis computer by R. Bindschadler. Contour intervals are 500 m. Similar data are being obtained by the U.S. Navy Geosat and analyzed for secular changes in surface elevation

The technology of ice drilling, ice-core analytical instruments, and bore-hole measuring devices have had a major impact on the field of glaciology. Moreover, the consequent scientific advances and ongoing research efforts extend well beyond the field of glaciology. For example, the amounts of carbon dioxide and dust in the atmosphere during the Wisconsin glaciation have been recently determined, and the global effects of specific volcanic eruptions during recent centuries are being studied.
Obtaining the precious ice core (Fig. 8) under a variety of conditions, including dry firn, high-pressure deep ice, and water in-flow, requires a blend of mechanical engineering and skilled art. The famous hand-operated S1PRE auger, the new light-weight shallow drills, thermal drills, intermediate-depth electro-mechanical drills, electromechanical and thermal drills in deep fluid-filled holes, and non-coring hot-water drills all have their specialized application. Highlights of ice-core drilling have been the deep penetration of the ice sheets, obtaining cores to bedrock at depths as great as nearly 2200 m, first in Greenland at Camp Century in 1966 (Reference Ueda and GarfieldUeda and Garfield, 1968) and at Dye 3 in 1981 (Reference Gundestrup, Gundestrup, Johnsen and ReehGundestrup and others, 1984; Reference Langway, Langway, Oeschger, Dansgaard, Langway, Langway, Oeschger and DansgaardLangway and others, 1985), in West Antarctica at Byrd Station in 1968 (Reference Ueda and GarfieldUeda and Garfield, 1969), and in East Antarctica at Vostok in 1982 (Reference Kudryashov, Kudryashov, Chistyakov, Zagrivny and LipenkovKudryashov and others, 1984). For valley-glacier research, non-coring hot-water (or steam) drills that enable deep insertion of probes have been of particular importance. Bore-hole measuring devices include inclinometers (Reference Garfield and UedaGarfield and Ueda, 1976) for measuring shear deformation, simple electronic sensors or emplaced markers for vertical strain measurement (Reference Rogers and LaChapelleRogers and LaChapelle, 1974), and cameras (film and video) for studying basal materials and sliding (Reference Harrison and KambHarrison and Kamb, 1973; Reference Engelhardt and EngelhardtEngelhardt and others, 1978).
a. University of Bern 4 in (10 cm) mechanical drill showing a firn core and chips from cutting. Design of cutting blades and mechanisms for removal of chips under a variety of ice conditions are special problems (by courtesy of H. Rufli). b. Retrieval of deep ice core at Dye 3 during Greenland Ice Sheet Project in 1981 (by courtesy of K. Kuivinen).

The recent activity and international co-operation in drilling developments, as well as the varied and specialized nature of ice-drilling technology, are evident in the report of the Second International Workshop/Symposium on Ice Drilling Technology and, in particular, in the overview of Reference HansenHansen (1984) and the dedication of the symposium to glaciologists H. Bader and A. Crary, and engineer H. Rufli. The success of the Danish deep drilling at Dye 3 (Reference Gundestrup, Gundestrup, Johnsen and ReehGundestrup and others, 1984) reflects considerable internal co-operation and represents modern technology in the form of a microprocessor-computer control and a light-weight battery-operated drill motor. Advanced technology also enabled solar-powered ice-core drilling at 5700 m altitude on the tropical Quelccaya ice cap (Reference KociKoci, 1985). On the other hand, the sometimes limited value of technology transfer from other fields is illustrated by the limited performance of the wire-line coring system adapted from the oil-drilling industry (Reference Hansen and SplettstoesserHansen, 1976). Today, the challenge remains to drill the deepest ice (3000-4000 m) at the scientifically most interesting locations, rather than the logistically convenient research stations of the past.
Development of techniques for dating and analyzing ice and its entrapped elements has paralleled the acquisition of ice cores. Methods of modern physics and chemistry, employing mass spectrometers, lasers, and other techniques for analyzing atomic composition and radioactive decay, have been essential to the extraction of information from the ice cores. Semi-automated measurements on a mass spectrometer of for 16O / 18O stable-isotope ratios, in large numbers of ice-core samples, has provided detailed climate records extending over 100 000 years (Reference Dansgaard, Dansgaard, Johnsen, Clausen and GundestrupDansgaard and others, 1973). The d.c. conductivity technique, only recently employed for measurement of acidity, is very simple (Reference HammerHammer, 1980), for example. In contrast, the techniques for ice-age dating using unstable isotopes (Reference Oeschger, Langway, Langway, Oeschger and DansgaardOeschger, 1985) are complex. As techniques have improved, the amount of core sample (or melt water) required for analysis, using sensitive instruments such as laser-absorption spectrometers, has decreased. However, some laboratory instruments are very large, such as the high-energy, particle-accelerator (Fig. 9) used for 10Be dating (Reference Beer, Beer, Langway, Langway, Oeschger and DansgaardBeer and others, 1985).
Tandem Van De Graaff particle accelerator at the ETH Zurich used by the University of Bern group as a mass spectrometer to determine 10Be activities in ice samples (by courtesy of H. Oeschger).

Coulter-counter measurement of microscopic dust concentrations in ice cores (Reference Thompson, Thompson, Mosley-Thompson and PetitThompson and others, [1981]) and correlations with the climate record from stable isotopes (Reference Lorius, Lorius, Merlivat, Duval, Jouzel and PourchetLorius and others, [1981]) has provided information on increased atmospheric dust during glacial periods. Scanning electron micrographs of the ‘entrapped dust (Fig. 10) enable the identification of the sources of particles as volcanic, continental, or extra-terrestrial (Reference Mosley-ThompsonMosley-Thompson, 1980). In particular, recent dust studies indicate that the high concentration of particles in the late Wisconsinan is predominantly due to wind-blown desert dust (Reference Petit, Petit, Briat and RoyerPetit and others, 1981). Analysis of entrapped gases, released in a specially designed crusher (Fig. 11), has provided new data on very interesting correlation between atmospheric CO2 and oxygen-isotope ratio variations, indicating lower CO2 in cooler periods (Reference Oeschger, Langway, Langway, Oeschger and DansgaardOeschger, 1985; Reference StansellStauffer and others, 1985). The CO2 results raise interesting questions concerning the possible ocean-ice-land-atmosphere processes involved in climatic change on several time-scales.
Scanning electron micrographs of three basic types of insoluble particles found in ice cores: volcanic, continental, and spherules that are usually of extra-terrestrial origin (Reference Mosley-ThompsonMosley-Thompson, 1980).

Ice sample between inter-weaving arrays of needles for rapid crushing and extraction of entrapped CO2 at the University of Bern (by courtesy of H. Rufli).

Information on sea-ice motion and wind forcing, derived from drifting data buoys, has been essential to advances in sea-ice dynamics. The Soviet Drifting Automatic Radio-meteorological Stations (DARMS) using high-frequency radio triangulation from land provided extensive data on sea-ice motion in the eastern Arctic Ocean between 1953 and 1966 (Reference OlenicoffOlenicoff, 1968). Since 1970, data buoys, with electronics for determining positions from satellite-transmitted signals and for automatic recording and satellite relay of data, have been widely used for sea-ice studies (Reference Untersteiner and ThorndikeUntersteiner and Thorndike, 1982). For both sea and land ice, infra-red-laser ranging devices have become the standard tools for measuring distances and strain-rates between stakes or natural markers in the ice, replacing the more cumbersome radio-signal devices (Fig. 12) such as tellurometers of several decades ago (Reference Hibler, Hibler, Weeks, Ackley, Kovacs and CampbellHibler and others, 1973). Submarine-sonar (Reference Williams, Williams, Swithinbank and RobinWilliams and others, 1975; Reference Wadhams and HomeWadhams and Home, 1980) and airborne-laser profiling (Reference Weeks, Weeks, Tucker, Frank, Fungcharoen and PritchardWeeks and others, 1980) have measured sea-ice thickness, ridging, and ice-type distribution. In 1970, sequential aerial photography was a useful tool for observing ice deformation, particularly shearing motions (Reference Hibler, Hibler, Weeks, Ackley, Kovacs and CampbellHibler and others, 1973).
Electronic distance-measuring device in Antarctica around 1980 (unknown source).

Global observations of snow and ice fields commenced in the 1960s with the launching of meteorological satellites carrying imaging sensors of visible and infra-red radiation from the Earth's surface (Reference PredoehlPredoehl, 1966; Reference RoseSwithinbank, 1969, Reference Seligman1971). Although obscured by clouds in the same manner as visible sensing of reflected light, infra-red sensing of thermally emitted infra-red radiation during the polar night provided global views of sea-ice extent in all seasons (Reference Sissala, Sissala, Sabatini and AckermannSissala and others, 1972), as well as leads and polynyas within the winter sea-ice pack (Reference StretenStreten, 1973; Reference KnappKnapp, unpublished).
All-weather and all-year observation of sea ice on a daily basis commenced with the launch of the first satellite passive microwave imager (Fig. 13), called ESMR (Electrically Scanning Microwave Radiometer), on Nimbus-5 in December 1972 (Reference Gloersen, Gloersen, Wilheit, Chang and NordbergGloersen and others, 1974; Reference Zwally, Zwally, Bindschadler, Brenner, Martin and ThomasZwally and others, 1983[a]; Reference Parkinson, Parkinson, Comiso, Zwally, Cavalieri, Gloersen and CampbellParkinson and others, 1987). Much of the technology for ESMR followed the development of sensitive microwave radiometers for radio-astronomy. Sensitive to naturally emitted electromagnetic radiation at microwave frequencies, and consequently to the large contrast in emissions from sea ice and open ocean, the ESMR observations enabled the discovery of the 200 km by 1000 km Weddell Sea polynya (Reference Zwally, Zwally, Wilheit, Gloersen and MuellerZwally and others, 1976) and significant amounts of open water throughout the Antarctic sea-ice pack during winter (Reference Ackley and KeliherAckley and Keliher, 1976; Reference Zwally and GloersenZwally and Gloersen, 1977). Understanding of the variable microwave emissions from different types of snow and ice, as needed for interpretation of the satellite data, came mainly from a series of surface and aircraft measurements (Reference Wilheit, Wilheit, Nordberg, Blinn, Campbell and EdgertonWilheit and others, 1972; Reference Burtzev and BurtzevCampbell and others, 1974). Sensitive also to the difference in emission between multiyear and first-year sea ice (Fig. 14; from Reference Gloersen, Gloersen, Nordberg, Schmugge and WilheitGloersen and others, 1973), the passive microwave data also provide unique information on the concentration of multi-year ice (Reference Cavalieri, Cavalieri, Gloersen and CampbellCavalieri and others, 1984) and the drift, convergence/ divergence, and inter-annual variability of the perennial ice pack on the Arctic Ocean (Reference Zwally and WalshZwally and Walsh, 1987).
The Electrically Scanning Microwave Radiometer (ESMR), approximately 1 m square. Visible are electromagnetic wave guides, the Dicke radiometer, and ferrite phase shifters for the phased array antenna (opposite side) that scanned ±50° of the Nimbus-5 satellite ground track in 78 positions of approximately 30 km on the Earth's surface (by courtesy of T. Wilheit).

False-color display of intensity of 1.55 cm wavelength micro-wave emission from sea ice obtained by aircraft model of ESMR in 1971. Lower emission from multi-year ice floe, compared to surrounding first-year ice, is caused by radiative scattering in the low-salinity freeboard and provides physical basis for measurement of multi-year concentration from space. Aidjex camp and nearby strain array are shown in white. (From Reference Gloersen, Gloersen, Nordberg, Schmugge and WilheitGloersen and others, 1973.)

Sequential high-resolution satellite imagery has been recognized as an unique tool for measuring sea-ice velocity fields on spatial scales extending from the size of resolvable ice floes to the entire ice pack, but it has been limited primarily by the availability of suitable data. Early velocity measurements utilized the 100 m resolution Landsat imagery (Reference Campbell, Campbell, Gloersen, Nordborg, Wilheit, Bock, Bock, Baber and RuttenbergCampbell and others, 1974; Reference Hall and PritchardHall, 1980), but were limited by cloud cover and the 18 day interval between successive images. Satellite-radar mapping of the sea-ice pack was accomplished with a synthetic-aperture (25 m resolution) imaging radar on Seasat in 1978 and a real-aperture imaging radar (2 km resolution) on KOSMOS-1500 in 1983 (Reference Burtzev and BurtzevBurtzev and others, 1984). The Seasat data have been used for measurements of ice-velocity fields (Reference Hall and RöthrockHall and Rothrock, 1981; Reference Leberl, Leberl, Raggam, Elachi and CampbellLeberl and others, 1983). Using sequential infra-red imagery from the NOAA-7 satellite, Reference Ono, Ono, Yamanouchi and ChumaOno and others (1985) produced a very impressive analysis of the sea-ice velocity field (Fig. 15) during winter near the Antarctic coast, showing velocities of several tens of km/d and patterns of surface currents related to the topography of the continental shelf. The highly dynamic character of the Antarctic seaice pack is illustrated by the daily changes in ice concentration from passive microwave data (Fig. 16). In a few years, expanded studies of the ice-ocean processes associated with this dynamic activity may be expected as concurrent passive microwave and radar imagery are acquired.
Sea-ice velocities near Antarctic coast during winter obtained by Reference Ono, Ono, Yamanouchi and ChumaOno and others (1985), demonstrating the potential of sequential satellite imagery to provide new information on the dynamics of the wintertime ice pack (by courtesy of N. Ono. T. Yamanouchi, and H. Chuma).

Daily changes in Antarctic sea-ice concentrations from satellite ESMR data, showing alternate openings and closings of numerous coastal polynyas, the effects of an intense storm in the South Atlantic Ocean, and alternate regions of growth or decay along the ice edge related to southerly or northerly wind directions. The meso-scale Weddell Sea polynya of open water at long. 0°E., which persisted throughout the 1974, 1975, and 1976 winters, was discovered with the ESMR data.

Transit, the U.S. Navy system of polar-orbiting satellites and associated ground receivers of doppler-shifted signals and satellite-ephemeris data (Reference StansellStansell, 1978[a], Reference Stansell[b]), has become the standard tool for determining three-dimensional positions on the Earth's surface to several meters (Reference MockMock, 1976; Reference YoungYoung, 1979). Ice velocities are obtained from successive positionings (Reference Morgan, Morgan, Jacka, Akerman and ClarkeMorgan and others, 1982). Now, NAVSTAR, which is known as the Global Positioning System (GPS), is becoming operational and providing a significant advance in the acquisition of position and ice-velocity data. The features of GPS (Fig. 17) include accuracies in the centimeter range, sub-second measurement times, and real-time position determinations on moving platforms to about 20 m accuracy and possibly tens of centimeters relative accuracy.
a. Small antenna for Global Positioning System (GPS) mounted on tripod at site “A” in central Greenland during 1986. Identical antenna is mounted on C-130 aircraft in background, b. GPS equipment, inside aircraft, for continuous position determination, including IBM personal computer for data recording and real-time position display (by courtesy of S. Hodge).

Ice margins, velocities, flow lines, snow facies, snow lines, and ice divides have been mapped with enhanced Landsat and other satellite imagery. Some of the early observations of snow and ice from space were made by the astronauts on Skylab with hand-held cameras, demonstrating the ability to map snow lines (Reference Barnes, Barnes, Bowley, Parr and SmallwoodBarnes and others, 1977) and other ice features. The Skylab photographs of large tabular icebergs breaking apart in mid-latitude waters (Fig. 18; Reference Campbell, Campbell, Ramseier, Weeks and WayenbergCampbell and others, 1977) provide clues to the ocean-ice processes involved in iceberg distintegration. The Skylab observations also indicate the potential value of select photography, visual observations, and scientific insights that could be acquired by glaciologists on future space flights.
Photograph of a large tabular iceberg, taken by a Skylab astronaut in 1974 over the South Atlantic Ocean near the Falkland Islands, showing its disintegration into numerous smaller icebergs (Reference Campbell, Campbell, Gloersen, Nordborg, Wilheit, Bock, Bock, Baber and RuttenbergCampbell and others, 1977).

Earth, of course, is not the only planet of interest to glaciologists. Inter-planetary spacecraft (Reference SharpSharp, 1974) and the Viking Orbiter have acquired images of the Martian ice caps, patterned ground, and other features suggesting possible glacial processes on Mars (Reference Carr and SchaberCarr and Schaber, 1977). A radar altimeter and microwave radiometer experiment on the Mars Observer spacecraft, to be placed in orbit around the planet in the mid-1990s, will acquire data on the topography and possibly structure and composition of the Martian ice caps.
Today, computers are embodied in almost every aspect of glaciology. Large high-speed computers have been essential tools for numerical modeling of ice dynamics (Reference Budd, Budd, Jenssen and RadokBudd and others, 1971) and the handling of large volumes of satellite data. However, in the mid-1980s we entered the age of the personal computer and microprocessors, marking a revolution in the availability of low-cost compact computational capability. Now, computers control ice-core drilling and theodolites are available with built-in microprocessors. All papers in the Journal are typed one or more times on a word-processing computer and some are transmitted from computer to computer. Conventional imagery and many other kinds of data such as sea-ice concentration maps and ice topography are displayed and analyzed on image-analysis computers. One highlight of the 1984 I.G.S. tour to Tianshan glacier in north-west China was the display of instrumentation on the glacier, from which data were telemetered to a nearby station where it was automatically recorded with the aid of a small computer. Automatic low-power data loggers offer new possibilities for continuous data acquisition on glaciers, in contrast (perhaps unfortunately) to the 1949 picture of a glaciologist sitting in the sun surrounded by bulky wires and a Wheatstone bridge to acquire a few ice-temperature measurements (Reference SharpSharp, 1960). In general, as the knowledge of glaciology advances, it is often necessary to acquire and analyze enormous quantities of data to extract the essential information that leads to new advances.
Key Technology for Future Glaciology
Listed in Table III are principal technologies that I think will play a major role in the future of glaciology. Low-power, automatic data recorders with microprocessor control and continuous solid-state memories will be widely used for continual recording of glacier temperatures, strain-rates, and other parameters. New methods may be developed for collection of data at the ice-bedrock interface. There should be continued improvements in ice drilling, perhaps down-bore-hole measurement techniques, and certainly advances in the laboratory techniques for analysis of ice. GPS positioning to centimeter accuracy on the surface should become routine in a few years, and real-time continuous positioning of aircraft to meters will greatly enhance airborne data acquisition. Improved methods of drilling and core analysis will provide new insights to the past and future of our global environment.
Key Technology for Future Glaciology
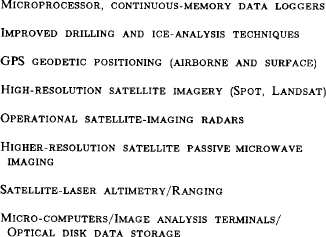
The advanced technology of satellite remote sensing will play a major role in glaciology, particularly in investigations of the interactions of ice with the ocean, land, and atmosphere, and the role of ice in global-scale processes and global change. Problems such as the mass balance of the polar ice sheets can be answered with precision laser-altimetry (Reference Zwally, Zwally, Thomas and BindschadlerZwally and others, 1981; Reference Bufton, Bufton, Robinson, Femiano and FlatowBufton and others, 1982) on a polar-orbiting satellite. Detection of changes in snow and ice cover, investigation of the causes and effects of changes, and prediction of future behaviour require extensive data sets that can be provided by continued application of today's technology to glaciology. New satellite sensors are planned, and new lower-cost means of storing and analyzing satellite data are becoming available to more investigators. Nevertheless, while thinking about advanced technology, it must be remembered that scientific advances will continue to be made only by clever application of possible tools, sometimes very simple tools as well as the complex.
For the future, I should like to focus on two science questions that concern glaciologists: (1) the mass balance and stability of the polar ice sheets, and (2) the variability of sea ice and its interaction with climate change. We have seen ice-sheet elevations mapped by satellite-radar altimetry, the potential of laser-altimetry, the very dynamic Antarctic sea-ice pack observed by satellite on a daily basis, the large inter-annual variability of the Antarctic sea-ice extent, and the capability to monitor the Arctic multi-year ice pack. We have interdisciplinary questions such as – how do changes in sea ice, possibly due to CO2-induced warming, affect precipitation over the ice sheets? Will a climate warming in polar regions cause the ice sheets to grow or shrink, and at what rate? Satellite remote sensing will play a major role in investigation of these global-scale processes – the interactions between ice, ocean, and atmosphere. Of particular importance will be co-ordination of the always essential surface measurements with satellite observations, and the assimilation of large amounts of data from a variety of sources.
One of the next satellites to provide important data is the European ERS-1, to be followed by a planned Japanese satellite with the same acronym and the Canadian Radarsat. An important aspect will be international programs of coordinated surface measurements, satellite measurements, and modeling such as the proposed Program for International Polar Oceans Research associated with ERS-1 (PIPOR Science Working Group, 1985). Planned for the mid-1980s are the multi-sensor polar platforms (Fig. 19) of the international Earth Observing System program initiated by NASA (Earth Observing System, 1984). Today, the U.S. space shuttle is a piece of advanced technology that is unfortunately broken. Before the tragic Challenger accident in January of this year, I had hoped to note here that the first space flight of Man over the Earth's poles, which was scheduled for July 1987, would carry the shuttle imaging radar for mapping the Antarctic ice sheet, the first flight of a laser altimeter for ice-sheet elevation mapping, and a polar glaciologist.
View of Earth from space showing the East Antartic ice sheet and artist's view of the planned Earth Observing System for the mid-1980s (photograph from NASA Jet Propulsion Laboratory).

Well, the shuttle will fly again, and when it does, it will carry new instruments and take glaciologists to a new view of an old frontier. We came into this century not knowing how thick the Earth's ice masses were. We now have the potential to enter the next century, knowing whether they are growing or shrinking. We also face the prospect of a warmer climate – particularly in the polar regions. Ice, in all its forms, will play a major role in the anticipated global change. We need to know how the Earth's ice changes, and why. The required technology is within our reach.
Acknowledgements
I deeply appreciate the special efforts of Karl Kuivinen, Heinrich Rufli, Charles Bentley, Ellen Mosley-Thompson, Chester Langway, Andy Heiberg, Will Harrison, Steve Hodge, Frank Carsey, Svein Hamran, David Drewry, Dorothy Hall, and others who graciously responded to my last-minute requests for information and copies of their slides, which became an essential part of my presentation. I also apologize to those individuals whose work is of equal or greater importance than the examples I have chosen. I have not attempted to be comprehensive in reviewing relevant research, and have tended to pick examples that are most familiar to me or those that I found in scanning through the Journal.



