Introduction
Sound environmental policy relies on sound science. However, US environmental policy, particularly the day-to-day decisions made by government bureaucrats, sometimes fails to integrate the best available science into regulatory practice (Jasanoff Reference Jasanoff1990; Dilling and Lemos Reference Dilling and Lemos2011; Husbands Fealing et al. Reference Husbands Fealing, Lane, Marburger and Shipp2011). This article examines when and why such failures may occur, focusing on the regulatory adoption of rapid (non-tidal) wetland assessment tools (RWATs) by state officials.
These officials are street-level bureaucrats, a class of government workers whose day-to-day activities critically shape on-the-ground policy. However, political science scholarship devotes only limited attention to the conditions under which these officials choose to adopt science policy innovations. Political and administrative superiors tend to give street-level bureaucrats substantial latitude to manage technically complex policy matters. Within that discretionary space, the incentives, constraints, learning patterns and propensities of front-line officials remain relatively opaque both to those superiors and to scholars. Examining the bureaucratic usage of RWATs allows this investigation to begin to unpack the phenomenon of front-line science policy innovation adoption.
RWATs are a class of technically complex science policy innovations designed to aid wetland management. A tool “(1) measures wetland condition, functions or value, (2) includes a site visit, and (3) takes two people no more than a half day in the field and another half day in the office to complete” (Fennessy et al. Reference Fennessy, Jacobs and Kentula2004, 543; own modifications in italics).Footnote 1 More than 100 tools have been developed in recent decades (Kusler Reference Kusler2006), although state environmental agencies were relatively unaware of these instruments until the late 1990s and 2000s.Footnote 2
Using RWATs can help bureaucrats meet statutory mandates. Under the Clean Water Act, federal wetland regulators must “strive to achieve a goal of no overall net loss of [wetland] values and functions” (US Army Corps of Engineers and US Environmental Protection Agency 1990). State officials often pursue the same aim because many state environmental laws mirror federal ones. Also, some states partner with federal actors to regulate wetlands and thus explicitly share this charge [Environmental Law Institute (ELI) 2008]. Assessment tools, which combine elements of a questionnaire and instruction sheet, highlight the data a bureaucrat should collect to evaluate the environmental consequences of changes proposed for a wetland (Sutula et al. Reference Sutula, Stein, Collins, Fetscher and Clark2006). The tools help bureaucrats interpret those data when making a regulatory decision, such as approving or denying a permit for housing construction, so that the choice helps achieve the no net loss goal.
In some states, bureaucrats decide whether to issue and how to condition state permits for activities affecting wetlands (ELI 2008). Even in states without their own permitting programmes, Clean Water Action Section 401 charges state officials with ensuring that wetland impacts do not violate state water quality standards. State officials also can require permit recipients to replace wetland attributes lost because of the permittee’s activities (ELI 2008). Accounting for wetland functions and values when making such regulatory decisions has challenged officials for decades (Kusler Reference Kusler2006; Mitsch and Gosselink Reference Mitsch and Gosselink2007). Presumably, state bureaucrats should be eager to embrace tools that facilitate this accounting. However, while few data empirically document the extent to which state officials use RWATs in regulation, anecdotal evidence suggests that use is relatively infrequent (Kusler Reference Kusler2006).
This behaviour is puzzling. Although the Clean Water Act does not require the application of RWATs, the US Environmental Protection Agency (EPA 2006) strongly encourages it. Experts contend that well-designed and applied RWATs can help states identify and address water quality impairments and intelligently prosecute regulation (Ainslie Reference Ainslie1994; Sutula et al. Reference Sutula, Stein, Collins, Fetscher and Clark2006). Using assessment tools instead of the status quo regulatory approach – which often uses wetland acreage and type as rough indicators of resource quality, mixed with a dose of the regulator’s professional judgment – arguably should result in better-managed wetlands (Brinson and Rheinhardt Reference Brinson and Rheinhardt1996).Footnote 3 Thus, understanding why bureaucrats tend not to use RWATs requires a closer look at the policy context.
RWAT use is largely a matter of discretionary choice by state officials. In five of the six states considered here, implementing bureaucrats have roughly equal levels of discretion to use such tools. Officials in the last state examined here, Ohio, have less discretion because Ohio officially adopted an RWAT for regulatory use. However, even there, the tool is not used for all regulatory activities and was not official practice for the entire study period.
The bureaucrats who could use RWATs might include wetland staff members in a state’s environmental regulatory agency, but they also may consist of transportation planners, stormwater managers, biologists charged with protecting threatened and endangered species and Clean Water Act Section 401 reviewers.Footnote 4 They may be employed in diverse state agencies, including those devoted to natural resource protection, fish and game management and environmental regulation. Many have not received explicit top-down direction from their administrative agencies about which tools to use and how. In some states, environmental agencies recommend use of an RWAT but do not specify which. In others, tool use is neither officially recommended nor prohibited (see ELI 2008).
The amorphous, discretion-laden organisational contexts in which state wetland bureaucrats operate make particularly compelling the questions of whether and when state wetland regulators choose to use RWATs. The answers offer insight into how adoption of science policy innovations occurs on the front lines of large government bureaucracies.
Conceptual framework
The officials who could use RWATs can be understood as street-level bureaucrats. Like the front-line officials described by Lipsky (Reference Lipsky1980), these bureaucrats deal on a regular basis with clients such as permit applicants. They possess technical expertise that makes their political and administrative superiors likely to give them substantial freedom when making regulatory choices, particularly about issues, such as a RWAT use, which have low public salience (Gormley Reference Gormley1986). Street-level bureaucrats generally face large workloads, tightly constrained budgets and multiple and potentially competing demands from superiors (Lipsky Reference Lipsky1980; Evans and Harris Reference Evans and Harris2004). They develop standard operating procedures to make their day-to-day work manageable and to influence client behaviour (Lipsky Reference Lipsky1980; Fineman Reference Fineman1998; Evans and Harris Reference Evans and Harris2004; Honig Reference Honig2006).
RWATs have specific characteristics that suggest that street-level wetland officials should embrace them. First, the tools help bureaucrats control their clients by setting clear behavioural standards. If a client knows that her permit application will be subject to a standard review process that employs an assessment tool, her behaviour may be different than if she expects a bureaucrat to evaluate the permit in an ad hoc manner (e.g. Fineman Reference Fineman1998). For example, the client may be more likely to provide site data she knows the bureaucrat needs in the format the bureaucrat requires, rather than wait for potentially idiosyncratic bureaucratic requests.
Second, street-level bureaucrats rely heavily on coping mechanisms (Winter Reference Winter2002). An RWAT is such a mechanism; its use reduces a wetland official’s cognitive burden by providing decision rules, indicating appropriate regulatory actions. Such rules are akin to the paperwork shortcuts developed by the teachers profiled by Weatherly and Lipsky (Reference Weatherley and Lipsky1977); they allow front-line officials to execute their many tasks without having to think through every choice.
Third, RWATs protect bureaucrats from criticisms that might be levied by administrative superiors, clients or the courts. One of Lipsky’s (Reference Lipsky1980) central arguments is that street-level bureaucrats seek autonomy. Key here is the fact that these officials do not necessarily seek autonomy for its own sake; rather, they build expertise, maximise information asymmetries between themselves and their superiors and clients (Bohte and Meier Reference Bohte and Meier2000; Winter Reference Winter2003) and, in other ways, seek to “secure their work environment” (Weatherly and Lipsky Reference Weatherley and Lipsky1977, 195) to prevent outsiders from second-guessing their choices. Using a decision-support tool vetted by scientific experts is a strategy for bureaucratic self-protection. In theory, a challenge to a bureaucrat’s decision should falter when confronted with the backstop of the codified, scientifically grounded best practices an RWAT offers.Footnote 5 Given these incentives, the apparent failure of bureaucrats to seize the advantages offered by RWATs is surprising.
Street-level bureaucrats create policy through their day-to-day activities (Weatherley and Lipsky Reference Weatherley and Lipsky1977; Lipsky Reference Lipsky1980; Maynard-Moody and Musheno Reference Maynard-Moody and Musheno2003). Those activities are essentially a series of policy adoptions, where adoption is the formulation of a policy measure (e.g. writing a wetland permit) that is subsequently executed (e.g. granting the permit; Weimer and Vining Reference Weimer and Vining2005). Yet, the political science literature on the adoption of policy innovations has not paid substantial attention to this phenomenon, as it involves street-level bureaucrats.Footnote 6
That literature tends to use states or municipalities as units of analysis, exploring how external factors, such as the policy choices of proximate jurisdictions, and internal factors, such as available resources, affect adoption (e.g. Walker Reference Walker1969; Berry Reference Berry1994; Berry and Berry Reference Berry and Berry1999). Adoption is often evidenced by the presence of a policy in a jurisdiction where it previously was absent. The entity achieving adoption (e.g. a legislature) often is not specified (e.g. Feiock and West Reference Feiock and West1993; Soss et al. Reference Soss, Schram, Vartanian and O’Brien2001) or is discussed vaguely (e.g. Berry and Berry Reference Berry and Berry1990; Berry Reference Berry1994; Boehmke and Witmer Reference Boehmke and Witmer2004). Scholars who do focus on these entities (e.g. Allen and Clark Reference Allen and Clark1981; Pavalko Reference Pavalko1989; Hays and Glick Reference Hays and Glick1997) tend to analyse them as unitary actors, often using their traits, such as susceptibility to lobbying, to explain adoption trends. The problem with this perspective is that it places the processes by which actors positioned to entrench innovations into day-to-day policy practice, and often the actors themselves, into a black box. Yet, neither slack resources, the proximity of jurisdictions that have adopted policies nor the traits of entities, such as legislatures, drive the actual processes of adoption. Those processes are driven by the choices of officials on the ground.
A smaller literature examines the policy adoption choices of bureaucrats. Sapat (Reference Sapat2004) studies state environmental agency policy adoption by examining decisions of top agency administrators. Teodoro (Reference Teodoro2009) investigates how the professional norms and networks of police chiefs and water utility managers affect the likelihood of these individuals to adopt policy innovations. Teske and Schneider (Reference Teske and Schneider1994) examine innovative policy activity in local governments by examining the behaviour of city managers. Problematically, this scholarship tends to focus on officials with political connections and managerial responsibilities, not on street-level implementers. That the two groups face markedly different day-to-day realities is a strong reason to believe that street-level bureaucrats face different incentives and constraints vis-à-vis adoption of science policy innovations.
Taking the role of implementing agents seriously returns the political science literature on policy adoption to its roots. The discipline’s theories in this arena are developed by borrowing from theories explaining individual-level innovation adoption (Berry and Berry Reference Berry and Berry1990). This article argues that researchers should not have been so quick to shift their units of analysis. This stance is buttressed by the bottom-up perspective of policy implementation (e.g. Sabatier Reference Sabatier1986; deLeon Reference deLeon and deLeon2002), scholarship on the street-level bureaucracy and the “Bloomington” school of institutional analysis (e.g. Ostrom Reference Ostrom2005; Aligica and Boettke Reference Aligica and Boettke2009), all of which argue that the beliefs, behaviours and actions of policy implementers are as much or more responsible for the shape of a policy as the political leaders who ostensibly designed it. The adoption choices of government organisations are substantially formed by the adoption choices of front-line officials. Analysing those latter choices can help establish the micro-foundations that the mainstream policy adoption literature tends to lack.
This article contends that street-level bureaucrats must learn about policy innovations before they can adopt them, and that they are likely to learn about them from the people they encounter and activities they prosecute in their immediate professional environments. Brehm and Gates (Reference Brehm and Gates1997) observe that street-level bureaucrats often look to one another for “social proofs” of correct behaviour. Interpersonal ties are likely to be the primary mechanisms by which such bureaucrats learn about technically complex, low-salience policy instruments (Muth and Hendee Reference Muth and Hendee1980; Rose Reference Rose1991). Moreover, wetland bureaucrats operate in contexts of relatively low political conflict but high ambiguity.Footnote 7 Matland (Reference Matland1995) argues that this combination of factors makes bureaucrats’ adoption activities particularly “open to environmental influences” (Matland Reference Matland1995, 166), that is, open to experiential, on-the-job learning. This conceptual framework contextualises three hypotheses, presented next, about the learning pathways that may influence the RWAT adoption choices of street-level bureaucrats.
Learning pathway 1: job experience
More job experience should cause a bureaucrat to use RWATs less frequently. Experienced bureaucrats have been exposed for a longer time to models of professional practice that have not included the use of these relatively new tools. They therefore will be less open to learning about tools. Two arguments support this claim.
First, over time, bureaucrats develop standard operating procedures and heuristics that facilitate task execution (Jones Reference Jones2002). These practices can be quite persistent (e.g. Berglund et al. Reference Berglund, Gange and van Waarden2006). The cognitive shifts necessary for a bureaucrat to revise his mental models can be difficult, particularly when the shifts involve a bureaucrat’s “secondary beliefs” (Sabatier and Weible Reference Sabatier and Wieble2007), established notions about the mechanisms best suited to advancing the bureaucrat’s policy goals. A bureaucrat whose institutionalised repertoire of regulatory practices and beliefs does not include the use of RWATs may not be open to learning about these tools.
Second, more experienced bureaucrats may be less likely to use tools, because these individuals may be more likely to rely on best professional judgement (BPJ) when making regulatory choices. BPJ encompasses the explicit and tacit knowledge bureaucrats gain through years of regulatory work. It is unique to the individual and explicitly recognised in the wetland policy community as legitimate grounds for decision-making. RWATs arguably are substitutes for BPJ because they codify and formalise otherwise amorphous expert knowledge.Footnote 8
The more experienced a bureaucrat becomes, the more his BPJ develops. A wetland bureaucrat is familiar with his own BPJ, but he may know less about the data informing an RWAT or the assumptions built into it. Experienced bureaucrats thus may be more comfortable using their BPJ in regulatory decisions. These arguments lead to this article’s first hypothesis:
H1: State bureaucrats with more relevant job experience will be less likely to use RWATs.
In the statistical analysis, the job experience variable is the sum of the years survey respondents reported working in wetland regulatory jobs multiplied by the percentage of time (per job) they reported devoting to wetland activities.
Learning pathway 2: structured knowledge acquisition
The next hypothesis postulates that bureaucrats who more regularly participate in training events such as workshops and conferences will be more likely to use RWATs. The more training bureaucrats receive, the more frequently they are exposed to management best practices and thus are more likely to hear about assessment tools.
While intended to be accessible, RWATs can be somewhat complex. Officials who gain information about them in structured learning environments may be more likely to use them than bureaucrats lacking similar experiences.
H2: The more training events state bureaucrats attend, the more likely they will be to use RWATs.
The annual training variable used in the statistical analysis indicates the average number of training events a respondent attended per year during his tenure in wetland regulation. Because more experienced bureaucrats are likely to have attended more training events in absolute terms, respondents were asked about their average annual attendance. These events encompass all opportunities for structured learning about wetland management, not just assessment-focused training activities.
Learning pathway 3: interpersonal ties
When a bureaucrat is connected via her policy network to individuals who know about RWATs, the bureaucrat is more likely to learn about these tools and how to use them. A policy network is composed of linkages, nodes and a setting variable. The nodes in this investigation are policy actors; the linkages are their relationships. Nodes form linkages to obtain resources (Benson Reference Benson1982). The setting variable is the substantive issue area – in this case, wetland policy – that affects and is affected by activities in the network (Benson Reference Benson1982).
Network linkages help bureaucrats gain policy-relevant information. Bureaucrats rely on other officials and experts in the private and public sectors for data to inform science-based policies (May Reference May1992; Kerwin Reference Kerwin1994). Bureaucrats use networks to learn what other units of government are doing to address policy problems and may model their own policies accordingly (Bennett and Howlett Reference Bennett and Howlett1992; Mintrom Reference Mintrom1997). Network connectedness appears to facilitate uptake of policy innovations. Lubell and Fulton (Reference Lubell and Fulton2008), for example, found that California orchard growers were more likely to adopt environmental management best practices when their interactions with staff at local environmental agencies and non-profits were more frequent and numerous, and Mintrom and Vergari (Reference Mintrom and Vergari1998) demonstrated that policy entrepreneurs who leveraged support from policy networks were more likely to get states to adopt school choice reforms.
This article uses an “ego network” analytical approach (Wasserman and Faust Reference Wasserman and Faust1994). Ego networks consist of an ego (here, a bureaucrat responding to a survey) and alters (other actors) with whom the ego has linkages. This approach yields data about the ego’s relationships, but is limited in that egos typically are asked to describe a relatively small number of linkages and alters (Wasserman and Faust Reference Wasserman and Faust1994). This investigation asked respondents to describe ties with four alters upon whom respondents depend most for advice about wetland regulatory policy and to indicate if they had five or more such ties. Respondents were then asked whether they talked with each alter about assessment tools.
Among the surveyed bureaucrats, approximately 52% had policy networks composed entirely of other state bureaucrats. Scientists were the only alters for 12.5% of respondents. The remaining 35.5% of respondents had policy networks that contained other actors, such as federal regulators or private-sector environmental consultants, or that contained a mix of state bureaucrats, scientists and other actors. Ten respondents had no alters, the modal number was “1”, and five respondents had five or more alters.Footnote 9
One might assume that the tool-related attitudes of alters would influence a bureaucrat’s tool use. For example, if a bureaucrat learned about a tool from someone who disliked it, the bureaucrat could be less likely to use the tool. This analysis does not explore the valence of network communication about tools. However, this aspect of communication may not substantially influence tool use. Because RWATs are relatively new to many state bureaucrats, these officials may perceive substantial ambiguity about tool use and be more concerned with obtaining models of practice than with usage outcomes (see Honig Reference Honig2006). The relative newness of tools to states also may mean that many policy actors do not yet have strong opinions about tool utility. Accordingly:
H3: Bureaucrats whose wetland policy networks contain individuals who provide information about wetland assessment will be more likely to use RWATs.
The network communication binary variable indicates whether a respondent reported discussing RWATs with one or more alters. While some other network analyses (e.g. Lubell and Fulton Reference Lubell and Fulton2008) use more nuanced network metrics, such as a respondent’s number of network ties, this analysis intentionally uses a simpler measure. Although data were collected on number of ties, tie strength and interaction duration, the resulting variables could reasonably be suspected of suffering from significant measurement error. The relevant questions had substantial levels of non-response, likely because respondents were asked to recall specific dates and details about past relationships. Survey scholarship suggests that respondents’ abilities to recall such minutiae accurately is highly limited and error prone (e.g. Lavrakas Reference Lavrakas2008). A variable indicating whether a bureaucrat had at least one assessment-informative network tie during the study period appeared most likely to be robust to measurement error potentially caused by respondent recall problems.
Methods
RWAT adoption is explored using data from an original survey of individuals employed at some point between 1995 and 2011 as state wetland bureaucrats (n=149) in Delaware, Maryland, Ohio, Pennsylvania, Virginia and West Virginia. Survey text excerpts and a more complete discussion of survey methods are available in the Online Appendix.
States were selected based on a “most likely” case analysis (George and Bennett Reference George and Bennett2005, 121). The wetland policy community considers many of the selected states to have some of the most advanced wetland assessment initiatives nationwide.Footnote 10 Several of the states are home to public research institutions nationally known for wetland research and work on assessment (e.g. Riparia at Pennsylvania State University) and whose scientists work with state policy actors. Regulatory tool adoption should be more likely in these states than elsewhere, and if adoption does not occur, the reasons why should be particularly informative. The conclusion discusses the extent to which the findings based on these cases can be expected to generalise to other states.
Individuals were eligible for the survey if, during the study period, they had a job where state wetland regulation was one of their main tasks or they participated in one or more projects involving state wetland regulations. This inclusive selection criteria was important, because officials in a state’s primary environmental regulatory agency are not the only state bureaucrats who may use RWATs in activities connected to regulation (Bartoldus Reference Bartoldus1999; Kusler Reference Kusler2006). However, this inclusiveness created three problems that made defining a sampling frame via conventional means impractical.
First, eligible respondents could be or have been employed in a variety of state agencies and positions, with job titles not necessarily indicating whether they were involved in wetland regulation. Second, two individuals could share the same title and work in the same agency, but only one might do wetland regulatory work. Third, individuals who worked in state wetland regulation at some point since 1995 might not have been working in the same job when the survey was administered.
These problems were addressed in three ways. First, with input from regional EPA officials and 98 regional policy actors interviewed for a separate phase of this investigation (58 interview hours), an eligibility screening protocol was created. The protocol listed the state agencies, units and positions where street-level wetland bureaucrats might be located. All protocol revisions occurred before surveying began.
Second, probabilistic sampling was rejected in favour of approximating a population sample. The sample was constructed by querying interviewees and EPA staff about the identities of state field-level bureaucrats and comprehensively searching secondary sources. This search, and the search for ways to contact potentially eligible respondents, took six months.Footnote 11
Third, comprehensiveness was prioritised over efficiency in sample construction. A large number of potentially eligible individuals were identified by the screening protocol. Unquestionably, some ineligible individuals were surveyed. The survey had an initial screening question that funnelled out respondents not involved in wetland regulation in the target states and/or study period. These screen-outs allowed the calculation of proportional allocation-estimated outcome rates.
The survey was online and respondents were invited to respond using e-mail and postal invitations. The search for respondent contact information prioritised e-mail addresses; when e-mail addresses could not be located or bounced, postal addresses were sought. The survey was administered in per-state waves between February and April 2011. Potential respondents had roughly one month to complete the survey. Individuals targeted via e-mail were sent two reminders; recipients of postal invitations received only one because of budget constraints. No incentives were provided for participation.
Potential respondents were told that, in pre-tests (of EPA wetland regulators and graduate students), the survey took about 30 minutes. The survey focused on five main themes: bureaucrats’ experience with RWATs; other approaches bureaucrats might use to evaluate wetlands (e.g. BPJ); bureaucrats’ policy networks; whether and/or how bureaucrats had been involved in shaping assessment tools; and bureaucrat demographics.
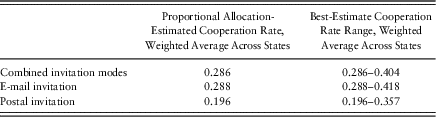
Table 1 summarises survey outcome rates calculated using the best practices described by the American Association for Public Opinion Research (2011) and Lavrakas (Reference Lavrakas2008).
Survey outcome rate summary statistics

Note: The proportional allocation-estimated rate was calculated by assuming the proportion of respondents who screened themselves out of the survey owing to ineligibility equals the proportion of ineligible non-respondents (Lavrakas Reference Lavrakas2008). This rate is conservative, because ineligibility probably was higher among non-respondents than respondents (Lavrakas Reference Lavrakas2008; Smith Reference Smith2009). The maximum of the rate range was calculated by dividing the number of eligible respondents by the full sample minus sample members of unknown eligibility and assuming that all non-respondents were ineligible. This approach likely inflates the outcome rate because at least some non-respondents probably were eligible (Lavrakas Reference Lavrakas2008; Smith Reference Smith2009). Response rates were weighted according to the state’s representation among survey returns and then averaged.
The proportional allocation-estimated cooperation rate for the combined modes is somewhat below the 34% mean response rate for online surveys reported by Shih and Fan (Reference Shih and Fan2008). Sheehan’s (Reference Sheehan2001) review of 13 online surveys administered from 1998 to 1999 calculated a slightly more comparable average response rate of roughly 31%. However, the true cooperation rate in this investigation likely falls within the best-estimate range; it may be as high as or higher than averages reported in the literature.
The number of survey returns as a proportion of survey contacts was fairly comparable across states: Delaware 24.5%, Maryland 31.3%, Ohio 34.6%, Pennsylvania 28.6%, Virginia 24.8% and West Virginia 24.3%. Further analysis of non-response bias was made difficult by the anonymity promised respondents and the sometimes limited information available about sample members.Footnote 12
Thirteen per cent of survey respondents had worked in more than one wetland regulatory position. Sixty-eight per cent had experience in wetland permitting, 47% in compensatory mitigation and 40% in enforcing wetland regulations (categories were not mutually exclusive). Roughly 48% had a bachelor’s degree or bachelor’s degree plus some graduate training; approximately 50% had a master’s degree or a higher level of education. About 20% said their schooling did not prepare them for wetland regulatory work, while roughly 61% said it somewhat prepared them and 19% said their schooling substantially prepared them for work in wetland regulation.
Data analysis
Preliminary data exploration
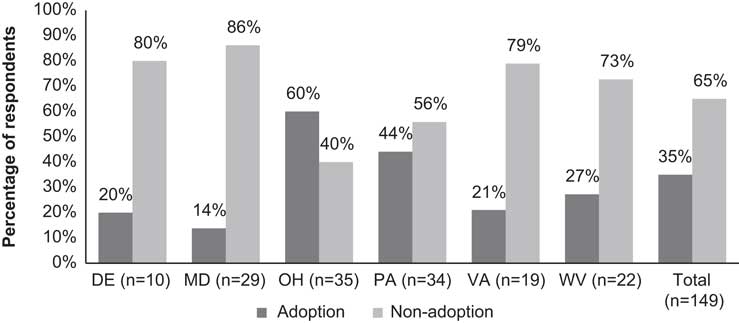
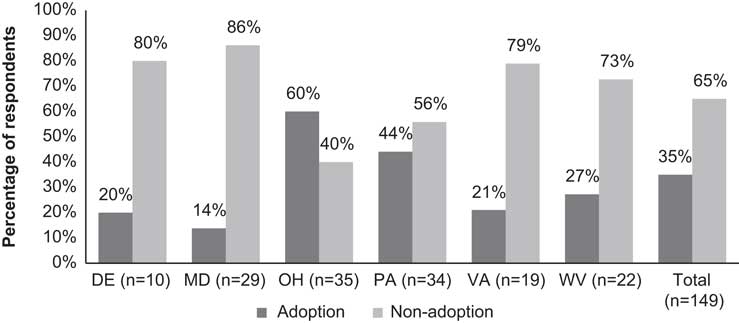
The survey directly asked street-level wetland bureaucrats whether they had used an RWAT at some point since 1995. Approximately 27% had never heard of RWATs, suggesting a gap in policy learning.Footnote 13 Roughly 35% of respondents reported tool usage. Among the approximately 38% who had heard of the tools but had not used them, the most frequently cited reasons for non-use were that bureaucrats did not know enough about the tools (58% of this group) and that no one else in their agency used such tools for regulatory activities – that is, they lacked models of professional practice (36%). These findings also suggest that lack of tool use may be a failure of learning.
Logistic regression
The hypotheses were evaluated using logistic regression. Three model specifications addressed potential interstate differences in administrative, political and social contexts, which, by affecting bureaucrats’ regulatory options and scope for discretion, could affect RWAT adoption. The first specification, presented in Table 3, uses variables (described below) specifically constructed to capture key interstate differences. The second specification used state dummies in place of state tool adoption progress, state regulatory structure and state wetland abundance. The third specification involved a multi-level approach that added a state-level random effect to Model B in Table 3. In both the second and third specifications, the signs and significance levels for the coefficients of primary interest were not different from those in Model B. In the multi-level model, the covariance parameter for the random effect was tiny (2.99e-13), and a likelihood ratio test that the random effect was equal to 0 indicated that the null hypothesis could not be rejected: χ 2(5)=9.8e-13; p<1.000. Because the results were highly consistent across all three specifications, only the first is presented in full.
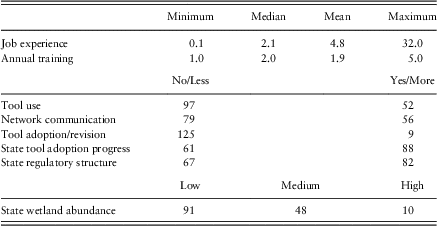
Descriptive statistics for the variables used in the regressions are provided in Table 2. The dependent variable tool adoption indicates whether a bureaucrat reported using an RWAT in state-level wetland regulation at some point since 1995. Tool adoption and non-adoption by state is depicted in Figure 1.Footnote 14
Tool adoption and non-adoption by state. Note: Bars indicate the number of survey respondents in a given state who adopted or did not adopt a tool, divided by the total n for that state and multiplied by 100 to yield a percentage.
Descriptive statistics
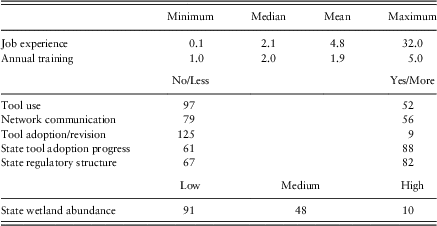
Note: Median and mean values are not available for the binary variables tool use, network communication, tool adoption/revision, state tool adoption progress and state regulatory structure. For those variables, “No/Less” indicates the n taking 0, and “Yes/More” the n taking 1. For the ordinal variable state wetland abundance, the table entries are the n falling into the specified categories.
The survey’s tool usage question was prefaced by the amended RWAT definition of Fennessy et al. (Reference Fennessy, Jacobs and Kentula2004), a statement emphasising the survey’s focus on formal, codified tools rather than BPJ, three examples of RWATs that had been used in the region during the study period and three examples of regulatory applications in which respondents might have used tools.
The variables described below were used as controls. The first, the binary tool adoption/revision, indicates whether a respondent reported participating in efforts to get her state to adopt a tool into official policy or to revise a tool. Respondents with in-depth involvement in shaping RWATs are probably more likely to use them. The three variables described next were developed using data from secondary sources and interviews with regional wetland policy actors and are meant to capture interstate differences relevant to bureaucratic tool adoption.
State tool adoption progress is a binary variable indicating how close state environmental agencies had come to integrating an RWAT into official regulatory policy by the end of 2011. Its coefficient is expected to be positive, because the variable captures the impact of communication and models of professional practice transmitted to a street-level bureaucrat vertically from his administrative hierarchy. A bureaucrat may learn about tools from his professional network, but he also likely looks to his superiors for such information (Rogers Reference Rogers1995) and for cues about behaviours the bureaucratic organisation deems appropriate (March and Olsen Reference March and Olsen1984).
Maryland, Delaware and West Virginia were grouped as states making less progress. By the end of the study period, officials in Maryland had not had meaningful discussions about adopting a specific RWAT. Delaware officials had tentatively committed to adopting a specific tool but had made minimal further progress towards regulatory adoption. West Virginia had just developed and was starting to field-test a tool. The group making more progress included Pennsylvania and Virginia, both of which were in the latter stages of piloting and making final modifications to specific RWATs, and Ohio, which in 2002 officially adopted a tool for some regulatory activities.
State regulatory structure, also a binary variable, was evaluated. This is because bureaucrats in states with more layers of wetland protections may be less likely to use RWATs, since they have multiple other mechanisms to support their regulatory practice. Bureaucrats in states with fewer formal regulatory mechanisms may be more likely to seek instruments to help them manage wetlands. These expectations suggest that the coefficient on this variable should be negative.
Maryland, Pennsylvania and Virginia are grouped as more rigorous regulatory regimes, because they have fairly comprehensive state non-tidal wetland laws that complement federal Clean Water Act protections; the states also partner with federal agencies to regulate wetlands (ELI 2008). Delaware, West Virginia and Ohio are considered less rigorous regimes, because they do not engage in such partnerships and primarily regulate wetlands via Clean Water Act Section 401 (which states in the first group also employ). Ohio protects a subset of wetlands not covered by federal law but otherwise does not independently regulate wetlands except via Section 401 (ELI 2008).
State wetland abundance is a three-level ordinal variable that indicates whether a state has a high, medium or low ratio of non-tidal wetland area to total land area. Delaware (18.00) is in the top tier, while Maryland (5.55) and Virginia (3.55) are grouped in the middle and Ohio (1.53), Pennsylvania (1.39) and West Virginia (0.67) constitute the bottom tier. In states with less wetland abundance, bureaucrats may be more likely to adopt tools, because their organisations impress on them the priority of preventing further wetland losses, and bureaucrats perceive that RWATs can help achieve this goal. This logic suggests a negative coefficient.
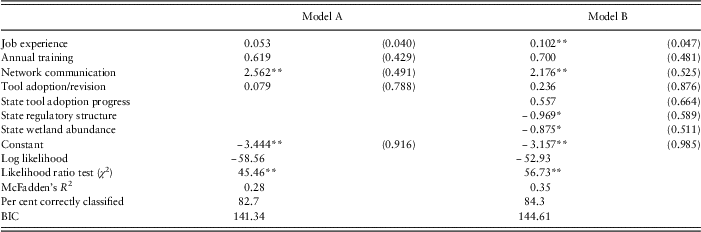
Table 3 reports Model A, the base specification, and Model B, which includes the three interstate control variables. The interstate control variables appear to improve the model fit, and a Wald test indicates that the null hypothesis that they are collectively equal to 0 can be rejected, χ 2(3)=9.87, p<0.020.
Logistic regressions explaining tool adoption
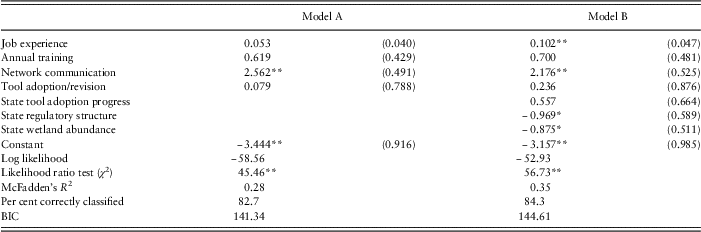
Note: Table entries are unstandardised parameter estimates. Two-tailed z-tests evaluate the null hypothesis that parameters=0: **p⩽0.05, *p⩽0.10. N=127 due to missing data and listwise deletion. Standard errors appear in parentheses.
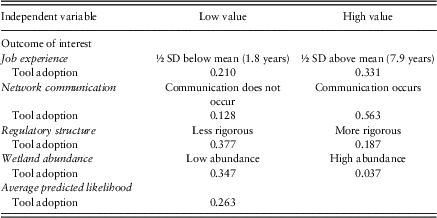
The regression analysis does not support Hypothesis 1. The positive, statistically significant coefficient on job experience suggests that more experience increases rather than decreases a bureaucrat’s tool adoption likelihood. The coefficient on training is positive, as anticipated by Hypothesis 2, but does not reach the p⩽0.10 threshold for statistical significance. Gaining assessment information from network contacts appears to explain tool usage significantly, supporting Hypothesis 3.Footnote 15 The signs on the interstate control coefficients are as anticipated and statistically significant for two of the three. The predicted likelihood of tool adoption can be computed using Model B’s estimates (Table 4).
Predicted likelihoods of a bureaucrat adopting a rapid wetland assessment tool
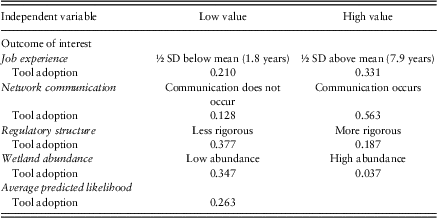
Note: Table entries are the predicted likelihoods of tool adoption given specified settings of the independent variables, calculated from Model B. All other variables were held at their means. The average predicted likelihood estimates the tool adoption propensity of a bureaucrat who takes all average values on the independent variables.
Discussion
This article argues that, when a street-level wetland bureaucrat learns about RWATs, he or she is more likely to use such tools. Learning or a lack thereof was posited to occur via the pathways of job experience, structured knowledge acquisition and interpersonal ties. The analysis generally supports this argument.
Given that so little has been known empirically about whether and when state bureaucrats use RWATs for regulatory work, these findings are meaningful for practitioners. This article contributes to an under-theorised area in political science research on the adoption of policy innovations by focusing on this phenomenon as it involves street-level bureaucrats. It also enhances our understanding of the typically opaque incentives and constraints that shape the policy innovation adoption choices of implementing officials.
The unsupported Hypothesis 1 was built on the assumption that experienced bureaucrats would hew to traditional evaluative approaches. However, those standard operating procedures may be less compelling than the likelihood that experienced bureaucrats have substantial knowledge of the state of wetland science and associated best practices and thus are more likely to use RWATs. Also, while more experienced bureaucrats were expected to use BPJ more frequently, survey data suggests that use of BPJ actually does not significantly correlate with level of job experience: rpb(144)=0.043, p<0.608 (point-biserial correlation).
More experienced bureaucrats could be more likely to use RWATs merely because they have had more time over which to do so. Fisher’s exact test was used to evaluate the relationship between job experience and the likelihood that a bureaucrat stops using an RWAT. If mere tool exposure is the primary reason why more experienced bureaucrats are more apt to use tools, they should also have had more opportunities to stop using these tools if they find them unhelpful; less experienced bureaucrats should have fewer such opportunities. If more experienced bureaucrats stop using RWAT at higher rates, their greater use may be owing to time rather than to a recognition of RWAT utility. However, the test statistic, p<0.165, does not reach the threshold for statistical significance; the null hypothesis of no difference in stoppage rates cannot be rejected.
Although the coefficient on annual training did not reach the threshold for statistical significance, its positive sign was anticipated by Hypothesis 2. In a larger sample or one including bureaucrats from “less likely” states (see below), this coefficient might reach significance. Attending roughly two training events per year (the sample’s modal number) may less powerfully affect innovation adoption than on-the-job experience or communication about the innovation via network ties. It also may be that the impact of training is partly an artefact of the variable’s association with the two other primary variables of interest, with which it is weakly but significantly correlated.Footnote 16
It should be noted that the analysis treated all training events as equivalent opportunities to learn about management best practices that could include RWAT use. This approach is justified by the fact that these training events often are omnibus affairs, such as annual enforcement workshops that cover a range of practices and innovations. Given the large number of topics packed into such events, the likelihood of a bureaucrat accurately recalling whether assessment was covered at an event seemed less plausible than, for example, the likelihood of a bureaucrat recalling whether he or she personally talked about assessment with someone upon whom he or she regularly relied for professional advice. Nonetheless, if this variable could be refined to consider only training events that definitely addressed assessment, it might have more explanatory power.
The analysis supports Hypothesis 3; tool use appears more likely when the individuals upon whom officials rely most frequently for wetland regulatory advice – members of their policy networks – convey assessment information to them. For street-level bureaucrats, peer communication appears to be an important pathway for learning about science policy innovations.
The progress a state has made towards adopting an assessment tool into official policy – a vertical learning pathway for front-line officials – had the expected sign (greater progress, greater use likelihood), but the relationship did not reach the significance threshold. Regulatory structure was marginally significant and also had the expected sign, that is, when fewer formal regulatory mechanisms for wetland management exist, bureaucrats appear more likely to seize the assistance offered by RWATs. Wetland abundance was also statistically significant. In less wetland-abundant states, bureaucrats may be less likely to treat decisions that might affect net loss of wetland functions and values casually and more likely to use tools to help ensure those decisions are rigorous. The opposite dynamic appears in states where wetlands are more abundant. This finding should be treated with caution, however, since the variation in the relevant data is limited.
Conclusion
This investigation examined factors affecting whether state wetland bureaucrats adopt wetland assessment tools for regulatory use. Its findings support the argument that, when bureaucrats have more opportunities to learn tool-related information and practice norms, they are more likely to adopt tools. Learning is achieved via job experience and peer communication through network ties and is incentivised by certain institutional contexts.
This article began by arguing that policy adoption scholarship needs to be more attentive to the role of street-level bureaucrats who adopt and shape policy through their workday choices. Its hypotheses concerned the processes by which bureaucrats might learn about policy innovations. Such processes are analysed in the more general literature on individual-level innovation diffusion (e.g. Rogers Reference Rogers1995). The support this analysis offers for the importance of learning pathways suggest that the innovation diffusion literature should be more closely integrated with policy adoption scholarship.
The specific applicability of the individual-focused innovation diffusion scholarship to street-level bureaucrats warrants attention. Valente’s (Reference Valente1993) classic work on innovation diffusion showed that farmers, doctors and members of the general public learn about innovations in very different ways. Street-level bureaucrats share distinct characteristics – substantive expertise, substantial discretion and institutionally and resource-constrained behaviours, among others, which suggests that they, too, may experience diffusion processes differently. Yet, peering inside opaque bureaucratic organisations to understand the incentives and constraints that shape the behaviours of implementing officials is difficult. As a result, we do not know enough about when and why such officials adopt science policy or other types of innovations. As Rogers (Reference Rogers1995, 365) noted, “our understanding of decentralized diffusion systems is still limited owing to the general lack of investigation of such user-dominated diffusion”. This article squarely tackles that limitation.
While these findings are based on a “most likely” case analysis, network communication and training may be even more important learning pathways in less likely cases. Many of the states studied here have prominent public wetland research institutions that pursue outreach to citizens and the public sector. The geographic proximity of these states to the EPA’s national headquarters arguably makes state officials more likely to encounter EPA science and policy products and guidance. Information about RWATs in these states may be conceptualised as relatively “free floating”; a bureaucrat may gain it from her network peers, but she may also simply come upon it in daily work, as evidenced by the statistical significance of job experience. However, in states where sources and saturation of assessment tool expertise are more limited, a bureaucrat may be less likely to merely stumble upon relevant information. Instead, the only way she may learn about an RWAT and thus become more likely to adopt it is if she communicates with knowledgeable peers or attends relevant training. Although probably less important, job experience may still be consequential in “less likely” states to the extent that, the more time a wetland bureaucrat spends on the job, the more likely she might be to encounter whatever meagre “free floating” pockets of innovation-relevant information do exist. These suppositions merit empirical testing.
This investigation should be viewed as a starting point for future research. Its analysis was cross-sectional, whereas much research on innovation diffusion is longitudinal. A time-series approach would allow the informative analysis of factors affecting the rate at which street-level officials adopt science policy innovations such as RWATs. Future research focusing more specifically on street-level diffusion processes should examine the frequency with which and reasons why bureaucrats choose to use RWATs versus employing other evaluative approaches, as well explore factors that determine whether a bureaucrat continues or ceases to use a tool.
Other inquiries might add explanatory power to the model. While Honig’s (Reference Honig2006) argument – that street-level officials may adopt policy innovations because they view such behaviour as an appropriate professional practice, and not necessarily because they attend to the success of innovations – is to some degree always plausible, such behaviour may be more likely when the innovation is newer. Over time, evaluations of the quality of the innovation may become more common and more widely known. A bureaucrat’s likelihood of adoption may increasingly depend not only on having informative network ties, but on receiving innovation-supportive information via those ties. In this research, nearly 30% of survey respondents had not heard of RWATs. Among those who had heard of them but had not used them, nearly 60% said they lacked sufficient information about these tools. These statistics undergird this article’s argument that RWATs are still relatively new to state officials. However, to the extent that some state officials and their network peers have formed opinions about RWATs, attending to the valence of tool-related communication may help more thoroughly explain adoption.
Specific attributes of science policy innovations may also help explain street-level adoption patterns. In this article, RWATs were considered as one class because they met common definitional standards. However, within those parameters, some tools may be more or less rapid, more or less comprehensive and more or less suited to different regulatory tasks, among other characteristics. The exclusion of these attributes from the regressions in the “Data analysis” section should not bias the parameter estimates if the attributes are uncorrelated with the independent variables, and this lack of correlation is substantively reasonable.Footnote 17 However, to the extent that such factors affect tool adoption, they are currently accounted for only in the regression error terms. Elucidating and testing the impact of these factors could improve the analysis.
Additional research would be useful to scholars and practitioners, but the need for such research should not undercut the importance of this investigation’s findings. Attending to the interpersonal ties, training opportunities, job experience and institutional contexts of street-level bureaucrats is critical to understanding the likelihood of these officials integrating discretionary science policy innovations into regulatory practice. It is crucial to remember, of course, that innovation is not inherently good. While experts generally agree that the application of RWATs to regulatory decision-making should improve resource outcomes, maladaptive innovations certainly exist. It is thus all the more important that policymakers understand the conditions under which science policy innovations, whether management enhancing or management hindering, are more likely to be taken up by bureaucrats operating in opaque, discretionary policy environments.
Acknowledgements
The author is grateful for excellent feedback provided by Forrest Fleischman, Rachel Fleishman, Rachel Krefetz Fyall, Michael McGinnis, Le Anh Nguyen, Lin Ostrom, Travis Selmier, Luke Shimek, Sergio Tomás Villamayor, Zach Wendling and the anonymous reviewers and journal editorial staff. This work would have been impossible without the assistance and generous mentoring of wetland regulatory staff at the US Environmental Protection Agency, Region 3.
Financial Support
This paper is based on work developed under a STAR Fellowship Assistance Agreement (FP-91708801-1) awarded by the US EPA. The paper has not been reviewed by the EPA. The views expressed in this paper are solely those of the authors, and the EPA does not endorse any products or commercial services mentioned in this paper.