I. INTRODUCTION
In recent years advances have been made in the research and development of resistive random-access memory (ReRAM) that uses voltage-induced resistive change in transition metal oxides (TMOs) as memory media. ReRAM is a candidate for a substitution for Flash memory, which is facing a microfabrication limit in the near future. Furthermore, a development of a nonvolatile and high-density universal memory with fast switching and high switching endurance is expected in the future. However, the optimization of the performance and the establishment of reliability have been prevented by the fact that the switching mechanism of ReRAM has not yet been clarified. Therefore, the elucidation of the switching mechanism is urgently required.
ReRAM has a simple structure of a top electrode (TE)/TMO/a bottom electrode (BE). Memory effect develops after a forming process, and it becomes possible to cause a set, which is a resistive switching from a high resistance state (HRS) to a low resistance state (LRS), and a reset, which is a resistive switching from the LRS to the HRS, alternately. Here, the forming is a phenomenon, which is similar to a soft breakdown, and a conductive path called a filament is formed after it. Resistive switching is thought to take place in the filament.Reference Baek, Lee, Seo, Lee, Seo, Suh, Park, Park, Kim, Yoo, Chung and Moon1–Reference Gibbons and Beadle4 The reason why the elucidation of resistive switching mechanism is hindered is attributed to the difficulty in applying conventional analytical methods to the resistance switching region because the filament is covered with electrodes and the radius of the filament is very small.Reference Lee, Han, Jeon, Park, Kang, Ahn, Kim, Lee, Kim, Yoo, Seo, Li, Park, Lee and Park5, Reference Shima, Takano, Muramatsu, Yamazaki, Akinaga and Kogure6
Recently, it was demonstrated that both the LRS and the HRS can be written over an arbitrary area by applying direct-current (DC) bias voltage, V bias, directly to NiO films using conducting atomic force microscopy (C-AFM).Reference Yoshida, Kinoshita, Yamasaki and Sugiyama7, Reference Kinoshita, Okutani, Tanaka, Hinoki, Yazawa, Ohmi and Kishida8 The resistance writing region consists of the aggregation of filaments and can be regarded as one filament with a large radius. Therefore, this technique can provide the filament with an arbitrary radius without TE, which allows application of conventional analytical methods and might be a breakthrough for the switching mechanism elucidation.
In this paper, the LRS and the HRS with the large area of 20 × 20 μm2 were written in a NiO/Pt film by voltage application using C-AFM. Taking advantage of the large size of the target area, the writing regions were analyzed using scanning electron microscopy (SEM), electron microprobe (EPMA), and energy-dispersive x-ray spectroscopy (EDS) for the elucidation of a physical property of the filament.
II. EXPERIMENTAL
A 60 nm NiO film was deposited on a Pt(100 nm)/Ti(20 nm)/SiO2(100 nm)/Si(625 μm) substrate by using DC reactive magnetron sputtering at 380 °C in the mixture gas of Ar and O2 gases (Ar + O2 gas), and a NiO/Pt/Ti/SiO2 (NiO/Pt) structure was obtained. Here, the SiO2/Si structure was formed by thermal oxidation of Si wafer and a Ni metal with the purity of 99.99% was used as a sputtering target. During the deposition, the pressure of Ar + O2 gas was retained at 0.5 Pa (Ar: O2 = 0.45 Pa: 0.05 Pa).
For the C-AFM measurements, we used a commercial AFM (SPI3800N/SPA400, Seiko). A Rh-coated Si tip with the point diameter of 100 nm [SI-DF3-R(100 nm), Seiko] was grounded, and the V bias was applied to the BE. HRS or LRS was written in the central 20 × 20 μm2 area by scanning the tip under V bias of −7 V or +7 V, respectively. Subsequently, the 22 × 22 μm2 area containing the writing region was scanned with a sensing voltage of +1 V. The HRS was written with a negative bias, whereas LRS with a positive bias is reported in Ref. 7. The scanning frequency was 1 Hz, and the data density was 256 × 256. All the C-AFM measurements were performed in the atmosphere.
Analyses with EPMA and SEM on the regions where the HRS and the LRS were written were conducted. EDS mapping analysis on areas containing these writing regions were also performed.
III. RESULTS AND DISCUSSION
A. Resistance states written by using C-AFM
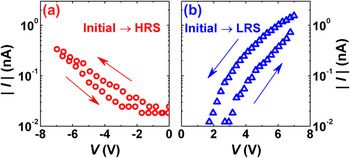
Figures 1(a) and 1(b) show current–voltage (I–V) characteristics of AFM-tip/NiO/Pt structures measured by positioning the tip at the arbitrary selected point, and applying V bias of +7 V and −7 V, respectively, where voltage steps were 7 mV and a hold time, a delay time, and a voltage sweep rate were 1 ms, 0 s, and 0.7 V/s, respectively. Here, NiO is in the initial state in both Figs. 1(a) and 1(b). It was confirmed that HRS was written by the application of negative V bias, whereas LRS was written by the application of positive V bias, which is consistent with Ref. 7. This effect is hard to interpret as an anodization of the NiO surface, which is caused by the electrolysis of water between the NiO surface and the AFM-tip,Reference Hsu, Lai, Lin, Chuang and Huang9 since reset occurs by applying a negative V bias to the bottom electrode, which is the opposite bias polarity needed for the anodization to occur.
I–V characteristics measured with C-AFM by application of V bias of (a) +7 V and (b) −7 V, respectively.

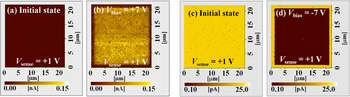
Figures 2(a) and 2(b) show current images before and after performing C-AFM writing under V bias of +7 V, respectively. On the other hand, Figs. 2(c) and 2(d) show current images before and after performing C-AFM writing under V bias of −7 V, respectively. All the current images shown in Figs. 2(a)–2(d) were measured with a scanning frequency of 1 Hz. The bright contrast regions in the current image correspond to the LRS and the dark contrast regions to the HRS. Averaged currents at the sensing voltage of 0.1 V for the initial state, HRS, and LRS were 12.1, 0.1, and 82.6 pA, respectively.
Current images (a) before and (b) after C-AFM writing by scanning under V bias of +7 V. Current images (c) before and (d) after C-AFM writing by scanning under V bias of −7 V.

B. SEM and EPMA analyses
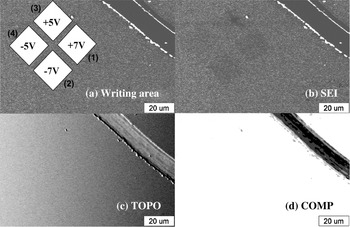
Figure 3(a) shows the locations of four 20 × 20 μm2 regions on the NiO film to which resistance states were written by using C-AFM. Resistance states of the regions (1), (2), (3), and (4) were written by scanning the AFM tip under V bias of +7 V, −7 V, +5 V, and −5 V, respectively. Regions (1) and (3) were written to the LRS, whereas regions (2) and (4) were written to the HRS. That is, the resistance decreased by application of positive bias, whereas increased by negative bias, as described previously. The scratch in the figure was introduced by a diamond-point pencil to support finding out the same place containing these regions by EPMA and SEM.
(a) Location of regions (1)–(4) written by scanning under V bias of +7, −7, +5, and −5 V using C-AFM, respectively. (b) SE, (c) TOPO, and (d) COMP images of the NiO film in which regions (1)–(4) are included.

Figures 3(b), 3(c), and 3(d) represent secondary electron (SE), composition (COMP), and topographic (TOPO) images of the NiO film containing all the regions (1)–(4), respectively. Here, COMP and TOPO images are obtained by a primary electron emission, which is sensitive to both the composition and surface morphology of the sample. Dark regions in Fig. 3(b), where a secondary electron yield is low compared with the other region, correspond to the regions (1)–(4), whereas no difference in the contrast from the surrounding region is observed in the corresponding region in Figs. 3(c) and 3(d). In addition, the writing region in the SE image becomes darker with increasing the amplitude of writing voltage.
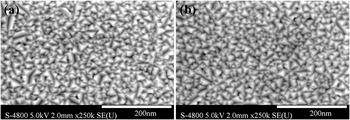
Figures 4(a) and 4(b) show SE images before and after C-AFM writing (not the same position). Tetrahedral grain structures are observed on the surface, showing the (111) orientation of the NiO film. No remarkable change in both sizes and shapes of NiO grains were observed. No damage caused by the writing current was also confirmed.
Secondary electron images before and after C-AFM writing under V bias of +7 V with a scanning frequency of 0.2 Hz.

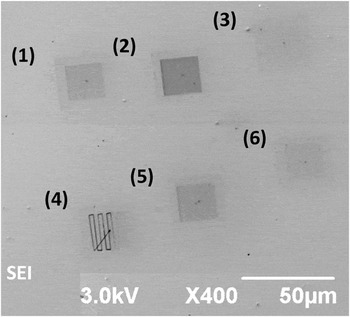
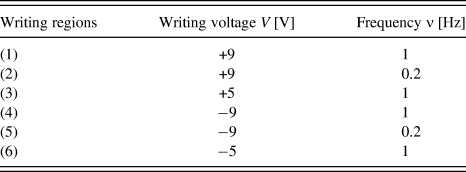
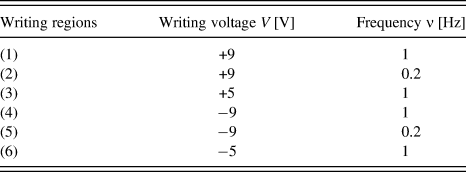
Figure 5 shows applied bias and scanning frequency dependences of a SE image for writing regions. In Fig. 5, regions (1)–(3) were written to the LRS and regions (4)–(6) were written to the HRS under the writing conditions shown in Table I. The higher the applied bias becomes and/or the lower the scanning frequency becomes, the darker the SE image of the writing regions becomes. Therefore, a darker SE image is obtained by applying V bias with larger amplitude for a longer duration to the unit area.
Secondary electron image after C-AFM writing for regions (1)–(6) under the conditions shown in Table I.

C. EDS mapping analysis
As possible main factors that cause the change in the contrast of a SE image by the application of V bias using C-AFM, the following three factors can be pointed out: (i) The change in the surface morphology has been caused. (ii) Removal/adhesion of contaminations from/to the surface of the NiO film has been caused. (iii) An intrinsic change in electronic state of NiO has been caused. Since no remarkable change in the surface morphology of the sample by the application of C-AFM writing was observed as shown in Fig. 4, which denied the factor (i), the possibility of the factor (ii) is discussed below.
Elements for which EDS mapping analysis were conducted were selected as follows. Hilleret et al. reported that secondary electron yield of an air exposed ZnO film decreased after annealing the film.Reference Hilleret, Scheuerlein and Taborelli10 This is due to a removal of airborne carbonaceous contamination layer formed on the surface of the sample by the annealing process. Analogously, also in the present study, the removal of carbonaceous contamination might be caused by Joule heating generated during C-AFM writing. Therefore, C was selected as a mapping element. In addition, Rh with which the AFM tip is coated might adhere to the scanned area. By adding the constituent elements of the sample to C and Rh, EDS mapping analyses were performed on C, Rh, Ni, O, and Pt.
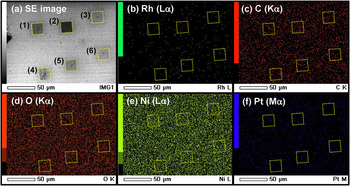
Figure 6(a), which is the same figure as Fig. 5, shows the SE image after the C-AFM writing. The square regions surrounded by dotted lines correspond to the writing regions that were written under the conditions shown in Table I. Figures 6(b)–6(f) show results of EDS mapping measurements for Rh, C, O, Ni, and Pt, respectively. Here, the square regions surrounded by dotted lines in Figs. 6(b)–6(f) correspond to the writing regions in Fig. 6(a), respectively. The acceleration voltage was 3.0 kV. Energies of C Kα, O Kα, Ni Lα, Pt Mα, and Rh Lα lines are 0.277, 0.525, 0.851, 2.050, and 2.696 eV, respectively.

No difference of the intensity distribution in the EDS mappings between inside and outside of the writing regions was observed for all the mapped elements, suggesting the exclusion of the factor (ii). Therefore, as a reason why the SE image becomes dark by the voltage application, it was suggested that the change in the electric conductivity of NiO affected the secondary electron yield.
It has been widely received that the resistance change effect observed in transition metal oxides is caused by the migration of oxygen ions,Reference Kim, Choi and Hwang2, Reference Yoshida, Kinoshita, Yamasaki and Sugiyama7, Reference Nian, Strozier, Wu, Chen and Ignatiev11 which introduces or repairs oxygen vacancies depending on the applied bias condition. It has also been received that the LRS is formed by ranging vacancies through the film, which is the so-called filament, whereas HRS is formed by repairing the vacancies only near the electrode interface.Reference Kim, Choi and Hwang2, Reference Kinoshita, Tamura, Aoki, Sugiyama and Tanaka12, Reference Inoue, Yasuda, Akinaga and Takagi13 This means that conductive filaments other than the neighborhood of the electrode interface remain without being repaired even in the HRS. Therefore, this is consistent with the fact that the writing region becomes dark whether it is in the HRS or the LRS in the SE image, assuming that a conductive region becomes dark in the SE image. Shima et al. performed Kelvin probe force microscopy and micro x-ray photoelectron spectroscopy measurements on the LRS of a CoO film that was written by the voltage application using C-AFM.Reference Shima, Takano, Muramatsu, Yamazaki, Akinaga and Kogure6 They reported that Fermi energy in CoO is pushed up because of reduction of CoO that causes defect-related energy levels in the band gap. Since it was reported that low secondary electron yield was related to a low work function,Reference Kudo, Sakai and Ichinokawa14 our result also suggests that the C-AFM writing decreases a work function, which is consistent with Ref. 6. However, in Ref. 6, since a writing region is optically unidentifiable, the region excluding the region for which C-AFM writing will be performed is etched by using the photolithography to narrow down the writing region from the whole region to analyze the writing region by XPS. Therefore, it is worth noting that we obtained the result similar to that reported in Ref. 6 without the influence of the photolithography on the analyzed area of the sample.
IV. CONCLUSIONS
SEM and EPMA analyses on the C-AFM writing region revealed that the writing regions are distinguishable as dark areas in SE images. This enables one to specify the writing region without using complicated sample fabrication process to narrow down the writing regions such as the photolithography technique. In addition, EDS mapping analysis on the writing region suggested that the observed change in the contrast of the SE image is related to the intrinsic change in the electronic state of the NiO film, i.e., that the secondary electron yield is correlated to the physical properties of the film.
ACKNOWLEDGMENT
The authors thank H. Tanaka and H. Kasada for their experimental support.