1. Introduction
The population of language users referred to as heritage speakers is increasingly being recognized as a unique source of insight into knowledge of language. Heritage speakers are “people raised in a home where one language is spoken who subsequently switch to another dominant language” (Polinsky & Kagan, Reference Polinsky and Kagan2007, p. 368). Such individuals are common among second-generation immigrants; however, they pose challenges for traditional linguistic scholarship – as well as for curriculum development (Campbell & Rosenthal, Reference Campbell, Rosenthal and Rosenthal2000; Valdés, Reference Valdés2005) – because they are not typical bilinguals: although they are normally fluent in the dominant language they acquired second (English in the case of the U.S.), they are usually markedly less proficient, and unevenly so, in the heritage language they started acquiring first. This pattern follows from incomplete acquisition and/or attrition of the heritage language, each of which is prone to occurring as a consequence of early immersion in the dominant language along with weaker input in the heritage language (Au & Oh, Reference Au, Oh, Lee, Simpson and Kim2009; Montrul, Reference Montrul2012). Heritage speakers thus fit neither into the model of a monolingual native speaker that is the basis of most linguistic research, nor into the model of a canonical (“balanced”) bilingual assumed in much of the psycholinguistic literature on bilingualism. As such, they represent fertile ground for investigations into linguistic behavior. A wave of recent research has, consequently, begun to focus specifically on heritage-language (HL) speakers and the ways in which they differ linguistically from typical native first-language (L1) speakers and from typical late second-language (L2) learners (e.g., Au, Knightly, Jun & Oh, Reference Au, Knightly, Jun and Oh2002; Au, Oh, Knightly, Jun & Romo, Reference Au, Oh, Knightly, Jun and Romo2008).
A recurring theme of the literature on HL speakers is the similarity between certain aspects of HL proficiency and patterns in L2 acquisition and L1 attrition (e.g., Montrul, Reference Montrul2004, Reference Montrul2008, Reference Montrul2012). Although the HL is technically the L1 for HL speakers, it is also the weaker language and is, therefore, associated with many of the same limitations as a late-acquired L2 (e.g., smaller expressive vocabulary, slower speech rate; Polinsky & Kagan, Reference Polinsky and Kagan2007). Limitations on attainment in late L2 acquisition are well documented in the literature on adult L2 learners (e.g., Flege, Reference Flege1995; Major, Reference Major2001), an abiding concern of which has been the analysis of cross-linguistic influence between the L1 and the L2. In particular, the negative consequences of L1 transfer in L2 learning have been the subject of many L2 studies (e.g., Broselow, Reference Broselow1984; Hecht & Mulford, Reference Hecht and Mulford1982; for a recent review, see Major, Reference Major, Hansen Edwards and Zampini2008). HL speakers are not typical L2 learners, but they are bilingual in the broadest sense of the term; consequently, effects of cross-linguistic transfer are likely to be evident in HL speakers as well. Nevertheless, research on HL speakers has not generally been concerned with questions regarding transfer for two reasons. On the one hand, the L1 of HL speakers (i.e., the HL) is the weaker language, not the stronger language as in typical L2 learners. On the other hand, because most research on HL speakers focuses on HL communities in the U.S. (where the dominant language, English, is frequently simpler than the HL in the linguistic domains examined, such as inflectional morphology), it is often unclear whether non-native-like patterns seen in HL speakers’ HL are due to L2 transfer from English specifically or to universal tendencies in acquisition (Polinsky & Kagan, Reference Polinsky and Kagan2007; see also Major, Reference Major2001).
The study reported in this article is an attempt to bridge the divide between the HL and L2 literatures in regard to the investigation of cross-linguistic influence. Given that HL speakers are one type of bilingual, the examination of their linguistic behavior is pertinent to the same research questions that have spurred much of the work on L1–L2 interaction in L2 learners, yet these questions remain largely unexamined with respect to HL speakers. In the current study, two related questions from the tradition of L2 speech research were examined in regard to HL speakers. First, do HL speakers perceive the HL like native speakers of the HL? Second, do HL speakers perceive the dominant language like native speakers of the dominant language? Existing empirical studies on HL speakers provide some conflicting results, although they show that HL speakers enjoy a range of linguistic advantages over late L2 learners.
1.1 Linguistic advantages for heritage speakers
Previous research on individuals with HL experience (including HL speakers; HL listeners or “overhearers”, who hear the HL regularly although they may not be addressed in it directly; and international adoptees) has aimed to characterize the intermediate kind of linguistic knowledge that results from HL experience. Two main findings have emerged from this literature: (i) even highly proficient HL speakers tend to differ from native speakers born and educated in the native speech community; (ii) HL experience nevertheless leads to advantages over L2 learners, albeit more reliably in phonological aspects than in morphosyntactic aspects of the HL.Footnote 1
The most obvious differences between HL speakers and native speakers typically occur in higher-level aspects of the language such as morphosyntax. For example, morphological leveling, regularization of exceptional forms and usage patterns, reduction of case marking and agreement, and divergent constraints on long-distance dependencies have all been documented in HL speakers of various languages (Kim, Montrul & Yoon, Reference Kim, Montrul and Yoon2009; Montrul, Reference Montrul2002; Montrul, Bhatt & Bhatia, Reference Montrul, Bhatt and Bhatia2012; Polinsky, Reference Polinsky2008). At the same time, HL experience results in a “head start” over L2 learners, such that learners with HL experience approximate native speakers more closely than L2 learners do, although this may not always be the case depending on the extent of the HL experience (Au & Romo, Reference Au, Romo and Chen1997; see Au et al., Reference Au, Oh, Knightly, Jun and Romo2008).
Whereas the morphosyntactic advantages shown by HL speakers seem to depend on HL experience that is more extensive than overhearing, phonological advantages have been found in HL groups with very little HL experience (e.g., Oh, Au & Jun, Reference Oh, Au and Jun2009, Reference Oh, Au and Jun2010). These advantages occur in both perception (Lee-Ellis, Reference Lee-Ellis2012; Lukyanchenko & Gor, Reference Lukyanchenko, Gor, Danis, Mesh and Sung2011; Tees & Werker, Reference Tees and Werker1984) and production (Au et al., Reference Au, Knightly, Jun and Oh2002; Chang, Haynes, Yao & Rhodes, Reference Chang, Haynes, Yao and Rhodes2009, Reference Chang, Haynes, Yao, Rhodes, Bane, Bueno, Grano, Grotberg and McNabb2010; Chang, Yao, Haynes & Rhodes, Reference Chang, Yao, Haynes and Rhodes2011), although production advantages appear to require a greater degree of HL experience (in particular, experience speaking) and are mediated by degree of cross-linguistic similarity (Godson, Reference Godson2003, Reference Godson2004) as well as sociocultural background variables such as identification with and participation in the target language community (Oh & Au, Reference Oh and Au2005). In the case of HL experience with Spanish, production advantages over L2 learners have been found even for individuals who merely overheard the HL in childhood (Au et al., Reference Au, Knightly, Jun and Oh2002; Knightly, Jun, Oh & Au, Reference Knightly, Jun, Oh and Au2003). In the case of HL experience with Korean, however, production advantages do not extend to childhood overhearers and occur only in individuals who also spoke the HL in childhood (Oh, Au & Jun, Reference Oh, Au, Jun, Skarabela, Fish and Do2002; Oh, Jun, Knightly & Au, Reference Oh, Jun, Knightly and Au2003).
The perceptual advantages resulting from HL experience are particularly compelling because they can be evident even after decades of separation from the initial HL experience and without extensive re-exposure to the HL. For example, English speakers with early exposure to Hindi but little formal instruction have been shown to be significantly better at discriminating the Hindi dental-retroflex place contrast than L2 learners with a year of formal study (Tees & Werker, Reference Tees and Werker1984). Convergent findings come from research on HL speakers of Russian, who outperform L2 learners at discrimination of Russian plain and palatalized consonants, often showing performance that is not significantly different from that of native Russian speakers (Lukyanchenko & Gor, Reference Lukyanchenko, Gor, Danis, Mesh and Sung2011). Findings on English speakers with early exposure to Korean are especially interesting because they demonstrate that a perceptual advantage can occur not only for childhood speakers and hearers raised in Korean families, but also for Korean adoptees raised in non-Korean families. In a lexical identification task contrasting the three Korean stop types, childhood speakers and hearers of Korean have both been shown to be more accurate than L2 learners (Oh et al., Reference Oh, Au, Jun, Skarabela, Fish and Do2002, Reference Oh, Jun, Knightly and Au2003). Furthermore, Korean adoptees with only minimal exposure to Korean after adoption to the U.S. (at one year of age on average) outperform L2 learners at discriminating Korean lenis and fortis stops from other stop types (Oh et al., Reference Oh, Au and Jun2009, Reference Oh, Au and Jun2010).
On the other hand, there is also evidence that the HL can undergo extreme attrition, resulting in no perceptual advantage being evident for individuals with early HL experience. Whereas Korean adoptees in the U.S. manifest a significant perceptual advantage over L2 learners, Korean adoptees in France have been found to pattern like L1 French speakers with no previous exposure to Korean (Pallier, Dehaene, Poline, LeBihan, Argenti, Dupoux & Mehler, Reference Pallier, Dehaene, Poline, LeBihan, Argenti, Dupoux and Mehler2003; Ventureyra & Pallier, Reference Ventureyra and Pallier2004; Ventureyra, Pallier & Yoo, Reference Ventureyra, Pallier and Yoo2004). In tasks involving language identification, word recognition, number series recognition, and discrimination of stop contrasts, Korean French adoptees fail to respond to Korean stimuli differently than L1 French speakers, and neuroimaging data further suggest that Korean is like an unfamiliar language to them. Taken together with the findings of Oh et al. (Reference Oh, Au and Jun2009, Reference Oh, Au and Jun2010), whose participants were engaged in relearning the HL at the time of study, the results of Pallier and colleagues suggest that substantial intermittent exposure or re-exposure to the HL may be necessary for the memory of early, but distant, HL experience to become accessible again.
Although studies on individuals with HL experience evince different patterns depending on the HL, the degree of HL experience, and the linguistic domain, what is consistent about this literature is an observation made by Lee-Ellis (Reference Lee-Ellis2012, p. 73): because researchers of bilingualism tend to be more interested in bilinguals’ ability in the weaker language, “previous studies on heritage speakers have examined only heritage language competence to the exclusion of the dominant language”. This bias in the literature seems to stem from an assumption that HL speakers, who often sound native-like in the dominant language, will pattern like native speakers in the dominant language; under this assumption, examination of HL speakers’ dominant language is not expected to reveal anything noteworthy. Such an assumption, however, is questionable, because an abundance of research in L2 acquisition has suggested that cross-linguistic influence in bilinguals – including L1 influence on the L2 – is closer to the rule than the exception.
1.2 First-language influence in second-language speech perception
Cross-linguistic interaction effects between the L1 and the L2 of bilinguals have been documented in virtually every domain of language, but perhaps nowhere are these kinds of effects more apparent than in speech perception. Much of the work in the area of non-native perception has been informed by the concept of transfer (Lado, Reference Lado1957; Odlin, Reference Odlin1989) – the idea that L2 learners do not develop an L2 system from scratch, but rather start off by carrying over what they already know from their L1 system. Phonological transfer can have varied effects depending on the alignment of properties of the L1 and the L2. Three general types have been identified in the literature: negative transfer, neutral transfer,Footnote 2 and beneficial transfer.
By far the most common type of transfer documented in the non-native speech perception literature, negative transfer has been found to result in relatively poor perceptual performance by L2 listeners across a range of listening conditions (Bradlow & Pisoni, Reference Bradlow and Pisoni1999; Cutler, Reference Cutler2001; Cutler, García Lecumberri & Cooke, Reference Cutler, Lecumberri and Cooke2008; García Lecumberri & Cooke, Reference García Lecumberri and Cooke2006; Nábělek & Donahue, Reference Nábělek and Donahue1984). This situation often arises when similar L1 and L2 sounds are in a few-to-many relationship, such that the L2 listener needs to make more perceptual distinctions in the L2 than are necessary in the L1. When L2 sounds are similar to the same L1 sound, they are typically very difficult for non-native listeners to discriminate (Best, Reference Best, Goodman and Nusbaum1994, Reference Best1995; Best & Tyler, Reference Best, Tyler, Bohn and Munro2007), since part of being a competent perceiver of one's L1 is knowing how to abstract away from acoustic variability and classify certain sounds as equivalent for functional purposes. The “equivalence classification” (Flege, Reference Flege1987, Reference Flege1995) of similar sounds is thus a process that must be inhibited in the L2 when distinct L2 sounds would normally be classified as equivalent in the L1, and this can lead to considerable perceptual difficulties. For example, L1 Japanese learners of English have repeatedly been shown to have trouble with perceiving the English lateral-rhotic contrast (Goto, Reference Goto1971; Sheldon & Strange, Reference Sheldon and Strange1982; Yamada, Reference Yamada1995; Yamada & Tohkura, 1992; Yamada, Tohkura & Kobayashi, Reference Yamada, Tohkura, Kobayashi, James and Leather1996), which follows from the fact that [l] and [ɹ] do not contrast in Japanese, but resemble variants of one Japanese phoneme. Similarly, L1 English learners of Japanese have trouble with perceiving Japanese length distinctions, as durational variation is not phonemic in English (Han, Reference Han1992; Tajima, Kato, Rothwell, Akahane-Yamada & Munhall, Reference Tajima, Kato, Rothwell, Akahane-Yamada and Munhall2008).
In contrast to negative transfer, neutral transfer results in L2 perception that is not appreciably impaired compared to that of L1 listeners. This situation usually obtains when similar L1 and L2 sounds are in a one-to-one relationship, such that the L2 listener does not need to distinguish more categories in the L2 than exist in the L1 (although the phonetic realization of the L2 sounds is likely to differ from that of the parallel L1 sounds). Thus, whereas the English lateral–rhotic contrast is difficult for L1 Japanese learners of English, it is not difficult for L1 German learners of English (Iverson, Kuhl, Akahane-Yamada, Diesch, Tohkura, Kettermann & Siebert, Reference Iverson, Kuhl, Akahane-Yamada, Diesch, Tohkura, Kettermann and Siebert2003), consistent with the fact that German contains its own lateral–rhotic contrast that can support the L2 distinction.
Although research on L2 perception mostly evinces negative effects of L1 transfer, recently a number of studies have suggested that L1 transfer can sometimes be beneficial for L2 perception, boosting L2 learners’ abilities beyond those of L1 listeners. For example, when L2 listeners share the same L1 background as an L2 talker, they can actually outperform L1 listeners at comprehending the L2 talker's accented speech – a phenomenon known as the “interlanguage speech intelligibility benefit” (Bent & Bradlow, Reference Bent and Bradlow2003; Bent, Bradlow & Smith, Reference Bent, Bradlow and Smith2008; Hayes-Harb, Smith, Bent & Bradlow, Reference Hayes-Harb, Smith, Bent and Bradlow2008). Moreover, studies on the cross-linguistic perception of approximants have shown that L1 French, Danish, and German listeners are more sensitive than L1 English listeners to differences between steps on an English /w/–/j/ continuum (Bohn & Best, Reference Bohn and Best2012; Hallé, Best & Levitt, Reference Hallé, Best and Levitt1999). Meanwhile, work on the perception of unreleased stops has found that L1 Korean learners of English are significantly better than L1 English speakers at perceiving unreleased stops in English (Chang & Mishler, Reference Chang and Mishler2012). Together these studies demonstrate that L2 perception can be aided by the recruitment of L1 knowledge, whether this knowledge comprises a different set of expectations for a talker's speech production, a heightened sensitivity to certain acoustic features, or a bias to attend to a specific part of the speech signal.
Whether L2 perception can also be aided by the recruitment of HL knowledge remains to be seen. As noted above, while the notion of L1 transfer has been central in formulating predictions and explanations regarding the linguistic behavior of L2 learners, it has not played a large role in research on HL speakers, since the L1 of HL speakers (the HL) is not the stronger language as in typical L2 learners. Consequently, there are very few findings on HL speakers’ perception of the dominant language – a gap in the literature that is addressed by the present study.
1.3 The present study
Linking work on HL speakers with work on language transfer, the present study examined the perceptual benefits of HL experience in both the HL and the dominant language. As discussed in Section 1.1, the main thrust of the literature on speech perception by HL speakers has been the demonstration of perceptual advantages for HL speakers vis-à-vis L2 learners in the HL; there is little research comparing HL speakers to native speakers of the HL, and even less comparing HL speakers to native speakers of the dominant language. Thus, the current investigation compared HL speakers’ perception in each of their languages to that of the relevant native group, in order to gain broader insight into the perceptual consequences of HL speakers’ non-canonical linguistic experience.
With regard to speech perception in the HL, findings of two studies on HL speakers suggest that HL speakers may not only outperform L2 learners, but also pattern closely with native speakers in certain tasks. In the first study, HL speakers of Russian are found to discriminate Russian plain and palatalized consonants just as well as native Russian speakers in several, but not all, experimental conditions (Lukyanchenko & Gor, Reference Lukyanchenko, Gor, Danis, Mesh and Sung2011). In the second study, HL speakers of Korean are found to discriminate Korean non-fortis and fortis fricatives just as well as native Korean speakers in an AX discrimination task with one talker; however, in more difficult tasks (AX discrimination with multiple talkers, speeded sequence recall), their perception is significantly worse than that of native Korean speakers, although still better than that of native English speakers (Lee-Ellis, Reference Lee-Ellis2012).
With regard to speech perception in the dominant language, the only known study that compares HL speakers’ perception to that of native speakers is Lee-Ellis’ (Reference Lee-Ellis2012) dissertation, which shows that HL speakers of Korean dominant in English pattern like native English speakers in perception of an English-specific contrast. In the same three tasks used to test perception of the Korean fricative contrast, Lee-Ellis tests perception of the contrast between the English nonce words [kasta] and [kasuta] and finds that whereas native Korean speakers’ perception is significantly worse than that of native English speakers, HL speakers’ perception is not significantly different. These results are used to argue that language dominance plays a more influential role than input timing (i.e., age of acquisition) in bilinguals’ current perceptual behavior, suggesting an alternative interpretation of results showing non-native-like perception of L2 contrasts in early bilinguals (e.g., Sebastián-Gallés & Soto-Faraco, Reference Sebastián-Gallés and Soto-Faraco1999); that is to say, early bilinguals may pattern as non-native-like in the L2 not because it was acquired slightly later, but because it is the non-dominant language.
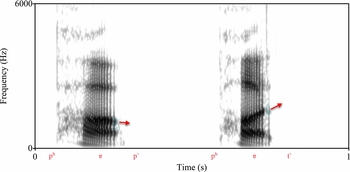
In light of these findings on HL speakers’ perception of the HL and of the dominant language, the current study tested Korean American HL speakers’ perception of coarticulation – that is, the temporal overlap of gestures associated with different speech segments – since coarticulation is a language-universal phenomenon (Lindblom & MacNeilage, Reference Lindblom and MacNeilage2011) and, therefore, present in both the HL (Korean) and the dominant language (American English). Taking advantage of the universality of coarticulation thus allowed simultaneous investigations of Korean and English perception to be maximally parallel. In particular, these investigations focused on the perception of coarticulatory cues to final unreleased stops contained in the preceding vowel (i.e., the formant transitions resulting from perturbation of the vowel articulation by the overlapping lingual gesture for the following stop), an example of which is shown in Figure 1. Figure 1 demonstrates that although the words pup and putt contain the same open-mid central vowel phoneme, the final bilabial and alveolar stops cause distinct patterns of movement in the second formant of the vowel (slightly decreasing for the bilabial, but sharply increasing for the alveolar), which can thus provide a useful cue to distinguishing between the final stops when they are unreleased (and, consequently, information from a release burst is unavailable).
Spectrogram showing coarticulatory transition cues distinguishing the English words pup and putt uttered with unreleased final stops. Arrows mark the different trajectories of the second formant preceding word-final /p/ and word-final /t/.

Unreleased stops are commonplace in both American English and Korean, but have a different status in the two languages. The commonness of “unexploded” (i.e., unreleased) stops in American English is noted as early as Rositzke (Reference Rositzke1943), and studies of large speech corpora have shown that final voiceless stops in American English are realized as unreleased at high rates: 40–60%, 43–72%, and 14–75%, respectively, for /p/, /t/, and /k/ (Byrd, Reference Byrd1993; Davidson, Reference Davidson2011; Kang, Reference Kang2003). Nevertheless, even when the unreleased variant of a final stop is clearly more frequent than the released variant, English speakers seem to recognize the released variant as the canonical form, and this form has been shown to have a greater influence in auditory word recognition (Sumner & Samuel, Reference Sumner and Samuel2005). Moreover, release burst cues appear to override coarticulatory transition cues when the two are made to conflict with each other (Wang, Reference Wang1959), suggesting that English speakers tend to rely heavily on release burst cues to a final stop. In Korean, by contrast, final voiceless stops are realized as unreleased obligatorily (Sohn, Reference Sohn1999). In other words, the unreleased variant of a final stop is not just a frequent form; it is the only form.
Based on these facts, it is reasonable to expect coarticulatory cues to final stops to play a larger role in speech processing for Korean speakers than for English speakers, and results reported in studies of final stop perception are consistent with this expectation. For example, L1 English speakers are worse at perception of unreleased final stops in Thai than both L1 Thai speakers and L1 Korean speakers (Abramson & Tingsabadh, Reference Abramson and Tingsabadh1999; Tsukada, Reference Tsukada2006; Tsukada & Roengpitya, Reference Tsukada and Roengpitya2008; Tsukada, Nguyen, Roengpitya & Ishihara, Reference Tsukada, Nguyen, Roengpitya and Ishihara2007).Footnote 3 In addition, L1 English speakers are worse than L1 Korean speakers at perception of unreleased final stops in both Korean and English (Chang & Mishler, Reference Chang and Mishler2012). The finding that L1 Korean speakers outperform L1 English speakers in perception of English unreleased final stops is especially noteworthy because it suggests that an advantageous perceptual bias from the L1 can compensate for, and even overcome, the decrement in perceptual accuracy characteristic of L2 speech processing.
Given the possibility of such a native-language transfer benefit, the current study tested the hypothesis that, due to their early bilingual experience and the different nature of unreleased stops in Korean and English, HL speakers of Korean in the U.S. would show not only native-like perception of Korean unreleased stops, but also better-than-native perception of English unreleased stops. Although the few findings on speech perception by HL speakers are not consistent in showing native-like perception of the HL, it was predicted that attunement of the perceptual system to coarticulatory cues would be among the early perceptual changes occurring in infant speech development (Kuhl, Williams, Lacerda, Stevens & Lindblom, Reference Kuhl, Williams, Lacerda, Stevens and Lindblom1992), and that this attunement would persist despite the non-dominance of the HL, leading HL speakers to pattern like native Korean speakers in perception of unreleased stops in Korean. Furthermore, the enhanced sensitivity to coarticulatory cues following from early experience with Korean was predicted to transfer to perception of English, such that HL speakers, like native Korean speakers, would outperform native English speakers at perception of unreleased stops in English.
To test these predictions, three perception experiments were conducted using the design in Chang and Mishler (Reference Chang and Mishler2012) with three groups of listeners: native Korean (NK) speakers, native English (NE) speakers, and heritage Korean (HK) speakers dominant in English. In order to abstract away from lexical effects and focus on the use of coarticulatory cues in speech processing, Experiments 1 and 2 investigated the perception of Korean and English nonce stimuli. The influence of lexical knowledge on perceptual behavior was then examined in Experiment 3, which used real English words. Because lexical knowledge of English was required in Experiment 3, the NK group comprised native Korean speakers who were L2 learners of English. On the other hand, because one objective of the study was to examine how HL speakers would compare to native speakers of the dominant language, the NE group comprised native English speakers who were not familiar with Korean or any other language containing obligatorily unreleased stops, in order for the data to better represent a measure of monolingual native English perception.
In regard to the English perception experiments, it is worth noting that the design of this study stacked the odds against the HK group patterning like the NE group. Specifically, the use of nonce stimuli in Experiment 2 put the HK group at a disadvantage relative to the NE group, since L2 perception has been shown to suffer significantly with unknown words and non-words (Mora, Reference Mora, Hazan and Iverson2005). In addition, because the HK group grew up bilingually and began acquiring English later than the NE group, it is possible they had access to a smaller English lexicon than the NE group (see Ben-Zeev, Reference Ben-Zeev1977; Bialystok, Craik, Green & Gollan, Reference Bialystok, Craik, Green and Gollan2009; Doyle, Champagne & Segalowitz, Reference Doyle, Champagne, Segalowitz and Paradis1978); this would put them at a disadvantage in Experiment 3, by way of diminishing their ability to recruit lexical knowledge to narrow down the set of candidate parses of a potentially ambiguous speech signal. Consequently, Experiments 2–3 can be understood to provide a strong test of the prediction of a perceptual advantage for HK bilinguals over NE speakers.
2. Methods
2.1 Participants
All participants were recruited from the University of Maryland community and the Washington, DC metropolitan area. They reported no history of hearing, speech, or language impairments; gave informed consent; and were paid for their participation.
Three talkers recorded the speech stimuli for the perception experiments. The Korean talker was a male native speaker of Seoul Korean (age 32 years) born and raised in Seoul. The English talkers were two male native speakers of American English (age 19 and 25 years) who were raised primarily in Maryland and had no experience with any language containing obligatorily unreleased stops.
Three groups of listeners participated in the perception experiments: a native Korean (NK) group, a native English (NE) group, and a heritage Korean (HK) group. The NK group comprised 28 native speakers of Korean (12 male; mean age 26;1, SD 6;6) who were born and raised primarily in South Korea, but had been residing in the U.S. for a significant amount of time (mean age of arrival 19;8, SD 6;6; mean length of residence 5;7, SD 4;6). As L2 learners of English who reported extensive study of English following from the compulsory nature of English education in modern South Korea (mean length 11;11, SD 5;8), NK listeners were highly familiar with and proficient in English; a minority also reported formal study of an additional language (e.g., Japanese, Spanish). However, none had any experience with other languages containing variably or obligatorily unreleased stops.
The NE group comprised 28 native, “functionally monolingual” (Best & Tyler, Reference Best, Tyler, Bohn and Munro2007, p. 16) speakers of American English (12 male; mean age 21;4, SD 5;4) who were born and raised in English-speaking households in the U.S. (mostly in Maryland, Virginia, or Washington, DC). Most had formally studied at least one foreign language in school (generally French or Spanish); however, none reported fluency in another language, regular use of another language for communicative purposes, or any experience with a language containing obligatorily unreleased stops.
The HK group comprised 28 Korean Americans (11 male; mean age 21;7, SD 4;2) who had heritage language experience with Korean, but no experience with other languages containing obligatorily unreleased stops. Like NE listeners, HK listeners were raised primarily in the U.S. (mostly in Maryland, Virginia, or Washington, DC), with an early mean age of arrival of 1;4 (SD 2;5), most having been born in the U.S. as well. Unlike NE listeners, however, HK listeners had early exposure to Korean by virtue of being raised in a Korean-speaking household. Throughout childhood, moreover, they remained in the same household (i.e., they were never sent away from home); thus, given that their caretakers were described as still speaking Korean at home at the time of the study, it is reasonable to conclude that HK listeners’ exposure to Korean during their formative years was continuous.
As is common with HLs, HK listeners’ experience with Korean began early, but was unlike that of native speakers in the native language environment, and nearly half did not identify Korean as a native language. Instead of monolingual Korean exposure, most described the language spoken at home during childhood as a mixture of Korean and English consisting of approximately 70% Korean on average (or “Konglish”, as described by many participants, referring both to the insertion of English words in a Korean grammatical frame and to inter-sentential code-switching between the two languages). A common pattern was for the home language to consist almost entirely of Korean until kindergarten and then to mix in more English (both in terms of portions of code-switched utterances and proportion of wholly English utterances) as the participant progressed through school (see Montrul, Reference Montrul2012). As their exposure to Korean was mostly limited to home contexts, HK listeners reported understanding only about 75% of formal spoken Korean on average (SD 14%) and rated their Korean speaking proficiency at the time of the study at 2.4 (SD 0.9) on a 0–5 scale, a score that translates to somewhere between ‘fair’ and ‘good.’ None rated their proficiency as native-like. Thus, these individuals were most readily identifiable as “mesolectal” HL speakers on the HL proficiency continuum of Polinsky and Kagan (Reference Polinsky and Kagan2007, pp. 371–372) – that is, HL speakers with intermediate to advanced proficiency in between that of “basilectal” HL speakers (those at the low end of the continuum) and that of “acrolectal” HL speakers (those at the high end of the continuum).
2.2 Stimulus materials
The materials for Experiment 1, which tested identification of unreleased stops in Korean, comprised a set of 28 disyllabic Korean nonce words that differed in terms of final vowel (7 possibilities) and final stop (4 possibilities). The first syllable and second-syllable onset of each item were always [mju] and [ɾ], respectively, while the second-syllable nucleus varied over each of the seven monophthongal vowels of contemporary modern Korean: /i/, /u/, /a/, /ɛ/, /o/, /ʌ/, and /ɨ/ (Chang, Reference Chang2012; Ingram & Park, Reference Ingram and Park1997; Ko, Reference Ko2009; Lee, Reference Lee1993). In addition to variation in the final vowel, the final stop of an item varied over four possibilities: /p/, /t/, /k/, and zero (i.e., absence of a final stop). The full list of items is given in Table 1.
Korean and English stimuli used in Experiments 1–3. Nonce words used in Experiments 1–2 are given in IPA transcription; real words used in Experiment 3 are given in English orthography.

The materials for Experiment 2, which tested identification of unreleased stops in English, comprised a set of 56 disyllabic English nonce words that differed in terms of stress pattern (two possibilities), final vowel (seven possibilities), and final stop (four possibilities). To ensure that the items would be perceived as English rather than Korean, the first- and second-syllable onsets of each item were, respectively, [ɹ] and [z], segments that are identifiably English-like and absent from the Korean inventory. The first-syllable nucleus was filled with a mid central vowel quality, with primary stress alternating between the initial and final syllables. The second-syllable nucleus varied over a set of seven possibilities: /i/, /u/, /ɑ/, /eɪ/, /oʊ/, /ɑɪ/, and /ɑɹ/ (the first three representing relatively monophthongal nuclei similar to Korean vowels, the last four representing diphthongal nuclei with no correspondent in the Korean inventory). Finally, as in Experiment 1, the final stop of an item varied over four possibilities: /p/, /t/, /k/, and zero (absence of a final stop).
In contrast to Experiments 1–2, Experiment 3 was meant to test the perception of unreleased stops with lexical knowledge, so the materials for this experiment consisted of a set of 48 minimal pairs of monosyllabic English words (in addition to 16 monosyllabic control words that composed additional “same” trials in the discrimination task). The minimal pairs represented two types of contrast: “stop/stop” contrast, in which the locus of the contrast was the place of articulation of a final voiceless stop (e.g., weep, wheat), and “stop/zero” contrast, in which the locus of the contrast was the presence vs. absence of a final voiceless stop (e.g., beet, bee). Minimal pairs with diverse syllable nuclei were selected representing nearly the entire English vowel inventory. Furthermore, spoken frequency of the two members of a minimal pair was balanced using frequency data from the Corpus of Contemporary American English (Davies, Reference Davies2008), such that the phonological forms of the two words in every pair differed in spoken frequency by less than an order of magnitude.
2.3 Procedure
Stimulus preparation
The stimulus items were recorded by native speakers of the respective languages (described in Section 2.1) in a sound-attenuated booth using a Zoom H4n mobile audio recorder and an Audix HT5 head-mounted condenser microphone positioned about 2 cm to the left of the talker's mouth. The items were presented to the talker on individual index cards a total of three times, each time in a different random order. The Korean items were written in Korean orthography, while the English items were written in English orthography, with the stressed syllable of a nonce item underlined (e.g., <ruzzepe> for [ˈɹɐzip
 ]).Footnote
4
In the few instances where a talker's pronunciation of an item differed from the desired pronunciation, his pronunciation was corrected, and the item was re-recorded. Audio was recorded at 44.1 kHz with 24-bit resolution, and a Qwik Time QT-3 metronome set at 60 beats/min was used to present items at a steady rate of approximately one every two seconds.
To prepare the English stimuli that were used in Experiments 2–3, tokens in which the talker fully released the final stop of an item were edited in Praat (Boersma & Weenink, Reference Boersma and Weenink2011) to remove the final release burst, producing items with “dereleased” final stops. Tokens that were edited in this way were used rather than tokens in which the talker produced the final stop as unreleased in order to ensure that the oral gesture for the final stop (and, thus, the coarticulatory formant transitions associated with it) were present in the acoustic signal. Stops that were intentionally produced as unreleased were sometimes realized with no audible oral closure or with nasal release (as often occurs with unreleased stops in Vietnamese; see Michaud, Vũ Ngọc, Amelot & Roubeau, Reference Michaud, Vũ Ngọc, Amelot and Roubeau2006), so they could not be used for the purposes of testing the perception of coarticulatory cues in the absence of release cues. Fortunately, perception of “dereleased” stops by native English speakers has been shown in at least two studies to be very similar to perception of unreleased stops (Lisker, Reference Lisker1999; Malécot, Reference Malécot1958), suggesting that the results of the current study are likely to resemble results that would be obtained using naturally unreleased stops.Footnote 5
Perception experiments
Listeners participated in a total of three experiments while seated in a sound-attenuated booth. The experiments were run in E-Prime (Psychology Software Tools, Inc., 2002) using a Dell Latitude D430 laptop computer, a pair of Audio-Technica QuietPoint ATH-ANC7 binaural headphones, and a Psychology Software Tools Model 200A serial response box. Listeners were given both oral instructions and written instructions about the tasks in their dominant language (i.e., in Korean for the NK group; in English for the NE and HK groups). In particular, they were instructed to listen carefully to the stimuli and to respond as quickly and accurately as possible. The experiments were completed in the following order with intervening breaks: Experiment 3, Experiment 2, Experiment 1. Experiment 1 was ordered last in order to avoid any potential influence of the processing of Korean stimuli on the processing of English stimuli in Experiments 2–3.
In Experiment 1, listeners completed a speeded (i.e., “respond as fast as you can”) four-alternative forced choice (4AFC) identification task with Korean nonce words. Since the NE group was not familiar with Korean, the stimuli in this experiment were presented in isolation to reduce the difficulty of the task. On each trial, a trial counter was presented on screen for one second, and then one of the 28 nonce words was played. After each item was played, listeners had to identify whether the item ended in /p/, /t/, /k/, or something else (“other”) as quickly and accurately as possible. The experiment consisted of an initial practice block of eight trials and three randomized test blocks of 28 trials each.
In Experiment 2, listeners completed a similar 4AFC identification task with English nonce words. In order to increase the difficulty of this task, especially for the L2 English groups (NK and HK; see Section 1.3 below), these stimuli were spoken by two different talkers and presented at the end of an English sentence. On each trial, a trial counter was presented on screen for 1 second, and then a randomly selected precursor (This word is . . ., Now the word is . . ., or The next word is . . .) was played, followed immediately by one of the 56 nonce words. The precursor and nonce item in a given trial were spoken by the same talker. After each item was played, listeners again had to identify whether the item ended in /p/, /t/, /k/, or something else (“other”) as quickly and accurately as possible. The experiment consisted of an initial practice block of eight trials and three randomized test blocks of 56 trials each. The first test block contained trials spoken by the first talker; the second test block contained trials spoken by the second talker; and the third test block contained trials spoken by either talker.
In Experiment 3, listeners completed a speeded AX discrimination task with pairs of English words. On each trial, a trial counter was presented on screen for one second; then the first word (A) was played, followed by an inter-stimulus interval (ISI) of one second; and finally the second word (X) was played. After the second word of each pair was played, listeners had to identify whether the two words in the word pair were the same word or different words as quickly and accurately as possible. To make the task more difficult (especially for the NK and HK groups), as well as encourage discrimination of the words at an abstract level (see, e.g., Flege, Reference Flege, Fava and Mioni2003), the two words in each word pair were spoken by different talkers and were separated by a long ISI, increasing the memory demand on processing of the first word and, consequently, the likelihood of higher-level encoding using long-term phonological representations associated with lexical items; both of these measures were meant to discourage listeners from discriminating the stimuli at a purely acoustic level. The experiment consisted of an initial practice block of 12 trials and then two randomized test blocks comprising a total of 192 trials (96 “same” trials and 96 “different” trials, distributed evenly across blocks and across both possible talker orders).
3. Results
3.1 Experiment 1: Identification in Korean
The identification data from Experiment 1 were analyzed by building a mixed-effects logistic regression model of the likelihood of accuracy (Dixon, Reference Dixon2008; Jaeger, Reference Jaeger2008), starting with random-effect terms for Participant and Item and adding fixed-effect terms for Final (stop, sonorant; reference level = stop), Group (NK, NE, HK; reference level = NK), and a Final × Group interaction. A model with just random effects was improved by adding the Final term (χ2(1) = 15.909, p < .0001) and was further improved by adding the Group term (χ2(2) = 41.154, p < .0001); however, the model was not further improved by adding the Final × Group interaction (χ2(2) = 0.426, n.s.). Consequently, the final model of the Korean identification data (n = 7056, log-likelihood = –2428) included two fixed-effect terms for Final and Group and no interaction term.
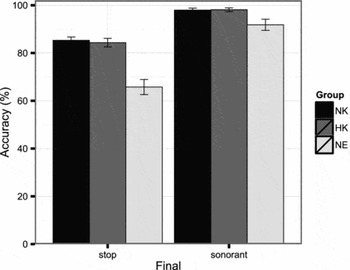
The results of Experiment 1 supported the hypothesis that HK listeners would pattern like NK listeners in perception of Korean unreleased stops. Model results showed that the odds of NK listeners accurately identifying final stops were much better than 50–50 (β = 2.265, z = 8.204, p < .0001); nevertheless, they were significantly more likely to identify final sonorants (as “other” sounds) accurately than to identify final stops accurately (β = 2.146, z = 4.536, p < .0001). In fact, the NK, HK, and NE groups all showed higher accuracy on final sonorants compared to final stops; however, they differed with respect to overall accuracy. As expected, NE listeners were much less likely overall to make accurate identification judgments compared to NK listeners (β = –1.417, z = –6.413, p < .0001). In contrast, HK listeners were not significantly less likely than NK listeners to make accurate identification judgments (β = –0.073, z = –0.322, n.s.), and mixed-effects models built for each final type separately confirmed that HK listeners did not differ significantly from NK listeners on final stops (β = –0.084, z = –0.360, n.s.) or on final sonorants (β = 0.094, z = 0.136, n.s.). As shown in Figure 2, while the NE group was considerably less accurate than the NK group overall, the HK group performed on par with the NK group on both final types. Furthermore, post-hoc examination of percent accuracy on stops by place of articulation showed that the NK and HK groups both performed well above (more than 10% better than) the level of the NE group at all three places – bilabial (NK: 79%, HK: 80%, NE: 66%), alveolar (NK: 89%, HK: 82%, NE: 71%), and velar (NK: 88%, HK: 91%, NE: 60%).
Percent accuracy in Experiment 1 (Korean identification), by final type and group. The leftmost bars plot mean accuracy for identification of Korean unreleased stop finals; the rightmost bars, mean accuracy for identification of Korean sonorant finals as “other” sounds (i.e., not /p t k/). The native Korean (NK), heritage Korean (HK), and native English (NE) groups are represented in black, gray, and white, respectively. Error bars mark ±1 standard error of the mean over participants.

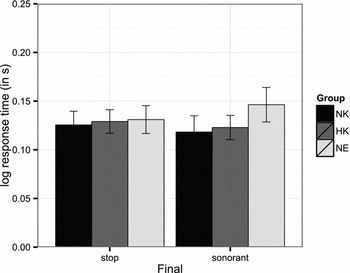
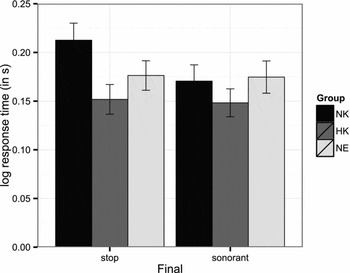
Although HK listeners were overall just as accurate as NK listeners in the identification task, it is possible they required more time to reach the same level of accuracy. To check whether this was the case, response times for correct identification judgments were analyzed in a mixed-effects linear regression model (following Baayen, Davidson & Bates, Reference Baayen, Davidson and Bates2008), excluding extreme response times (more than 2.5 standard deviations from the participant's mean, 6.2% of the original data; see Sumner & Samuel, Reference Sumner and Samuel2009) and correcting for positive skew in the data with log transformation (Newell & Rosenbloom, Reference Newell, Rosenbloom and Anderson1981). The model with random-effect terms for Participant and Item was not significantly improved by fixed-effect terms for Final (χ2(1) = 0, n.s.) and Group (χ2(2) = 0.976, n.s.), but was significantly improved by the Final × Group interaction (χ2(2) = 18.588, p < .0001). This interaction arose because of a disparity in the effect of final type between NK and HK listeners on the one hand and NE listeners on the other: whereas NK and HK listeners tended to respond more quickly on final sonorants than on final stops, NE listeners tended to respond more slowly (Figure 3). Crucially, HK listeners were not significantly slower than NK listeners on final stops (β = 0.004, t = 0.230, n.s.), and an additional model showed that they were not significantly slower on final sonorants, either (β = 0.010, t = 0.540, n.s.). These results thus suggest that HK listeners did not require more time than NK listeners to reach the same level of accuracy in Experiment 1.
Log response time in Experiment 1 (Korean identification), by final type and group. The leftmost bars plot mean log response time for correct identification of Korean unreleased stop finals; the rightmost bars, mean log response time for correct identification of Korean sonorant finals as “other” sounds (i.e., not /p t k/). The native Korean (NK), heritage Korean (HK), and native English (NE) groups are represented in black, gray, and white, respectively. Error bars mark ±1 standard error of the mean over participants.

3.2 Experiment 2: Identification in English
As with the identification data from Experiment 1, the identification data from Experiment 2 were analyzed by building a mixed-effects logistic regression model of the likelihood of accuracy, starting with random-effect terms for Participant and Item and adding fixed-effect terms for Final (stop, sonorant; reference level = stop), Group (NK, NE, HK; reference level = NE), and a Final × Group interaction. A model with just random effects was improved by adding the Final term (χ2(1) = 101.110, p < .0001), the Group term (χ2(2) = 8.099, p < .05), and the Final × Group interaction (χ2(2) = 8.565, p < .05). Consequently, the final model of the English identification data (n = 14112, log-likelihood = –5919) included three fixed-effect terms for Final, Group, and Final × Group.
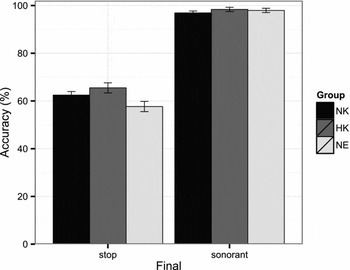
The results of Experiment 2 supported the hypothesis that HK listeners would show better-than-native perception of English unreleased stops. Model results showed that the odds of NE listeners accurately identifying final stops were better than 50–50 (β = 0.381, z = 2.159, p < .05), but NE listeners were much more likely to identify final sonorants (as “other” sounds) accurately than to identify final stops accurately (β = 4.060, z = 11.290, p < .0001). As in Experiment 1, all three groups showed lower accuracy on final stops compared to final sonorants (where performance was at ceiling for all groups); however, the groups differed with respect to their accuracy on final stops (Figure 4). Consistent with Chang and Mishler (Reference Chang and Mishler2012), NK listeners were more likely than NE listeners to identify final stops accurately, although the difference between groups was only marginally significant here (β = 0.267, z = 1.717, p = .086). Crucially, HK listeners were also more likely than NE listeners to identify final stops accurately (β = 0.460, z = 2.951, p < .01). Moreover, post-hoc analyses of percent accuracy by place of articulation showed that HK listeners’ advantage over NE listeners was broad, holding for bilabials (63% vs. 59%), alveolars (84% vs. 81%), and velars (49% vs. 33%).Footnote 6
Percent accuracy in Experiment 2 (English identification), by final type and group. The leftmost bars plot mean accuracy for identification of English unreleased stop finals; the rightmost bars, mean accuracy for identification of English sonorant finals as “other” sounds (i.e., not /p t k/). The native Korean (NK), heritage Korean (HK), and native English (NE) groups are represented in black, gray, and white, respectively. Error bars mark ±1 standard error of the mean over participants.

To check whether HK listeners’ higher accuracy on final stops relative to NE listeners could be attributed to a speed–accuracy tradeoff for NE listeners (i.e., faster responses leading to more errors), response times for correct stop identification judgments were analyzed in a mixed-effects linear regression model, excluding extreme response times (6.7% of the original data) and correcting for positive skew with log transformation. The model with random-effect terms for Participant and Item was marginally improved by a fixed-effect term for Group (χ2(2) = 5.054, p = .080). While NK listeners’ correct stop identifications tended to be slower than NE listeners’, HK listeners’ correct identifications on both stops and sonorants tended to be faster than NE listeners’ (Figure 5), although model coefficients showed none of the overall differences between groups to be statistically significant.Footnote 7 Therefore, these results do not support attributing HK listeners’ higher accuracy on final stops to a speed–accuracy tradeoff for NE listeners. HK listeners showed higher accuracy on final stop identification with response times that actually tended to be faster, not slower, than those of NE listeners.
Log response time in Experiment 2 (English identification), by final type and group. The leftmost bars plot mean log response time for correct identification of English unreleased stop finals; the rightmost bars, mean log response time for correct identification of English sonorant finals as “other” sounds (i.e., not /p t k/). The native Korean (NK), heritage Korean (HK), and native English (NE) groups are represented in black, gray, and white, respectively. Error bars mark ±1 standard error of the mean over participants.

3.3 Experiment 3: Discrimination in English
The discrimination data from Experiment 3 were analyzed by building a mixed-effects linear regression model of perceptual sensitivity to stimulus changes as indexed by d′, a measure of discrimination ability that accounts for response bias (Macmillan & Creelman, Reference Macmillan and Creelman2005). Similar to the logistic models of the identification data from Experiments 1–2, the linear model of d′ started with a random-effect term for Participant, to which were added, in incremental fashion, fixed-effect terms for Contrast (stop/stop, stop/zero; reference level = stop/stop), Group (NK, NE, HK; reference level = NE), and a Contrast × Group interaction. The basic model with just the random effect for Participant was improved by adding the Contrast term (χ2(1) = 130.100, p < .0001), the Group term (χ2(2) = 9.734, p < .01), and the Contrast × Group interaction (χ2(2) = 18.605, p < .0001). Therefore, the final model of English discrimination performance (n = 168, log-likelihood = –92.78) included three fixed-effect terms for Contrast, Group, and Contrast × Group.
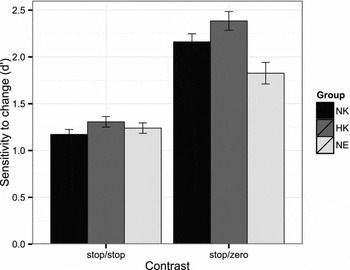
The results of Experiment 3 were consistent with those of Experiment 2 in showing superior performance for HK listeners vis-à-vis NE listeners in perception of English. Model results revealed that NE listeners’ sensitivity to stop/stop contrasts was significantly greater than zero (β = 1.240, t = 15.201, p < .0001). However, NE listeners were more sensitive to stop/zero contrasts than to stop/stop contrasts (β = 0.586, t = 7.095, p < .0001), a pattern that was found in all groups (Figure 6). Compared to NE listeners, HK listeners tended to show greater sensitivity to stop/stop contrasts, although none of the between-group differences on stop/stop contrasts were statistically significant. In the case of stop/zero contrasts, however, both NK listeners and HK listeners showed significantly greater sensitivity than NE listeners (NK vs. NE: β = 0.335, t = 2.336, p < .05; HK vs. NE: β = 0.559, t = 3.897, p < .001). Furthermore, post-hoc analyses of discrimination accuracy on stop/zero pairs by place of articulation of the stop showed that HK listeners’ advantage over NE listeners was consistent across places, holding for /p/–zero pairs (93% vs. 88%), /t/–zero pairs (85% vs. 62%), and /k/–zero pairs (94% vs. 75%). In additional models comparing HK listeners and NK listeners specifically, HK listeners’ advantage over NK listeners was only marginally significant, both on stop/stop contrasts (β = 0.134, t = 1.723, p = .091) and on stop/zero contrasts (β = 0.224, t = 1.689, p = .097). Nevertheless, the finding that HK listeners outperformed NE listeners in discrimination of stop/zero contrasts provides evidence in support of the hypothesis that HK listeners derive perceptual benefits from their HL experience that are not limited to the HL.
Perceptual sensitivity in Experiment 3 (English discrimination), by contrast type and group. The leftmost bars plot d′ for discrimination of English minimal pairs differing in terms of final stop (e.g., weep, wheat); the rightmost bars, d′ for discrimination of English minimal pairs differing in terms of the presence of a final stop (e.g., beet, bee). The native Korean (NK), heritage Korean (HK), and native English (NE) groups are represented in black, gray, and white, respectively. Error bars mark ±1 standard error of the mean over participants.

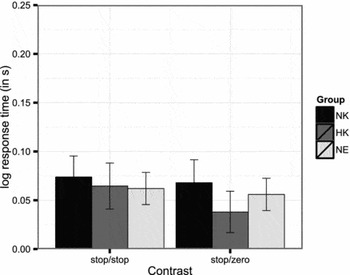
As in Experiments 1–2, the possibility that HK listeners’ superior discrimination of stop/zero contrasts was due to slower response times was examined by building a mixed-effects linear regression model of response times for correct stop/zero discrimination judgments, excluding extreme response times (3.7% of the original data) and using log transformation to correct for positive skew in the data. The model with random-effect terms for Participant, Item 1, and Item 2 was not improved by a fixed-effect term for Group (χ2(2) = 0.365, n.s.). Moreover, comparison of group means revealed that HK listeners’ correct stop/zero discrimination responses tended to be faster than NE listeners’ (Figure 7), although the difference between the HK and NE groups here was not statistically significant (β = –0.012, t = –0.500, n.s.). Thus, response time data were again inconsistent with an account of HK listeners’ performance in terms of a speed–accuracy tradeoff, suggesting that the superior perceptual abilities they demonstrated were due to their language experience, not to completing the task in an easier manner.
Log response time in Experiment 3 (English discrimination), by contrast type and group. The leftmost bars plot mean log response time for correct discrimination of English stop/stop pairs (e.g., weep, wheat); the rightmost bars, mean log response time for correct discrimination of English stop/zero pairs (e.g., beet, bee). The native Korean (NK), heritage Korean (HK), and native English (NE) groups are represented in black, gray, and white, respectively. Error bars mark ±1 standard error of the mean over participants.

4. Discussion
Examining the use of coarticulatory cues to final stops, the current study provided evidence that HL experience can provide perceptual benefits in both the HL and the dominant language. In Experiment 1, HK (heritage Korean) speakers were as good as NK (native Korean) speakers at perceiving unreleased stops in Korean, and in Experiments 2–3, they were better than NE (native English) speakers at perceiving unreleased stops (specifically, “dereleased” stops) in English, with or without the aid of lexical knowledge. Notably, these bilingual perceptual benefits were evident in spite of the fact that HK speakers’ Korean was far from native-like, as well as the fact that English was technically their L2.
Before discussing these findings further, it is important to point out that the performance of the HK speakers rules out an account of the native-language transfer benefit for L1 Korean late learners of English (NK listeners) in terms of perceptual priming from Korean instructions (i.e., being in a Korean language mode) or in terms of frequency effects. Although it is reasonable to suppose that hearing and/or reading Korean instructions at the beginning of the experimental session might have primed NK listeners to attend to coarticulatory cues in the English perception experiments, HK speakers, like NE speakers, were purposefully not exposed to Korean during the session until after they had completed the English perception experiments. Therefore, the superior performance of HK speakers cannot be an artifact of priming from initial exposure to Korean, suggesting that the superior performance of NK listeners is probably not, either.
An alternative explanation for the apparent native-language transfer benefit from Korean experience might interpret this effect as an artifact of relatively poor performance on the part of the NE speakers arising from a mismatch between frequency-based expectations of release for final stops and the absence of release in the experimental stimuli. However, aside from the fact that strong expectations of release would be inconsistent with the high frequency of unreleased stops in American English, the performance of the HK speakers in Experiments 2–3 again contradicts this explanation. That is to say, if the performance of the NE speakers were impaired by expectations of release in American English, then the performance of the HK speakers should have been similarly impaired. After all, having been raised and educated in the same areas of the U.S. as the NE speakers, they had similarly extensive and early experience with American English and, thus, similar statistical information regarding the frequency of release in American English. Nevertheless, the HK speakers still showed greater perceptual sensitivity to English unreleased stops than the NE speakers, suggesting that the native-language transfer benefit was not due to frequency effects.
However, another possible explanation for the HK speakers’ superior perception of unreleased stops is that they had a different set of expectations for release compared to NE speakers as a consequence of extensive exposure to Korean-accented English (from their parents and others within the local Korean community). Perhaps, for example, L1 Korean learners of English tend to produce unreleased stops in English with greater frequency than NE speakers due to the canonicity of unreleased stops in Korean. If this were the case, then HK speakers might have had more overall experience processing unreleased stops in English than the NE speakers, and this could have been the source of the advantage they showed in the current study. In fact, however, data from loanword adaptation in Korean suggests that, if anything, the opposite is most likely to be true, which is easiest to see in the case of final /t/. As Kang (Reference Kang2003) points out, although patterns of final vowel epenthesis in Korean loanword adaptation suggest that Korean speakers are sensitive to the relative frequency of release of English final plosives, final /t/ in English tends to be adapted with a following epenthetic vowel in Korean (59–73% of the time), in contrast with the fact that it is usually realized without release in English (70% of the time according to Kang's analysis of the TIMIT corpus).Footnote 8 Therefore, if HK speakers were to be influenced in their English perception by the different statistics of release in Korean-accented English, this influence would mislead them to perform worse than NE speakers on final /t/. However, as discussed in Sections 3.2 and 3.3, HK speakers actually performed better than NE speakers on all places of articulation.Footnote 9
Interestingly, the current findings, in conjunction with those of Lee-Ellis (Reference Lee-Ellis2012), suggest that transfer of HL knowledge to perception of the dominant language occurs in such a way as to maximize performance. For the HK speakers in Lee-Ellis (Reference Lee-Ellis2012), transfer of Korean phonology to the perception of an English-specific contrast could have negatively affected their performance, yet their attested performance, which patterned with that of NE speakers, bore no trace of transfer from their HL experience. The results of the present study are complementary in showing that when HL knowledge can benefit perception of the dominant language, this knowledge does transfer, leading to a perceptual advantage over native listeners of the dominant language. Thus, while the occurrence of phonological transfer from the HL in the current study contrasts with the lack of phonological transfer from the HL in Lee-Ellis (Reference Lee-Ellis2012), in a sense these two studies are actually entirely consistent with each other. Taken together, they suggest that HL knowledge is recruited in processing of the dominant language depending on the utility of the HL knowledge. When this knowledge is useful, it can be applied to the perception of another language; when it is not useful, it can be ignored. This kind of “best-case scenario” in the effects of HL phonological experience thus appears to be yet another positive aspect of bilingualism in a growing list of cognitive benefits that are being documented in the literature (Bialystok et al., Reference Bialystok, Craik, Green and Gollan2009).
With regard to perception of the HL, it remains a question why HL speakers seem to be native-like in some circumstances, but not native-like in others. For example, HK speakers in the current study were found to be native-like in perception of Korean unreleased stops, whereas HK speakers in Lee-Ellis (Reference Lee-Ellis2012) were often intermediate between NK speakers and NE speakers in perception of the Korean fricative contrast. HL speakers of Russian in Lukyanchenko and Gor (Reference Lukyanchenko, Gor, Danis, Mesh and Sung2011), moreover, were native-like on some Russian plain–palatalized contrasts, but not on others. Clearly, the demonstrated perceptual abilities of HL speakers, as well as those of other groups, may differ depending on the choice of task and the inherent categoricity of the speech sounds being compared; however, they are likely also to be related to the nature of the relevant HL input and potential interactions between the HL and the dominant language. For example, it would not be surprising if the Russian consonants that are more difficult for HL speakers of Russian to discriminate in final position like native speakers (/p/–/pj/) are significantly less frequent in their input than those they discriminate in a native-like fashion (/t/–/tj/). In addition, the Russian consonants /p/ and /pj/ in final position may be relatively more liable to be perceptually assimilated to the same category in the dominant language, as the fortis and non-fortis fricatives of Korean tend to be for native English speakers (Cheon & Anderson, Reference Cheon and Anderson2008); such “Single Category” assimilation is closely associated with poor discriminability (Best, Reference Best, Goodman and Nusbaum1994, Reference Best1995). Additional research is needed to better understand the various interacting factors that influence the relative perceptual performance of HL speakers in the HL.
Although HL speakers may not always show native-like perception of the HL, in the current study HK speakers were no different from NK speakers in their perception of Korean unreleased stops, a result that is consistent with the HL literature in suggesting that there is something special about childhood linguistic experience with respect to the knowledge of language that is acquired during this time period. In particular, this finding is consistent with the idea that attunement to coarticulatory cues is an aspect of perceptual development that occurs during the early stages of language acquisition. On the other hand, there is also reason to believe that perceptual reorganization may occur with the appropriate linguistic input in adulthood (see Flege, Reference Flege1995), which leads to the question of how groups that were not included in this study – namely, L1 Korean monolinguals and L1 English learners of Korean – would compare to the groups that were included. Thus, it would be interesting to test L1 Korean monolinguals to see if early Korean experience leads to a perceptual advantage in the processing of English unreleased stops even without extensive exposure to English. Furthermore, in light of the benefits that HL speakers seem to derive from their early experience with Korean, the next logical step would be to test L1 English learners of Korean to see whether similar perceptual benefits can follow from late L2 exposure. If the literature on L2 perception in late L2 learners is any indication, perceptual benefits of late L2 experience in the L1 are unlikely to be significant; however, this is an empirical question that awaits future investigation.
5. Conclusion
The contribution of the present study to the HL literature is in demonstrating that, at least in certain dimensions of phonological contrast, HL speakers may maintain acute perceptual abilities in both of their languages. These findings have implications both for research on HL speakers and for the analysis of language transfer. One reason why the bilingual perceptual benefits shown by HL speakers are significant is that they obtain in spite of the unbalanced nature of HL speakers’ bilingualism. In particular, knowledge of the HL has a clear – and advantageous – effect on speech processing in the dominant language even though HL speakers’ proficiency in the HL is uneven and relatively weak.
Thus, the current findings converge with others showing linguistic benefits of early HL experience. Although it is clear that life with two languages is associated with both benefits and costs (Bialystok & Craik, Reference Bialystok and Craik2010; Michael & Gollan, Reference Michael, Gollan, Kroll and de Groot2005), the present study suggests that much of the reason HL experience is often found to be beneficial is that, like early bilingual experience in general, it exposes the HL learner from an early age to a wider range of linguistic possibilities. In the case of the present study, HL speakers of Korean learn from their early bilingual experience that coarticulatory cues can be highly informative in a way that native English speakers do not, and this difference in early linguistic experience translates into greater perceptual adaptability in English for HL speakers than for native English speakers. This kind of linguistic adaptability is, perhaps, one of the chief advantages of knowing more than one language, even when it is a heritage language that has not been fully mastered.