


Introduction
The variability, distribution and trends of Sea-ice thickness are central issues in current polar climate research (e.g. Reference Rothrock, Yu and MaykutRothrock and others, 1999; Reference Laxon, Peacock and SmithLaxon and others, 2003; Reference Haas, Gerland, Eicken and MillerHaas, 2004). Sea-ice thickness depends on atmospheric and oceanographic conditions: wind and ocean current Speeds and directions, the amount and phase of precipitation, and atmospheric and ocean heat fluxes. the amplitude, timing and frequency of key parameter variations and events are relevant for Sea-ice processes. for example, a mild Spell during early Spring can change the Sea-ice Surface in a region and therefore influence the albedo feedback, and as a result the rate and amount of ablation. however, it may not affect the mean annual temperature.
The Study and monitoring of fast-ice thickness has advantages and disadvantages over drifting ice. logistically, fast-ice monitoring is easier and cheaper and So allows longer and more consistent time Series to be obtained. conversely, fast ice is usually more influenced by local weather due to land, and dynamic processes that are important for drifting ice cannot be Studied Sufficiently in fast-ice regions.
For the western coast of Spitsbergen, the largest island in the Svalbard archipelago, relatively few data have been published regarding fast ice in fjords other than kongsfjorden. publications prior to the mid-1990s that include information on fast ice do not usually deal directly with Sea-ice processes but with related fields where Sea ice plays Some role, for example as a habitat for Seals and Seabirds (Reference Lydersen and GjertzLydersen and gjertz, 1986; Reference MehlumMehlum, 1991; Reference Parker and MehlumParker and Reference MehlumMehlum, 1991). in contrast, Several long time Series and measurements of fast-ice thickness are available from the north american arctic (e.g. Reference BilelloBilello, 1961, Reference Bilello and Pritchard1980; Reference Brown and CoteBrown and cote, 1992; Reference MellingMelling, 2002) and the Siberian arctic (e.g. Reference Weslawski, Jankowski, Kwasniewski, Swerpel and RygZubov, 1963; Reference PolyakovPolyakov and others, 2002).
Characteristics of fast-ice formation and evolution in kongsfjorden differ from those in most other high-arctic locations. in kongsfjorden the fast ice forms later, with Slower growth and thinner maximum thicknesses. in comparison, the average maximum fast-ice thickness for a Site in the Siberian arctic near tiksi, laptev Sea, between 1934 and 2004 was about 2.25 m, with a Slight positive trend (personal communication from a. makshtas, 2005). Reference Brown and CoteBrown and cote (1992) found no evidence for Systematic ice thinning due to greenhouse-gas induced global warming, but they do report an anticorrelation with Snow depth at alert and resolute in arctic canada where increased Snow thickness led to less thick ice. this follows the results of Reference HoltsmarkHoltsmark (1955) who reported that Snow has a Strong influence on growth rates of Sea ice. generally, the insulating effect of Snow is a well- understood property of the ice–snow System and has been included in many models.
This paper gives an overview on fast-ice thickness in three fjords along the western coast of Spitsbergen, as well as the evolution of fast ice over a Season in more detail for one of the fjords, kongsfjorden. a major question to be addressed here is how much fast-ice thicknesses vary between different fjords along the western coast of Spitsbergen, and therefore to what degree one can extend findings from one fjord to the entire western coast. this becomes relevant when the Spitsbergen fast-ice monitoring data are combined with respective data from other arctic regions to address climate variability. for example, at barrow, alaska, USA, a mass-balance fast-ice monitoring project has been conducted Since 1999 (personal communication from h. eicken, 2005).
The Settlement of ny-ålesund on the Southern Shore of kongsfjorden hosts a large number of international research bases, from which a wide range of research projects and monitoring activities are conducted. kongsfjorden fast ice was recently investigated in the framework of both norwegian and german research activities, which concentrated on process Studies related to the energy and mass balance of fast ice (Reference Gerland, Winther, Ørbæk and IvanovGerland and others, 1999, Reference Gerland, Haas, Nicolaus and Winther2004; Reference Nicolaus, Haas and BareissNicolaus and others, 2003), and Since 2004 kongsfjorden fast ice has been the Subject of a Systematic monitoring project by the norwegian polar institute. however, thickness data from process Studies are also available for 1997–98, 2000 and 2002–03.
Research Area
All fjords investigated here are located along the western coast of Spitsbergen (fig. 1a). the fjords are influenced by warm atlantic water from the west Spitsbergen current, a branch of the north atlantic current, and by water masses from the barents Sea, which flow around Sørkapp. kongsfjorden has a depth of almost 400m at its centre, whereas the other fjords are less deep (hornsund ∽220m and van mijenfjorden ∽110 m; depths after Sksk (1999a, b)). in the inner parts, the fjords are usually not deeper than 90 m, often less. a brief description of the three fjords follows.
(a) Overview map of Spitsbergen. (b–d) Detail maps of Kongsfjorden (b), Van Mijenfjorden (c) and Hornsund (d). The areas of the detailed maps are marked in the overview map. Investigated Sites are marked in the detailed maps. A detailed Sea-floor topography is only available for Kongsfjorden (lines for 50, 100 and 300m depth are plotted in (b)).

Kongsfjorden
Kongsfjorden (fig. 1b) at 79˚n is the northernmost of the three fjords. it is about 25km long and 5–10 km wide. Sporadic information on fast-ice extent before the mid-1990s exists from biological Studies (Reference Lydersen and GjertzLydersen and gjertz, 1986; Reference MehlumMehlum, 1991; Reference Parker and MehlumParker and Reference MehlumMehlum, 1991). Some details about the fast-ice evolution in kongsfjorden are known from investigations Since 1997 (Reference Gerland, Winther, Ørbæk and IvanovGerland and others, 1999, Reference Gerland, Haas, Nicolaus and Winther2004; Reference Nicolaus, Haas and BareissNicolaus and others, 2003). according to observations Since 1997, fast ice forms in winter, relatively late, between december and february. the fast ice is heavily influenced by a group of islands (lovenøyane) that mark the border between the central and inner parts of the fjord. they protect and hold the fast ice in place, Sheltering the ice from Swell and waves, and in Spring the fast-ice edge often follows these islands. melt onset Starts around the beginning of june, but warm Spells with temperatures above 0˚c are not unusual during winter and Spring before melt onset. a review of the physical environment, including the hydrography of kongsfjorden, is given in Svendsen and others (2002). kongsfjorden is hydrographically connected by the kongsfjordenrenna to the north atlantic, and receives warm atlantic water masses from the west Spitsbergen current (Reference Ingvaldsen, Reitan, Svendsen and AsplinIngvaldsen and others, 2001; Reference Cottier, Tverberg, Inall, Svendsen, Nilsen and GriffithsCottier and others, 2005), which we See as the main factor for the late onset of ice formation. atlantic water enters kongsfjorden along the Southern coast and mixes with meltwater and runoff water in the inner part, before it exits the fjord on the northern edge. a few radionuclide tracer measurements (99tc) on Samples from Surface water indicate that the atlantic water also reaches the inner parts of kongsfjorden (Reference Gerland, Lind, Dowdall, Karcher and KolstadGerland and others, 2003). the wide mouth of the fjord, with krossfjorden in the north, enables ocean Swell from Storms to reach the central part of the fjord, which can break up the fast ice. under-ice water-current velocities were observed to be relatively low at Site kf4, with means of 0.027 ms–1 measured at 1.5 m below the Surface in april 2003 and 0.015 ms–1 measured in june 2003 (k. widell and f. nilsen, unpublished information).
Van Mijenfjorden
Located at 77˚450 n, van mijenfjorden (fig. 1c) is longer and narrower than kongsfjorden. it is 50km long and 5–14 km wide. in addition, a long island (akseløya) almost closes the mouth of the fjord. this both protects the fast ice in the fjord from Swell and prevents the ice from drifting away when first broken up. nevertheless, warm atlantic water reaches the fjord and circulates anticlockwise in the fjord. the main water exchange occurs north of akseløya, but the atlantic water flow continues first Southwards after entering the fjord. after that it follows the Southern Shore of the fjord eastwards. two Sites were investigated in connection with this Study (fig. 1c): a northern Site (vmn), located far enough in the fjord not to be directly influenced by the inflowing atlantic water, and a Southern Site (vms), more exposed to the atlantic water. at vms, water-current velocities were high (mean 0.14ms–1 at 10 m depth), compared with vmn and with northern kongsfjorden (personal communication from k. widell and f. nilsen, 2005). correspondingly, ablation at the Sea-ice underside is higher during melt periods at the Southern than at the northern Site.
Hornsund
Hornsund (fig. 1d; length 15 km, width 1–3 km) is the Southernmost of the investigated fjords, located at 77˚ n. annual means of air temperature recorded at the polish research Station hornsund during recent decades (1978–97) are Systematically higher than temperatures from longyearbyen (78˚14' n, 15˚30' e), which is located in isfjorden (see Reference Glowacki, Niedzwiedz and GlowackiGlowacki and niedzwiedz, 1997). for ice formation, more important winter means (november–march) from hornsund were about 2˚c higher than longyearbyen data, whereas Summer means (june–august) were about 1˚c lower. the hydrography of hornsund has Some Similarities with observations from kongsfjorden after investigations in the 1980s (Reference SvendsenWeslawski and others, 1991). however, those observations were obtained during the ice-free Season in Summer. as with kongsfjorden, hornsund fast ice is exposed to Swell coming in from the west. only the inner part is more protected, due to a 1 km narrow Sound.
Methods and Fieldwork
Thickness drilling
For direct thickness measurements, holes were drilled through the ice with an engine-driven 5cm auger (kovacs enterprises, USA). for long-term monitoring measurements at kongsfjorden, three holes each in the three corners of a triangle with 10m long edges were drilled to obtain an average thickness. ice thickness, Snow thickness and freeboard were measured using a tape-measure thickness gauge (kovacs enterprises, USA) with an accuracy to the nearest centimetre. when drilling for calibration of electromagnetic (em) measurements, Sites were Selected along profiles, and one hole was drilled per Site. repeated drillings for the longterm monitoring over level fast ice at kongsfjorden were carried out approximately every 2 weeks in the Same area on each Site (circle radius 40 m), while ensuring undisturbed ice was measured.
Electromagnetic profiling
Em induction is employed to measure the total thickness (snow plus ice thickness). Since the late 1980s, this method has been applied over a variety of Sea-ice regimes, multi-year Sea ice (Reference Haas, Gerland, Eicken and MillerHaas and others, 1997; haas, Reference Haas1998, Reference Haas2004), first-year ice (Reference Kovacs and MoreyKovacs and morey, 1991; Reference Gerland, Winther, Ørbæk and IvanovGerland and others, 1999, Reference Gerland, Haas, Nicolaus and Winther2004) and both (Reference HaasHaas, 1998; Reference HaasHaas and eicken, 2001), either with an instrument carried, pulled or placed over or on the ice, or Shipborne hanging from the bow or Side of a Ship (Reference HaasHaas, 1998; Reference Reid, Worby, Vrbancich and MunroReid and others, 2003), or airborne, from a helicopter (Reference Kovacs and MoreyKovacs and others, 1987). the measurements presented here were collected carrying a portable em instrument (geonics em31, geonics ltd, mississauga, canada) over the ice, placing it on the ice at intervals of 5 m along a profile and taking the conductivity reading. Snow thickness was measured in parallel with a Stake for a part of the profiles.
The em31 is a Single-frequency (9.8 khz) instrument with a receiving and transmitting coil (separation 3.66 m). the transmitting coil generates a primary field, inducing eddy currents within the conductive Subsurface. the resulting Secondary em field is measured, through compensation of the primary field, by the receiving coil. over Sea ice, the Secondary field is mainly induced in the highly conductive Sea water. the Strength of the Secondary field is directly related to the distance between instrument and Sea water. the accuracy of the method is about 10% over level Sea ice (Reference Haas, Gerland, Eicken and MillerHaas and others, 1997). the conductivity readings are mainly dependent on the distance to the Sea water, but they are also influenced by the conductivity of the Sea ice and Sea water, by possible water layers at the ice–snow interface and by the air temperature Since the air temperature might affect the properties of the transmitting and receiving coils of the instrument. in order to consider most of the possible factors contributing to the transfer function of the em conductivities measured relative to ice thickness, a calibration with direct thickness measurements from drillholes was applied for all fjords investigated. Since conditions can vary Significantly
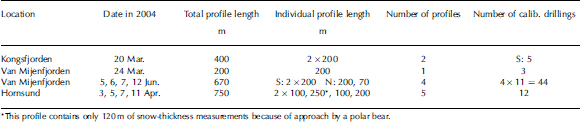
On different days and at different fjord locations, calibration drillings were done for all three fjords, and also for different Sites if they Seemed to be very different or if they were distant or if conditions changed. calibrating the instrument for Svalbard fjord ice is more difficult than for multi-year ice, because the range of thicknesses over level fjord ice at any location is quite narrow. the numbers of drillings are listed in table 1 along with all profiles and their lengths. calibration functions calculated for the individual Settings were found using a logarithmic function, following the method outlined in Reference Haas, Gerland, Eicken and MillerHaas and others (1997):
Overview on ground EM measurements on fast ice in Spring 2004. S Stands for South, N for north
With z i as the total thickness (ice plus Snow), σ as the measured electrical conductivity reading, and c 1–c 3 as calibration constants, which were determined with the help of parallel em and direct measurements in drillholes.
In total, Seven different functions were calculated for the processing of the data for this paper. changes of air temperatures during fieldwork at hornsund and van mijenfjorden required adjusted calibrations within the Same campaigns. for the van mijenfjorden work in june, the different ice properties at the northern and Southern location were accounted for in different functions. at the northern location in van mijenfjorden, we observed that a water layer at the ice–snow interface (7 june) appeared to be frozen on 12 june. em readings were Significantly lower, and an updated calibration function was used.
2004 Survey
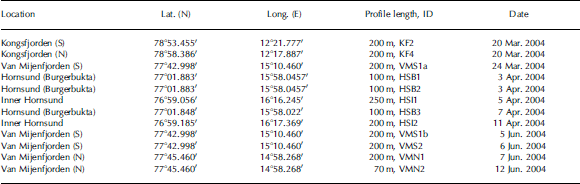
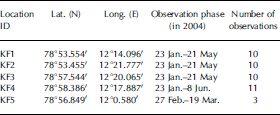
The fjords kongsfjorden (inner part) and van mijenfjorden (western part) on the western coast of Spitsbergen were Surveyed in march 2004. van mijenfjorden was also Surveyed in june, with the norwegian coastguard vessel kv Svalbard employed as a research base. the individual fieldwork activities lasted from a few days to up to 2 weeks. in april 2004, rv Lance conducted Survey work in hornsund. for an overview on all profiles, See the information in tables 1 and 2. in addition to these expeditions, longterm monitoring of ice thickness was conducted in the inner part of kongsfjorden, with personnel from the Sverdrup Station of the norwegian polar institute in ny-ålesund, measuring Snow and ice thickness by drilling on five fast-ice positions over the entire Season when ice covers the inner parts of kongsfjorden (see table 3). all measurements were limited to ice thick enough to carry people and equipment, meaning very thin ice could not be Studied here.
Em profiles with date, location, length and ID (for data See Fig. 2). S Stands for South, N for north
Ice-thickness monitoring at Kongsfjorden in 2004. Corresponding monitoring data of Snow thickness, ice thickness and freeboard are plotted in Figure 3a and b
Results
Kongsfjorden
Two Sites were investigated in detail, and both are located in the inner part of the fjord, one of them close to the Southern Shore (kf2), and one of them close to the northern Shore (kf4) of the fjord (fig. 1b). in addition, ice-thickness monitoring was undertaken at five Sites, including the two Sites with detailed observations (kf1–5): four of them in the inner part and one (kf5) in the central part of the fjord. at kf5, only three readings could be taken due to ice break-up. two 200m thickness profiles from kf2 and kf4 (fig. 2a) Show curves with Similar characteristics, and a lateral thickness variability of about 0.1 m. this variability was also observed in monitoring measurements from drillings, where the average from three drillings was taken for each Site. despite the fact that ice formation usually Starts in the northern inner part of kongsfjorden, the ice was observed to be thicker in the Southern part from em measurements in march (fig. 2a).
(a) Kongsfjorden thickness profiles (March 2004). Squares indicate measurements from the Southern Site KF2, triangles those from the northern Site KF4. (b) Van Mijenfjorden thickness profile from the Southern location VMS (March 2004). (c) Thickness profiles from the Southern location VMS at Van Mijenfjorden (June 2004). (d) Van Mijenfjorden thickness profiles from the northern location VMN (June 2004). (e) Hornsund thickness profiles from Burgerbukta (HSB) (April 2004). (f) Inner Hornsund (HSI) thickness profiles (April 2004).

Van Mijenfjorden
Two Sites were investigated, vms and vmn. they are located in the western part of the fjord, one of them near the Southern coast, the other on the opposite Side in the northern part of the fjord. the Southern location was visited twice, in march during the winter Season, and in june during the melt Season, while the northern Site was only visited in june. the measurements from march (fig. 2b) Show a profile Similar to those from kongsfjorden, with measured total thickness variations not larger than about 0.1 m. for measurements taken in june, both Snow and ice thicknesses differ Substantially when comparing the two locations vms (fig. 2c) and vmn (fig. 2d). data collected independently reveal ice thicknesses of 1.13 m (for 23 march 2004) and 1.15 m (for 22 april 2004) about 1 km east of vmn, and 0.75 ±0.05 m (for 22 april 2004), 0.65 ±0.05 m (for 2 may 2004) and 0.45 ±0.05m for 6 june 2004 for vms (k. høyland, unpublished data). these data in principle agree with the profiles presented here, and they Show, along with our data, a Substantial thickness change from march to june at vms compared to the area near vmn. the two profiles measured at vms (fig. 2c) exhibit different levels of thickness. it has to be noted that vms was located relatively close to land. profile vms1b Started from the eastern part of the research Site towards the Southern Shore, whereas vms2 Started from the western part of the research Site towards the north. the two Starting points were approximately 50m apart. it is assumed that the ice at vms2 was more exposed to the warm-water inflow, and therefore melting had progressed further than for vms1b. at vmn, melting had not properly Started (fig. 2d). the two profiles vmn1 and vmn2 were obtained in the Same area, not further than 100m from each other, but in different directions (vmn1 north–south, vmn2 east–west). here, the ice was Slightly thicker than at the Southern location in march. thickness variations along profile vmn1 (0–50 m) are dominated by Snow-thickness variations (fig. 2d). van mijenfjorden Snow thicknesses were generally less than in kongsfjorden and hornsund. from other investigations (ice-core texture inspection and oxygen isotope data; S. gerland and t. martma, unpublished information) it can be assumed that van mijenfjorden Snow was exposed to a high degree of Superimposed ice formation, where parts of the Snow layer covering Sea ice have turned into ice, which increases the ice thickness. Superimposed ice formation on Sea ice is a known process, and has been observed previously on Svalbard, at kongsfjorden (Reference Gerland, Winther, Ørbæk and IvanovGerland and others, 1999, Reference Gerland, Haas, Nicolaus and Winther2004; Reference Nicolaus, Haas and BareissNicolaus and others, 2003), but also in other regions Such as the baltic Sea/gulf of finland (Reference KawamuraKawamura and others, 2001) and in the antarctic (Reference Kawamura, Ohshima, Takizawa and UshioKawamura and others, 1997, Reference Kawamura, Jeffries, Tison and Krouse2004; Reference Haas, Thomas and BareissHaas and others, 2001).
Hornsund
Two Sites were investigated: burgerbukta (hsb, fig. 2e) and inner hornsund (hsi, fig. 2f). the three profiles at burgerbukta were taken in the Same area, i.e. within approximately 500 m. ice-thickness profiles from burgerbukta (fig. 2e) appear Similar to those measured in kongsfjorden and van mijenfjorden. by contrast, thickness profiles from inner hornsund exhibit a larger variability in total thickness, mainly dominated by Snow-thickness variations (fig. 2f). in general, Snow thickness varies more than for the other fjords (although this comparison is Somewhat limited Since fewer Snow-thickness data could be obtained in winter for kongsfjorden and van mijenfjorden). Snow-thickness variations could be due to local wind conditions, but it is difficult to Speculate about this without using wind data from that Site.
Long-term monitoring
The winter of 2003/04 was a case with relatively early ice formation, So that thicknesses of about 0.5 m were already reached in january (fig. 3a). the northern part (kf3 and kf4) had more Snow and less intense ice growth compared to the inner Southern part (kf2), where Snow was less thick. this north–south difference also appears in the em profiles measured in march 2004 (fig. 2a). Site kf1 had most Snow early in the monitoring period. the westernmost Site, kf5, could only be visited three times. here, ice formed later than at the other locations. towards march, the Snow thickness increased and freeboard became negative (fig. 3b). air temperature in ny-ålesund (fig. 3c) Shows warm Spells, especially in march, which caused ice growth to Slow. in may, major parts of the Snow turned into ice (superimposed-ice and/or Snow-ice formation), adding to the ice thickness, and as a result freeboard became positive again (fig. 3b). it is interesting that the maximum Snow thickness is reached at different times for the individual Sites (from early march for kf1 to early april for kf2). the onset of melt occurred at the end of may/beginning of june, as observed in previous years (Reference Gerland, Winther, Ørbæk and IvanovGerland and others 1999), with the air temperature Staying permanently above 0˚c.
Monitoring time Series for Kongsfjorden, 2004. See legends for Symbols, colours and Sites. (a) Ice thickness (Z ice) and Snow thickness (Z snow). (b) Freeboard (FB). Monitoring-site positions and parameters are listed in Table 3. Each value plotted represents the mean of three measurements in the corners of a 10m triangle at each Site. (c) Air temperature at Ny-Ålesund, January–July 2004. Dates are dd-mm-yy.

Observations Since 1997 Show that maximum ice thickness (fig. 4) varies between 0.59 and 0.92 m (average 0.71 m), and maximum Snow thickness varies between 0.17 and 0.30m (average 0.21 m; observations between 1997–98, 2000, 2002–05; Reference Gerland, Winther, Ørbæk and IvanovGerland and others, 1999; Reference Nicolaus, Haas and BareissNicolaus and others 2003). the maximum ice thickness exhibits a Significant interannual variability, as also do the related parameters ice extent and onset of ice formation.
Maximum ice and Snow thickness in inner Kongsfjorden for years 1997–2005, except 1999 and 2001 (no data available). Data from 2002 are from Reference Nicolaus, Haas and BareissNicolaus and others (2003). Means are 0.71 for ice (grey Solid line) and 0.22 for Snow (dashed line). Data before 2004 are from the northern inner part of Kongsfjorden. Data from 2004 and 2005 are from the available monitoring Sites (KF1–5 in 2004, KF1–4 in 2005).

Discussion
A Summary of the fast-ice and Snow characteristics found in the three fjords is provided in table 4. the northern part of kongsfjorden experienced the deepest Snow, while van mijenfjorden had the least Snow, as probably most of the Snow had turned into Superimposed ice prior to the measurements at the end of march 2004. hornsund Snow was laterally most variable in thickness. in Southern kongsfjorden, the Snow thickness was less than in northern kongsfjorden, probably due to wind erosion. Site kf2 is known to be exposed to local winds from the east. the kongsfjorden monitoring data (fig. 3a and b) Show that the Snow thickness is important for the ice growth rates. ice growth rates are highest (for kf2, kf3 and kf4 at the beginning of february, and for kf2 at the beginning of march) when Snow thickness is less than at other locations.
Mean, median, maximum and minimum values for total ice thickness from EM measurements and for direct Snow measurements and Kongsfjorden monitoring drillings (all in metres). For Kongsfjorden, both data in connection with EM Surveying are given, and those with both EM Surveying and monitoring (in parentheses). Kongsfjorden Snow data are based on four (thirteen) measurements for each Site. Drillhole ice thicknesses from monitoring were Summarized in means for each 10m triangle. March Snow data for Van Mijenfjorden South are based on nine measurements. KF: Kongsfjorden (and Site No.); VMS: Van Mijenfjorden South; VMN: Van Mijenfjorden north; HSB: Hornsund Burgerbukta; HSI: inner Hornsund
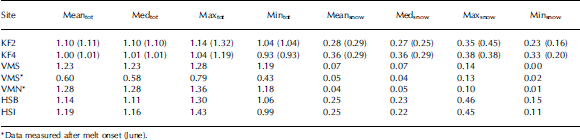
Total thickness (snow plus Sea ice) was highest in van mijenfjorden, Slightly less in hornsund and least in kongsfjorden. however, kongsfjorden measurements were obtained earlier than the other measurements, So mean ice thicknesses for hornsund and kongsfjorden probably did not differ as much as observed for the Same time in april. the monitoring data Support that assumption, but they are Small in number compared to the em data, So they do not Significantly alter the total thickness means for kongsfjorden, when considered (see data in parentheses in table 4). the hornsund data Show that the Stronger variability in thickness is mainly due to Snow-thickness variations (fig. 2f). data collected in van mijenfjorden in june 2004 exhibit a Strong difference in thickness between the northern and Southern locations. the assumption that this is due to ice ablation at the underside of the Sea ice due to warm-water influence is Supported by thickness data collected independently between march and june 2004 (k. høyland, unpublished information).
Despite the fact that the data were collected at three different fjords, a Summary of all total thickness data from em measurements and monitoring at kongsfjorden during march and april has been computed. most data gathered in a relatively narrow range of thicknesses between 1.00 and 1.25m (fig. 5a). most of the Snow is 0.15–0.30m deep (fig. 5b). the modal total ice thickness is 1.075 m and the modal Snow depth is 0.225m (bin width 0.05 m, respectively). for the total thickness, a Second mode appears at 1.225 m. data from the topographically protected, inner part of kongsfjorden mostly contribute to the thinner mode, while van mijenfjorden data contribute to the thicker mode. the hornsund data contributed to both modes and the range in between. See also the means in table 4.
Probability density functions (PDFs) for total thickness (ice plus Snow) (a) and Snow thickness (b) for Kongsfjorden, Van Mijenfjorden and Hornsund for all data measured during March and April, before melt onset. The Snow+ice dataset has 296 individual measurements, and the Snow dataset consists of 164 Single measurements. Kongsfjorden monitoring data are means of three individual measurements in a 10m triangle at each Site.

Long-term monitoring in kongsfjorden (figs 3 and 4) has revealed that the maximum thickness of Seasonal fast ice is less than in most places in the north american arctic. the west Spitsbergen current contains relatively warm atlantic water, and winters in western Svalbard are on average milder than winters in the north american arctic (for long-term air-temperature means at Svalbard See Reference Hanssen-Bauer and FørlandHanssen-bauer and førland, 1998). as a consequence, ice formation Starts later and ice growth is Slower along the west coast of Spitsbergen.
Applying a Simple one-dimensional ice growth model following Stefan’s law (Reference Maykut and UntersteinerMaykut, 1986) for the time prior to Superimposed ice formation, one can See even from the limited number of ice-thickness monitoring measurements for kongsfjorden during february 2004 that the calculation results in Slightly higher freezing rates than observed (fig. 6). the model was applied for Sites kf1 and kf3, Starting with the day of the first observation and the initial thickness observed then. the model was driven using air-temperature observations from ny-ålesund (fig. 3c) and a Step function with the Snow thicknesses as observed at the two monitoring Sites. towards the end of february and beginning of march, no Significant difference in freezing rates between model and observations is visible (when ignoring the outlying maximum value of the measured kf3 data). one could Speculate that a change in water mass below the ice from relatively warm early in the Season to cold later in the Season could explain why the freezing rates in the model and the observations initially disagree but then agree. in 2004 the maximum ice thickness was not reached until may, after Superimposed ice formation added to the ice thickness. interestingly, kf2, the Site with the latest ice growth and latest (but thickest) Snow cover, exhibited the thickest ice when compared to the other monitoring Sites in kongsfjorden (fig. 3a).
Ice-thickness observations for Sites KF1 and KF3 at Kongsfjorden, and modelled ice thickness (solid and dashed lines) using a Simple Stefan’s-law-based model. For the Snow thickness in the model, a Step function using the observed Snow thicknesses was used.

Maximum ice thicknesses for kongsfjorden observed Since 1997 (fig. 4) Show that 2004 was a year with relatively thick ice. early ice formation, low temperatures in parts of january and february and conditions for Superimposed ice formation all contributed to this. however, the range of maximum ice thickness observed in kongsfjorden over Several years indicates that it is not yet possible to Say what a ‘typical’ ice Situation and thickness is for kongsfjorden for a certain time of year.
Conclusions
This Study gives an overview on fast-ice thicknesses in fjords in west Spitsbergen, an area from which few fast-ice thickness data have So far been published. the fast ice of three Svalbard fjords, all located at the west coast of Spitsbergen, was investigated during Spring 2004. the distribution of total thicknesses was bimodal, with the largest mode at 1.075 m. previous work, observations and Simple model Studies indicate that factors that limit the ice growth and maximum ice thicknesses in the research area are connected to atmospheric and oceanic forcing. differences in Snow and ice thickness between the three fjords Show that Snow and ice thickness is not consistent in the three fjords. however, the total ice thickness varies over a relatively limited range, and local conditions for the three fjords could explain the differences observed. given our limited knowledge of the interannual variability of the climatic parameters in the research area, together with the limited number of data collected, we cannot conclude that the Scenario observed in 2004 is typical, or that in other years the fast-ice thickness would be relatively consistent in the three fjords. more research and observations are necessary. Superimposed ice formation is a factor that is difficult to account for without accurate information on the local conditions (meteorology, amount of precipitation). detailed Studies of ocean heat fluxes and local meteorological conditions could probably explain the differences between the three fjords, and Should be employed in future. as important as new measurements is the use of older data that might exist from industrial records for the research area. perhaps this Study will Stimulate the Search for and analysis of data that possibly exist.
Acknowledgements
We thank a. bäcklund, e. hansen, c.a. pedersen, a. Sund-fjord, v. alexandrov, k. edvardsen and b. hamre for assisting with field measurements. a. renner helped with the calculation of calibration curves. we thank k. høyland for permission to use Some unpublished ice-thickness measurements from van mijenfjorden. we are grateful for discussions with j. haarpaintner, t. kawamura, a. makshtas, f. nilsen and k. widell. captains and crews of the Ships rv Lance and kv Svalbard are acknowledged for their help. air-temperature data for ny-ålesund were collected by the norwegian meteorological institute. constructive criticism from two anonymous reviewers is gratefully acknowledged. this work was performed in the framework of projects funded by the research council of norway (atmosphere–ice–ocean interaction Studies in Svalbard fjords; Seals, bears and ice), by the project Sathav (funded by the norwegian Space centre) and the norwegian polar institute.



