Introduction
Honey bees (Apis Mellifera) are essential to global agriculture and biodiversity, performing critical ecological services through pollination. Acting as highly organised superorganisms, they support the reproduction of over 75% of global food crops and a vast array of flowering plants, contributing directly to food security and ecosystem resilience (Klien et al., Reference Klein, Vaissière, Cane, Steffan-Dewenter, Cunningham, Kremen and Tscharntke2007; Engelsdorp et al., Reference Engelsdorp, Hayes, Underwood and Pettis2008; Moritz and Southwick, Reference Moritz and Southwick2012). In addition to their ecological significance, bees hold substantial economic and industrial importance, generating honey, royal jelly, wax, and propolis, which are used in pharmaceuticals, cosmetics, and nutraceuticals. Recent statistics indicate that approximately 79% of crop production designated for human consumption relies on pollination services rendered by bees (Moritz and Southwick, Reference Moritz and Southwick2012). Despite their biological importance, bee colonies across the globe are facing an alarming decline, driven by a combination of anthropogenic and natural stressors. Pervasive threats such as parasitic infestations (e.g. Varroa destructor), pesticide exposure, nutritional deficiencies, pathogen load, habitat fragmentation, and climate variability have led to substantial colony losses and the intensification of Colony Collapse Disorder (De Jong and Lester, Reference De Jong and Lester2023; Duffus et al., Reference Duffus, Echeverri, Dempewolf, Noriega, Furumo and Morimoto2023, Rathore and Agrawal, Reference Rathore and Agrawal2026) The aforementioned stressors jeopardise bee health, thereby endangering agricultural productivity, food supply chains, and ecological equilibrium (Aizen et al., Reference Aizen, Garibaldi, Cunningham and Klein2009; Tscharntke et al., Reference Tscharntke, Clough, Wanger, Jackson, Motzke, Perfecto, Vandermeer and Whitbread2012). Estimates indicate that diminished pollination may lead to a 3–8% reduction in global crop yields, underscoring the critical necessity for enhanced apicultural management strategies. Beekeepers mitigate these risks by employing suitable farming techniques, pesticides, and treatments. However, the results are inconsistent, and honeybee health and production are often compromised (Alves et al., Reference Alves, M.a, Ventura, Neves, Biron and Junior2020).
Intelligent Hive Monitoring System (IHMS), using Internet of Things (IoT) and machine learning (ML), has been gaining significant attention from researchers for many years, as they strive to develop a streamlined system that benefits beekeepers and alleviates the burden of hive inspections. Automated beekeeping or precision beekeeping (PB) is a specialised field within precision agriculture that involves a strategic approach to manage apiaries that aim to reduce stress and unnecessary activities of bee colonies, optimise resource usage, and maximise bee productivity (Zacepins et al., Reference Zacepins, Stalidzans and Meitalovs2012). IHMS, from a practical perspective, encompasses not only the use of intelligent technologies in beekeeping but also a comprehensive understanding of nutritional, pathological, physiological, and genetic factors associated with the bees. Technology plays a crucial role in assisting beekeepers, but it is not without its limitations. While it can provide valuable support, it cannot completely replace the beekeeper’s expertise and involvement. This study aims to elucidate various intelligent apiculture supervision services in apiary management and to assess the current status, obstacles, and developmental prospects of IHMS.
The deployment of IHMS has revolutionised conventional manual management methods, leading to enhanced automation and operational efficiency. These systems enable ongoing real-time observation of bee colonies, significantly minimising the effort and time needed for manual inspections (Alleri et al., Reference Alleri, Amoroso, Catania, Lo Verde, Orlando, Ragusa, Sinacori, Vallone and Vella2023). Furthermore, the integration of artificial intelligence (AI) has significantly improved the analytical capabilities of these systems, enabling the identification of subtle shifts in bee behaviour and health that may otherwise remain undetected, as well as facilitating predictive analytics to proactively tackle potential challenges (Marchal et al., Reference Marchal, Buatois, Kraus, Klein, Gomez-moracho and Lihoreau2020; Dimitrijevi´ and Zogovi´, Reference Dimitrijevi´ and Zogovi´2022). Thus, these advanced IoT- and AI-based beekeeping systems accurately assess colony strength, strengthen hive management strategies, and facilitate a fully integrated system within PB to ensure optimal bee colony health and productivity (Zacepins et al., Reference Zacepins, Kviesis, Komašilovs and Muhammad2020; Alleri et al., Reference Alleri, Amoroso, Catania, Lo Verde, Orlando, Ragusa, Sinacori, Vallone and Vella2023).
Predictive modelling in the IHMS specifically examines the two major factors affecting colony strength: (i) bee activity and (ii) disease infestations. Colony monitoring involves the systematic observation and examination of the internal conditions and behavioural patterns present within the beehive. Meanwhile, threats encompass investigations into the identification and examination of pest attacks, which have a direct impact on colony populations. This survey conducted a systematic analysis of research integrating IoT and AI, using significant prior advancements in system configurations and methodologies to evaluate existing IHMS research. Furthermore, we surveyed the techniques, solutions, and applications provided by the commercial IHMS. This study also summarises the evolution of technical methodologies, providing valuable references for the enhancement of the efficiency and outcomes of research on IHMS. By analysing current research challenges, this study offers insights into potential future directions for IHMS for optimising bee health and productivity.
This review article aims to systematically explore the current landscape, applications, and limitations of predictive, AI-enabled IHMSs. It aims to
• Assess the evolution of technological methodologies used in IHM, particularly sensor architecture and ML frameworks;
• Analyse the application of predictive analytics in assessing bee activity, environmental stress, and colony strength;
• Discuss the operational, ecological, and economic implications of deploying IHMSs;
• Identify current limitations and propose future research directions for making precision apiculture more adaptive, scalable, and sustainable.
Materials and methods
To effectively analyse IoT-based PB or IHMSs aimed at improving bee colony strength, a structured and rigorous methodology was developed. The approach ensured consistency, reliability, and depth in evaluating existing research. In this research, a systematic approach for searching and screening relevant literature, adhering to the guidelines specified in the Preferred Reporting Items for Systematic Reviews and Meta-Analyses (Page et al., Reference Page, McKenzie, Bossuyt, Boutron, Hoffmann, Mulrow, Shamseer, Tetzlaff, Akl, Brennan, Chou, Glanville, Grimshaw, Hrõbjartsson, Lalu, Li, Loder, Mayo-wilson, McDonald, McGuinness, Stewart, Thomas, Tricco, Welch, Whiting and Moher2020), was adopted. The initial search strategy included an extensive search across ScienceDirect, IEEE Xplore, PubMed, and Scopus databases for colony monitoring, threat detection, swarming, and traffic analysis using IoT and ML. Due to the various terms used for automated beehive monitoring, the search terms used were Precision Beekeeping OR Smart beekeeping OR Honeybee Monitoring. After collecting a diverse set of research articles, a systematic literature filtering process was employed to refine the dataset based on clearly defined inclusion criteria. Studies were selected based on (i) Studies integrating IoT technologies in PB systems, (ii) Research focused on enhancing bee colony strength, (iii) Publications in peer-reviewed journals or reputable conferences, and (iv) Research articles written in English. This stringent selection process excluded dissertations, non-peer-reviewed sources, and articles focusing solely on biological or physiological aspects. After scrutinising, a total of 211 articles were collected and studied. A total of 117 papers were found relevant to this survey, ensuring a high standard of quality and relevance. Finally, an in-depth analysis of filtered research articles, categorising them into key areas such as smart hive monitoring, disease detection, environmental impact, and productivity optimisation, was conducted. The study also assesses the trends in the contribution of IoT, ML, and computer vision techniques in PB methods. This methodological approach ensured that only the most credible and impactful studies were included, providing a comprehensive foundation for analysing PB advancements in IoT and data-driven beekeeping technologies. Figure 1(A) shows the trend of the number of papers published in the last 10 years, and fig. 1(B) shows the number of papers examined in the survey.
(A) The trend of number of paper published in last 10 years and (B) the number of papers examined for the surveyed.

Figure 1 Long description
A stacked bar graph. The x axis label is Year. The x axis values are 2014, 2016, 2018, 2020, 2022, 2024. The y axis label is Total number of papers. The y axis range is 0 to 25. A legend lists Colony monitoring, Traffic analysis, Threat analysis, Swarm analysis. Stacked bar values by year are shown as increasing totals from about 4 in 2014, about 8 in 2016, about 8 in 2018, about 15 in 2020, about 18 in 2022, about 25 in 2024. The image B showing a stacked bar graph. The x axis label is Year. The x axis values are 2014, 2016, 2018, 2020, 2022, 2024. The y axis label is Contribution of the methods for monitoring percent. The y axis range is 0 to 100. A legend lists Internet of Things, Machine learning, Computer vision. Each year shows a full height stacked bar to 100 percent. The lower segment is about 80 percent in 2014 and decreases to about 45 percent by 2020, then is about 45 to 50 percent through 2024. The middle segment increases from about 10 percent in 2014 to about 35 percent by 2018 and stays around 30 to 40 percent through 2024. The top segment is about 10 percent in 2014 and increases to about 20 percent by 2020 and stays around 15 to 20 percent through 2024.
Framework of the IoT-IHMS
The implementation of an IHMS requires a stable system configuration for data acquisition and complex computational analysis. The architecture of the cloud-based system includes various hardware and software components, as shown in fig. 2. The architectural framework primarily includes a data acquisition system, database server, and back-end platform. Collecting data in IHMS is the first and essential step (Andrijević et al., Reference Andrijević, Urošević, Arsić, Herceg and Savić2022). In the IHMS, data can be categorised at two levels: colony level and Apiary level (Zacepins et al., Reference Zacepins, Brusbardis, Meitalovs and Stalidzans2015). Typically, a variety of sensors embedded inside the beehive that are connected to the processing system are used to measure temperature, humidity, pressure, flame, and weight to measure colony-level parameters. Sensors placed outside the hive are used to measure apiary-level data such as video, rainfall, and meteorological data. These sensors are shielded from direct weather impacts to prevent any interference with the precision of the readings. Additionally, two cameras and a microphone are positioned inside and outside the box for the purpose of acquiring audio-visual data.
Cloud-based automatic beehive monitoring network architecture.

Figure 2 Long description
Cloud-based beehive monitoring network architecture. It includes environmental factors like temperature, humidity and light, represented by icons. An IoT module connects to four hives labeled Hive 1, Hive 2, Hive 3 and Hive 4. These hives are linked to a local database server via 802.15.4 connections. The server connects to a Wi-Fi router, which then connects to an SQL database. The SQL database is accessible via the Internet to three remote users labeled Remote user 1, Remote user 2 and Remote user 3. A power supply is shown with icons for electricity and wind energy. The top section highlights research issues and statistical analysis, including pesticide effects on honey bees, optimal environment analysis for bee activity and environmental factors of beehives.
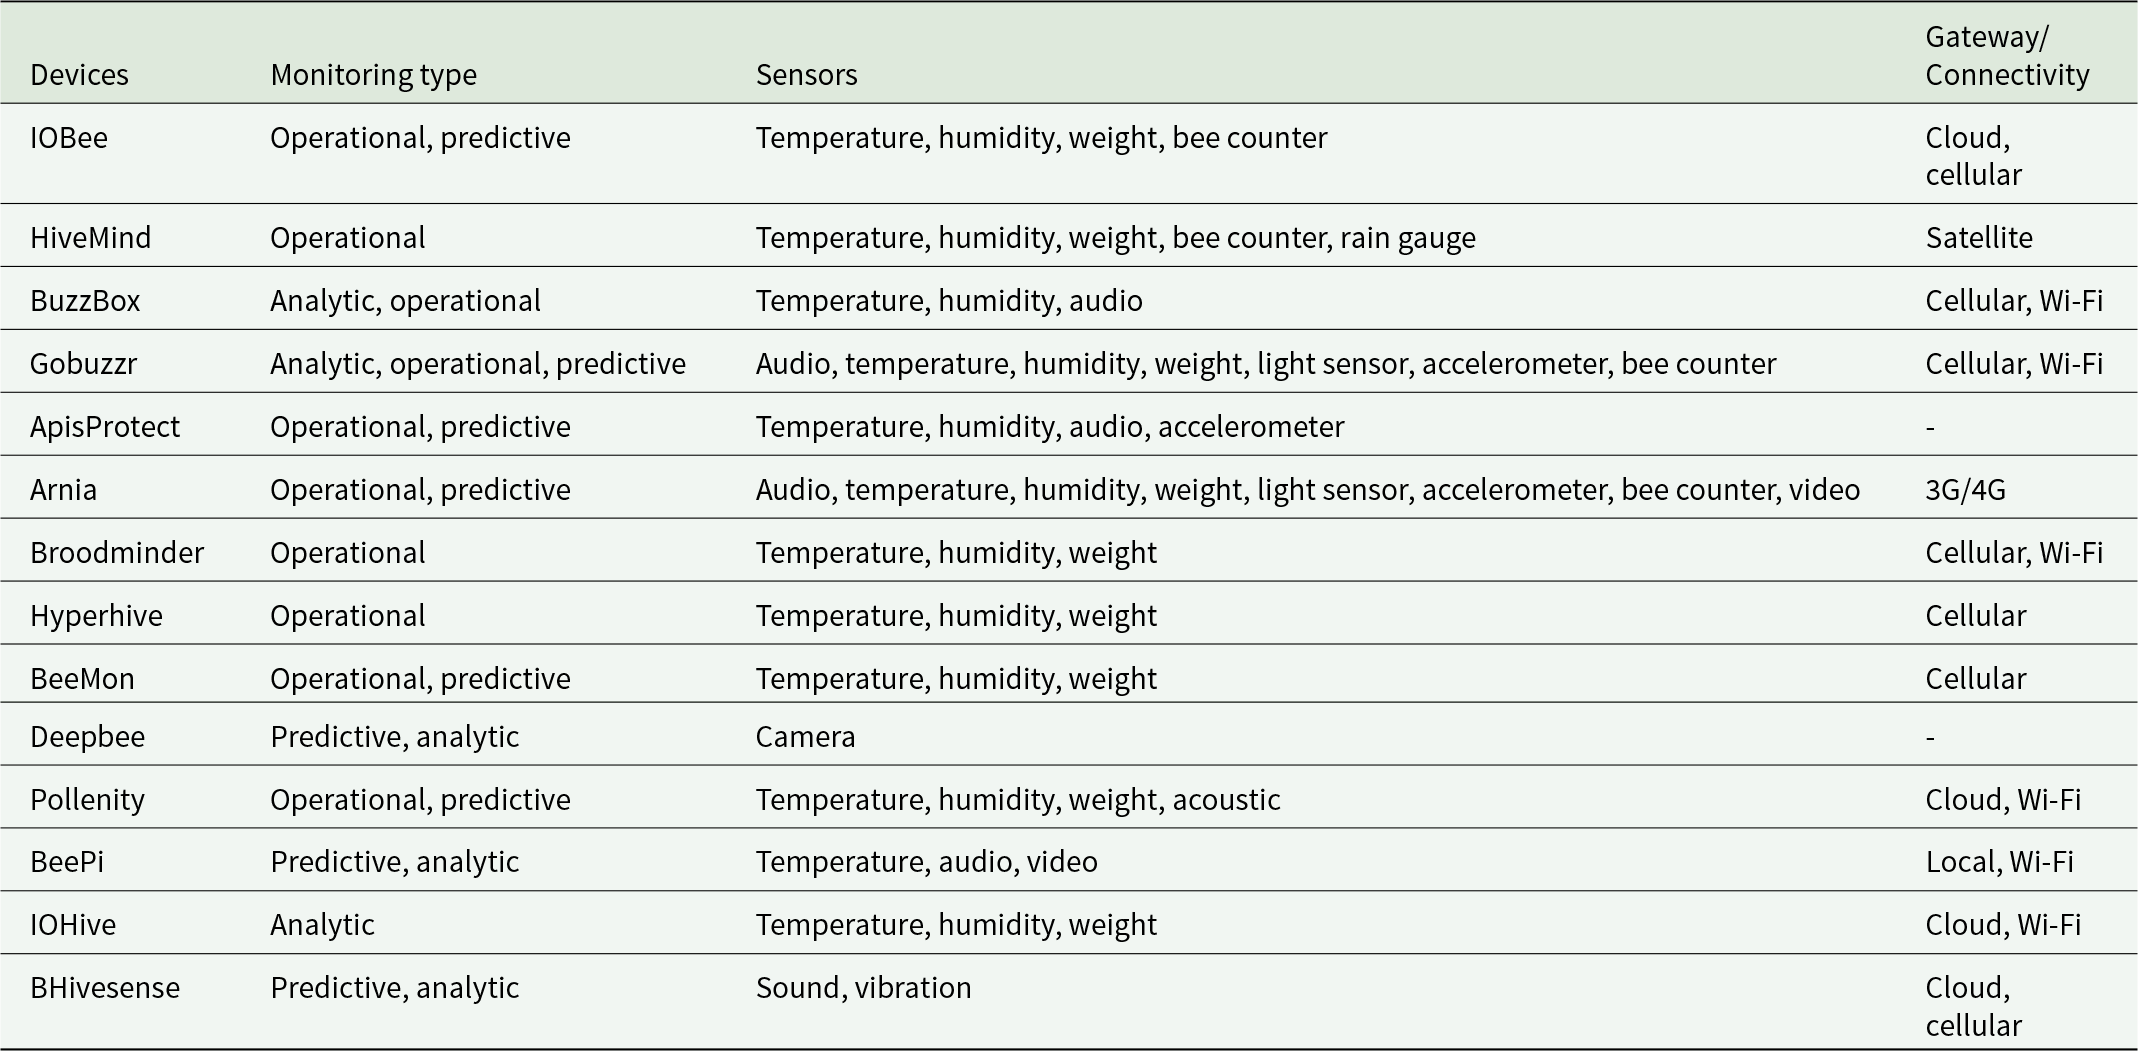
All the data-collecting devices are further attached to the base station. The main unit microprocessor controls the entire system, communicating with microcontrollers to collect data that are then sent to the cloud system and web database via GPRS. The information is also stored in local storage. The control system contains an IOT module located at each hive that requests, collects, synchronise and processes all the data at specific time intervals and transmits them to the cloud gateway via wireless personal area network like ZigBee (Murphy et al., Reference Murphy, Magno, Whelan and Vici2015, Reference Murphy, Magno, Whelan, O’halloran and Popovici2016; Hong et al. Reference Hong, Xu, Chi, Cui, Yan and Li2020), Wi-Fi, or cellular modem. The cloud storage server receives data from the base station via wireless sensor networks (WSNs) and process the data. WSNs are a key technology for building an automated beehive monitoring system that collects data from multiple sensors at specific intervals and transfers it to a data management and control system. In addition, wireless sensor nodes possess compact designs and consume less power (Howard and Hunter, Reference Howard and Hunter2018; Ochoa et al., Reference Ochoa, Gutiérrez and Rodriguez2019; Zabasta et al., Reference Zabasta, Zhiravetska, Kunicina and Kondratjevs2019). They establish communication with one another using radio frequency, eliminating the need for wiring (Abu, Reference Abu2020). In the cloud data server, MySQL is also integrated, and each hive’s local database is replicated. This server provides increased security by storing and delivering data from each beehive to the cloud in case of communication failure. Table 1 summarises the commercial predictive and analytical tools using IoT and ML.
Summary of few commercial hive monitoring products utilising predictive and analytic monitoring using IoT module and sensors

Table 1 Long description
Columns are Devices, Monitoring type, Sensors, and Gateway or Connectivity for 14 hive monitoring products. IOBee is operational and predictive with temperature, humidity, weight, and bee counter, using cloud and cellular. HiveMind is operational with temperature, humidity, weight, bee counter, and rain gauge, using satellite. BuzzBox is analytic and operational with temperature, humidity, and audio, using cellular and Wi-Fi. Gobuzzr is analytic, operational, and predictive with audio, temperature, humidity, weight, light sensor, accelerometer, and bee counter, using cellular and Wi-Fi. ApisProtect is operational and predictive with temperature, humidity, audio, and accelerometer, with gateway or connectivity shown as a dash; Deepbee is predictive and analytic with camera, with gateway or connectivity shown as a dash. Arnia is operational and predictive with audio, temperature, humidity, weight, light sensor, accelerometer, bee counter, and video, using 3 G or 4 G. Broodminder and Hyperhive are operational with temperature, humidity, and Weigh, using cellular and Wi-Fi for Broodminder and cellular for Hyperhive. BeeMon is operational and predictive with temperature, humidity, and weight, using cellular; Pollenity is operational and predictive with temperature, humidity, weight, and acoustic, using cloud and Wi-Fi. BeePi is predictive and analytic with temperature, audio, and video, using local and Wi-Fi; IOHive is analytic with temperature, humidity, and weight, using cloud and Wi-Fi; BHivesense is predictive and analytic with sound and vibration, using cloud and cellular.
Multimodal data acquisition and sensor fusion
Data collected from beehives were an important indicator for analysing changes and conditions in the colony, and a systematic analysis method is required for data interpretation. The accuracy of observing bee behaviour depends greatly on this collected data. To acquire and analyse data in real time, different types of sensors, such as temperature, humidity, weight, vibration, and camera are carefully positioned both within and outside the hive boxes, depending on specific hive parameter being monitored. Irrespective of their purpose, whether it is conducting research, beekeeping, or raising awareness about different issues like the environment, the primary objective of automated hives is to provide real-time data about the colony’s health and the quality of its internal environment. For predictive analysis, generally three parameters are calculated: (i) apiary-level parameters, (ii) colony-level parameters, and (iii) Environmental data. Apiary-level parameters monitor flight activity, foraging activity, and swarming activity. The analysis of bee in–out activity predicts their behavioural changes to environmental conditions, food supplies, and predator’s presence (Abu, Reference Abu2020; Hadjur et al., Reference Hadjur, Ammar and L2022). Colony-level parameters sense the internal state of the hive. Capturing, analysing, and interpreting sound and vibration data within the hive environment reveal information about hygienic behaviour, presence of queen, weight change etc. (Ferrari et al., Reference Ferrari, Silva, Guarino and Berckmans2008; Meikle and Holst, Reference Meikle and Holst2015; Gil-lebrero et al., Reference Gil-Lebrero, Quiles-Latorre, Ortiz, Sánchez, Gámiz-López and Luna-Rodríguez2016; Odemer and Odemer, Reference Odemer and Odemer2019). Table 2 illustrates the various in-hive and out-hive parameters and acquisition devices used for predictive analysis of beehives. The precision in data interpretation and prediction is significantly influenced by the positioning of data acquisition devices.
Various in-hive and out-hive parameters and measuring tools

Table 2 Long description
Parameters are grouped into colony level, apiary level, and environmental parameter, with a second column listing the type of sensor and tools used. Colony level parameter includes temperature with a temperature sensor; vibration with an accelerometer or electromechanical system; acoustics with a microphone; weight with an electronic and mechanical weighing scale; humidity with a capacitive or piezo resistive sensor; gases, O2 and CO2, with a gas sensor; atmospheric pressure with a pressure sensor or weighing scale; brood health with a camera; and food resources with a digital camera. Apiary level parameter includes forager traffic with an optical and digital camera or a bee counter; atmospheric pressure with a pressure sensor; colony thermal image with a thermal camera or webcam; presence of mite with a digital or optical camera; and hygienic behavior with a digital camera. Environmental parameter includes wind and rain measured by weather station or satellite observation; light with a light sensor; temperature with a temperature sensor; and pollutants with a pollutant sensor.
However, real-time and accurate data acquisition is challenging. Many researchers, however, lacked specificity on the positioning of sensors, increasing the likelihood of performance degradation in reproducibility due to potential data collection errors. Another challenge in accurate data acquisition is climatic conditions. In winter, the weight decreases as foraging is least and bees consume the stored honey [Flores et al., Reference Flores, Gil-lebrero, Gamiz, Rodríguez, Ortiz and Quiles2019]. Throughout the day, the hive’s weight fluctuates in a predictable pattern: it decreases by approximately 300–500 g in the morning when bees leave to gather food, then gradually rises as bees return with pollen and nectar until just before sunset. At night, this value may drop because bees consume honey [Hunter et al., Reference Hunter, Howard, Gauvreau, Duran and Busquets2019]. Catania and Vallone (Reference Catania and Vallone2020) observed a fall of 200 g each night throughout the observation period.
Apart from sensor data, AI- and IoT-based IHMS provide analyses of hive parameters using Image and sound data. Image data provide visual insight into hive conditions, bee activity and colony strength that are difficult to capture through manual observation, enabling beekeepers and researchers to monitor the internal and external structure of hive, including comb arrangements, brood patterns, and honey storage. A camera monitoring system is positioned near the hive entrance (about 30–40 cm above) to observe the bee traffic, activity, and flight patterns. Infrared imaging reveals temperature variation in the hive, highlighting brood nest activity and queen absence (Marković et al., Reference Marković, Pešović, Djurasevic and Randjić2016). With image data, we can access the following information: swarming behaviour, foraging behaviour, flight pattern (Lee et al., Reference Lee, Choi, Lee and Yoon2020; Bermig et al. Reference Bermig, Odemer, Gombert, Frommberger, Rosenquist and Pistorius2020), Disease outbreak (Jeon, Reference Jeon2023; Kwon et al., Reference Kwon, Lee, Bak and Jung2024) Colony strength (Alves et al., Reference Alves, M.a, Ventura, Neves, Biron and Junior2020), and brood pattern (Rathore and Agrawal, Reference Rathore and Agrawal2024).
Honey bees produce distinct sounds when exposed to airborne toxins, predatory mites, and loss of queen bee (Peng and Ardekani, Reference Peng and Ardekani2020). Honey bees produce vibro-acoustic signals via their body movements, wing movements, high-frequency muscle contractions, and pushing the thorax against substrates (Hunt and Richard, Reference Hunt and Richard2013). Honey bees emit 17 short pulsed sounds before and after emerging. Before emerging, queen bees make a sequence of short vibrations at a frequency 350 Hz; after emerging, they emit noises at 400 Hz for the first day and 500 Hz for 2–4 days (Uthoff et al., Reference Uthoff, Homsi and Bergen2023; Abdollahi et al., Reference Abdollahi, Giovenazzo and Falk2022) and frequency exceed up to 1500 Hz before swarming (Zlatkova et al., Reference Zlatkova, Kokolanski and Tashkovski2020). They emit a hissing sound from 300 to 3600 Hz when attacked by hornets (Vespa spp.) and bee-eaters (Merops apiaster) (Tashakkori et al., Reference Tashakkori, Buchanan and Craig2020).
ML-based predictive modelling
Figure 3 shows the bee image and acoustics data processing pipeline. Feature extraction is an important process as it contains important information such as the value of magnitude spectrum at a particular instant in time. For the analysis of audio-visual data, several computer vision techniques (Bjerge et al., Reference Bjerge, Frigaard, Mikkelsen, Nielsen, Misbih and Kryger2019) were proposed by researchers to detect and classify bee activities and behaviours. The audio-visual data analysis basically involves three steps: (i) data preprocessing, (ii) feature extraction, and (iii) detection and classification. (Alves et al., Reference Alves, M.a, Ventura, Neves, Biron and Junior2020; Rathore et al., Reference Rathore and Agrawal2024). Audio-visual data preprocessing involves noise cancellation, filtering, normalisation, and feature enhancement techniques (Tiwari, Reference Tiwari2018).
Automated beehive monitoring system overview for the image and audio signal analysis using deep-learning techniques.

Figure 3 Long description
The flowchart begins with ′Input Image′ leading to ′Pre-processing,′ which includes ′Denoising′ and ′Enhancement.′ This connects to ′Data Augmentation,′ followed by ′Training.′ The next step is ′Feature selection + object detection using CNN,′ which leads to ′System Evaluation.′ A decision point labeled ′Objective achieved′ branches to ′Classification′ if ′yes,′ using methods like LSTM, SVM, CNN and RF. If ′No,′ it loops back to ′Training.′ ′Testing′ is connected to ′Training′ and ′System Evaluation.′.
Preprocessing and normalisation strategies
Sound and sensor data from beehives contain noise and irrelevant signals, which must be cleaned and transformed for analysis. The first step of preprocessing is noise filtering. In Qandour et al. (Reference Qandour, Ahmad, Habibi and Leppard2014), a low-pass Butterworth filter or band-pass filter is applied to restrain frequencies from 0 to 4 kHz, since the targeted sounds in this study usually reside below 1 kHz. The work described in Cejrowski et al. (Reference Cejrowski, Szymanski and Logofatu2020) focuses on the whole colony’s sound, so outlier sound samples where a single bee passes too close to the microphone are removed. Samples are only kept when the frequency of their most significant harmonic component is lower than 600 Hz, or when their root mean square (RMS) level does not deviate by more than 80% of the dataset average. Similarly, noise in images is caused by lighting variations or sensory artefacts. This is processed using Gaussian (Rathore et al., Reference Rathore, Tyagi and Agrawal2023), Bilateral (Alves et al., Reference Alves, M.a, Ventura, Neves, Biron and Junior2020), and Median Filter (Paolillo et al., (Reference Paolillo, Petrini, Casiraghi, De Iorio, Biffani, Pagnacco, Minozzi and Valentini2022). Further, to improve image quality, contrast enhancement is performed using histogram equalisation or adaptive contrast adjustment. To reduce the variability due to recording equipment and environmental conditions, the amplitude of sound signals is normalised to a range between −1 and 1. For images, image pixel values are scaled to 0–1.
Synthetic data generation via augmentation
Data augmentation is a technique employed to expand the training dataset by generating transformed images. Data augmentation reduces overfitting and enhances model learning capacity by enlarging the dataset. For sensor data, it handles missing values with interpolation and imputation, whereas for sound data, it segments the signal into smaller windows (typically 1–5 seconds) or by changing pitch, masking, etc. For image data, it increases data diversity by performing data translation techniques such as flipping, rotating, scaling, etc.
Feature extraction
Feature extraction in analysing sound and image data is used to extract the important information for classification, clustering and predictive modelling. It enables automation, improves accuracy while reducing the data complexity. The different types of features for sound signals are as follows:
• Time domain features like RMS and zero-crossing rate quantify the vibrational intensity within the hive, indicating colony activity, communication, and swarming behaviour.
• Frequency domain features like Mel-frequency Cepstral coefficients (MFCCs) (Zgank Reference Zgank2019), spectral centroid, and spectral roll-off describe the frequency distribution of bee sound.
• Temporal features like autocorrelation is the measure of similarity of a signal with a time-shifted signal. It identifies periodic patterns in bee sound such as queen piping and swarming signals.
Whereas for image data, the features are as follows:
• Colour-based feature represents the distribution of pixel intensities in RGB or greyscale. It identifies patterns in hive structure, such as honey storage or brood area.
• Texture based like local binary patterns and grey-level co-occurrence matrix measure texture by analysing pixel intensity relationships. It detects variation in hive structure, such as comb texture or pest damage.
• Shape based is used for species classification, cell identification, and anomaly detection. It identifies object boundaries like edges, identifies patterns, and shapes to track bee movement and bee count.
Prediction and classification techniques
Prediction and classification enhance beekeepers’ understanding of their hives’ necessities, allowing them to maintain hive health while minimising stress duration. This approach saves time, reduces physical visits, and improves accuracy. ML combines the principles of statistics and computer science to develop algorithms that exhibit enhanced efficiency when exposed to pertinent data, as opposed to being provided with explicit instructions (Jijo and Abdulazeez, Reference Jijo and Abdulazeez2021). The implementation of certain mathematical models and algorithms enables orientation and decision-making processes by analysing data and predicting potential outcomes and effects of a given circumstance. Following are some common techniques:
• Time-series forecasting: These are used to predict hive states based on historical data. Algorithms like ARIMA (Auto Regressive Integrated Moving Average) (Box et al., Reference Box, Jenkins, Reinsel and Ljung2015), LSTM (Long Short-Term Memory), and Facebook Prophet are particularly effective for modelling and seasonality in sensor data. These methods help in forecasting swarming (Andrijević et al., Reference Andrijević, Urošević, Arsić, Herceg and Savić2022) and resource consumption, enabling proactive hive management.
• Regression models: Regression techniques are employed to predict continuous outcomes such as honey yields, pest outbreaks or colony strength, based on input features such as environmental conditions and hive metrics. Linear regression model, random forest (RF), eXtreme Gradient Boosting (XGBoost; Brini et al., Reference Brini, Giovannini and Smaniotto2025), and regression tree (Chen and Guestrin, Reference Chen and Guestrin2016) are commonly used algorithms. Kaplan–Meier Estimator estimates survival probabilities over time. These models analyses the relationship between honey production and resource allocation.
• ML model: Traditional ML algorithms, including support vector machine (SVM; Nolasco and Beltos, Reference Nolasco and Benetos2018; Kulyukin and Mukherjee, Reference Kulyukin, Mukherjee and Amlathe2018), Naïve Bayes (Bjerge et al., Reference Bjerge, Frigaard, Mikkelsen, Nielsen, Misbih and Kryger2019; Schurischuster and Kampel, Reference Schurischuster and Kampel2020), RF, and XGBoost (Chen and Guestrin, Reference Chen and Guestrin2016), are widely used for classification tasks like pest infestation, capped and uncapped cells, and brood identification, etc. (Rathore and Agrawal, Reference Rathore and Agrawal2024). Their interpretability and efficiency make them suitable for real- time applications. Anomaly detection methods like isolation forest and autoencoders are used to identify unusual patterns in hive data like sudden temperature drop, abnormal variations, and mites’ presence.
• Deep learning: Deep-learning models such as convolutional neural networks (CNNs) and recurrent neural networks excel at image-based tasks like pollen-bearing detection (Sledevič, Reference Sledevič2018), brood pattern, and pollen sac detection (Kulyukin and Mukherjee, Reference Kulyukin, Mukherjee and Amlathe2018). YOLOV3 model (Ngo et al., Reference Ngo, K.c, E.c and T.t2019), UNet (Rathore et al., Reference Rathore, Tyagi and Agrawal2023), Inception V3 (Alves et al., Reference Alves, M.a, Ventura, Neves, Biron and Junior2020), and Mask region-based CNN (R-CNN) are ideal for image data, whereas RNN – and their variants – and LSTM are suitable for sound signal and time-series data. These techniques enable advanced applications, such as identifying bee communication patterns from audio data or predicting colony health from integrated sensor input. Supplementary Table S1 refers to the various deep-learning (DL) and ML techniques reported for different apicultural applications.
Result analysis
In this section, we categorise and analyse IoT-based PB systems designed to maintain and improve bee colony strength through research on colony activity and threats. Each category is further divided into detailed subcategories, highlighting various technological developments and research directions. Specifically, each study is analysed with a focus on its purpose, data collection methods, and prediction techniques, which range from traditional methods to advanced AI applications.
Evaluation metrics
Evaluation parameters derived from sensors and other digital devices provide a holistic understanding of hive dynamics, enabling informed decision-making and improved colony resilience. Few key parameters and their mathematical expression are as follows:
Sensor data parameters
Sensor data are specifically used to predict and evaluate colony activity through three major components: (i) swarming analysis, (ii) bee-traffic analysis, and (iii) internal hive-state assessment. Continuous sensing enables the evaluation of environmental conditions, resource dynamics, metabolic activity, and behavioural patterns. Swarming is a particularly critical event for beekeepers because it can reduce colony strength, honey production, and overall profitability. Bee-traffic patterns provide insights into foraging efficiency, pollen and nectar collection, and overall colony health. Internal hive conditions are assessed using several key parameters. Temperature variance indicates thermoregulation efficiency, colony stress, and responses to external temperature fluctuations (Cook et al., Reference Cook, Blackler, McGree and Hauxwell2021). Changes in hive weight reflect honey production, food-resource consumption, and possible swarm departure. Carbon dioxide concentration provides information about hive ventilation and the metabolic activity of the colony. Humidity levels help identify moisture imbalance, inadequate ventilation, and environmental stress, while flight activity, measured over the observation period, supports the prediction of foraging behaviour, traffic intensity, and swarming activity. The mathematical definitions and detailed interpretations of these features are provided in Supplementary Table S2.
Sound data parameters
The sound parameters reveal information about the pest attack, quenlessness, and swarming activity. The recorded hive audio is treated as a real-valued time-series signal and analysed using features such as MFCCs, spectral centroid, zero-crossing rate, RMS energy, temporal entropy, and statistical descriptors including mean, variance, skewness, and kurtosis. These features characterise the spectral distribution, signal intensity, complexity, and temporal variability associated with different colony conditions. Detailed definitions and calculations of the audio features are provided in Supplementary Table S3.
The classification performance was assessed using accuracy, positive and negative predictive values, sensitivity, specificity, F1-score, true-positive rate, and false-positive rate, derived from the numbers of true-positive, true-negative, false-positive, and false-negative predictions. The receiver operating characteristic curve was generated by comparing the true-positive and false-positive rates across different classification thresholds. Its area under the curve (AUC) summarises the overall discriminative performance of the model, with a value closer to 1 indicating superior classification ability. The corresponding performance-metric calculations are presented in Supplementary Table S4.
Predictive analysis and observation
This section reviews research on monitoring colony activity. Research in this field falls into four primary categories: (i) colony strength analysis; (ii) swarming analysis; (iii) threat analysis, and (iv) traffic analysis. Colony monitoring examines sensor data and analyse hive conditions. Beekeepers must prioritise swarming since it directly impacts honey output and profitability. Bee traffic analysis, including bee entry and exit behaviours, reveals honey and pollen collection efficiency and hive health.
Colony monitoring and analysis
Table 3 shows the summary of predictive analysis and methods reported in the literature for colony monitoring. To predict colony-level parameters, Braga and Madureira (Reference Braga and Madureira2020) used LSTM regression model to forecast hive temperature 24 hours in advance. Their algorithm predicts accurate 2- and 24-hour forecasts with RMSEs of 0.15 and 0.18, respectively. Robustillo et al. (Reference Robustillo, Pérez and Parra2022) used a time-varying vector autoregression model to predict temperature, humidity, and weight for 1, 3, and 7 days, achieving an absolute error (MAE) of 0.70 for 1-day temperature forecasts and 0.84 for 7-day forecasts, with humidity and weight predictions following suit. Huet et al. used linear regression to forecast interior hive conditions and inform beekeepers of abnormalities. This method kept hives stable and allowed quick environmental stress response. To improve predictive accuracy, Anwar et al. (Reference Anwar, Keating, Cardell-oliver, Datta and Putrino2023) created a DL-based weight prediction model employing a bidirectional LSTM framework and attention-based encoder–decoder structure. The study gathered 57,600 data points on internal and external environmental factors every 30 minutes from eight hives in three locations. The model’s MAE of 0.64 shows DL’s promise for hive monitoring. Audio-based monitoring by Robles-guerrero et al. (Reference Robles-guerrero, Saucedo-anaya, González-ramírez and De la Rosa-vargas2019) predicted hive condition with the presence and absence of a queen bee. The authors calculated MFCC and classification accuracy up to 0.97. Further, Cejrowski et al. (Reference Cejrowski, Szymanski and Logofatu2020) classified bee circadian rhythms into day and night cycles using Fast Fourier Transform (FFT) and SVM models; they identified bee activity patterns with 81% accuracy from 809 data points over 9 days. Additionally, Cejrowski and Szymanski (Reference Cejrowski and Szymanski2022) used a contrastive convolutional variational autoencoder to identify feeding behaviour abnormalities in hives. They found that glucose-supplemented hives behaved differently over 5 days. Alves et al. (Reference Alves, M.a, Ventura, Neves, Biron and Junior2020) and Rathore and Agrawal (Reference Rathore and Agrawal2024) predicted colony strength and productivity using images. They employed DL frameworks like Inception V3, ResNet to classify cells in seven and three different classes, respectively, and achieved up to 98.7% and 94% accuracy.
Prediction analysis and methods used in literature for colony monitoring analysis

Table 3 Long description
Eight studies are listed with columns for references, data type, samples, data feature, analysis, preprocessing method, and performance metric. Data types include temperature and sound, sound alone, sound with temperature pressure and gas, temperature pressure and gas with camera, image, and temperature with pressure. Sample counts reported are 809, 720, 2048, 720, 2204, and 62, with two rows showing no sample value. Data features include sampling rate of 3000 hertz, sampling rate of 24000 hertz in two rows, resolution in two image rows, and units listed as C and grams in two rows, with two rows showing no data feature value. Analyses include machine learning with SVM, machine learning with SVD, machine learning with an autoregressive model plus GAM and DLM, and deep learning with LSTM, FCNN with Unet plus a maturity model, and Unet with InceptionV3 in two rows. Preprocessing methods listed are MFCC with discrete cosine transform, windowing with MFCC, spatial temporal analysis, MFCC with linear regression and LASSO regularization, CHT, CLAHE with CHT, and MICE, with one row showing a dash. Performance metrics reported are accuracy 81.41 percent, area under curve 0.98, mean absolute error 0.64, area under curve 0.97, accuracy 98.7 percent, accuracy 94 percent, and mean absolute error 0.84, with one row showing no performance metric.
DLM, dynamic linear model; GAM, generalised additive model; MICE: Multivariate Imputation by Chained Equations with Random Forest; SVD, singular value decomposition; SVM, support vector machine; CHT, circle Hough Transform; CLAHE, contrast adaptive histogram equalisation; MFCC, Mel frequency Cepstral coefficient.
Swarming activity analysis
Swarming is a critical reproductive behaviour in bee colonies, marked by the departure of the queen and worker bees to establish a new colony. Driven by factors such as colony overcrowding or environmental stress, swarming involves three stages: (i) preparation, (ii) swarming, and (iii) scouting. Early detection of swarming is vital for preventing colony loss and maintaining apiary productivity. Table 4 summarises the prediction analysis and methods reported in the literature for swarming activity. To examine the acoustic and ecological indicators of swarming, Anand et al. (Reference Anand, Raj, Ullas and Srivastava2018) incorporated multiple sensors into a hive and performed power spectrum analysis using a Fast Hartley Transform method with 256 frequency components and an anti-aliasing filter. The study demonstrates that the 400-Hz band activation and significant hive weight loss after swarming were strong indicators of swarming. Hive temperatures fluctuated from 28°C to 32°C before swarming to 34–38°C before lowering again after the swarm left. Zlatkova et al. (Reference Zlatkova, Kokolanski and Tashkovski2020) used the Welch technique to analyse acoustic data from six hives during a month. Their investigation indicated that power variations around 200 Hz preceded swarming, revealing distinct changes in audio patterns before and after swarm departure. Bencsik et al. (Reference Bencsik, Bencsik, Baxter, Lucian, Romieu and Millet2011) assessed swarming behaviour without the use of microphones and instead relied on accelerometers. For lower frequencies, accelerometers give more accurate readings (Bencsik et al., Reference Bencsik, Le Conte, Reyes, Pioz, Whittaker, Crauser, Simon Delso and Newton2015).
Prediction analysis and methods used in literature for swarming activity

Table 4 Long description
Rows list literature references with columns for data type, sample count, data feature, analysis, method, and performance metric. Senger et al. 2024 used temperature data with 60 samples, data feature in degrees Celsius, deep learning analysis, no method listed, and accuracy 85 percent. Andrej et al used sound data with 2443 samples, sampling rate 44100 hertz, deep learning with DNN analysis, MFCC method, and accuracy 94.09 percent. Dimitrios et al. 2022 used sound data with 1435 samples, sampling rate 22400 hertz, deep learning with SVM and UNet analysis, low pass filtering and fast Fourier transform method, and performance metrics of accuracy 95 percent and F1 score 98 percent. Zgank et al. used sound data with 2443 samples, sampling rate 16000 hertz, machine learning with HMM and GMM analysis, LPC and MFCC methods, and accuracy reported separately for GMM at 79.47 and for HMM at 82.43. Zlatkova et al used sound data with no sample count shown, sampling rate 22050 hertz, statistical analysis labeled PSD, Welch method, and performance metric listed as classification. Anand et al used sound, temperature, and pressure data with no sample count shown, data feature listed as sampling rate and C, statistical analysis, Harley transform method, and performance metric listed as classification.
DFA, discriminant function analysis; PCA, principal component analysis; LPC, linear principle coding; GMM: Gaussian mixture model; HMM, Hidden Markov model; MFCC, Mel frequency Cepstral coefficient; PSD, power spectral density.
The shift from traditional statistical models to ML/DL has revolutionised swarming detection, enabling real-time and early predictions: Zgank (Reference Zgank2018) employed Hidden Markov Models and Gaussian Mixture Models with MFCCs and Linear Predictive Coding for feature extraction, achieving 80.4% accuracy. A subsequent Deep Neural Network (DNN) model improved accuracy to 94%, though audio compression reduced performance. Dimitrios et al. (Reference Dimitrios, Bellos, Stefanou, Stergios, Andrikos, Katsantas and Kontogiannis2022) utilised a U-Net CNN with Mel spectrograms, achieving 89% accuracy 10 days before swarming and 95% accuracy 5 days prior. This approach demonstrated the feasibility of early intervention.
Temperature fluctuations serve as a reliable proxy for swarming prediction: Zacepins and Karasha (Reference Zacepins and Karasha2013) observed temperature spikes of 1.5–3.4°C 8–20 minutes before swarming in Latvian hives. A rule-based system using temperature data achieved high precision. Kviesis and Zacepins (Reference Kviesis and Zacepins2015) trained a DNN on 20-hour temperature datasets, detecting nine visually confirmed swarming events and two unnoticed by beekeepers. Senger et al. (Reference Senger, Gruber, Kluss and Johannsen2024) combined temperature, humidity, pressure, and weight data with Dynamic Time Warping, achieving 85% accuracy in predicting swarming 24–48 hours in advance. Vibrational data provide insights into colony dynamics and swarming intentions: Ramsey et al. (Reference Ramsey, Bencsik and Newton2017) attached accelerometers to brood frames and used FFT to create two-/three-dimensional vibrational spectra. Principal component analysis and discriminant function analysis classified swarming colonies with >90% accuracy, predicting events up to 30 days in advance.
Traffic analysis and activity mapping
Traffic volume and patterns reflect foraging efficiency, stress levels, and colony age, offering critical insights for beekeepers. Recent IHMSs leverage computer vision and ML techniques that have significantly improved bee traffic monitoring and foraging analysis (Clarke and Robert, Reference Clarke and Robert2018)]. Table 5 represents the prediction analysis and methods reported in the literature for traffic analysis. Kulyukin and Mukharjee proposed MOG2 motion detection algorithm to track bee exits, followed by a CNN-based classifier to distinguish bees from other objects. Their approach achieved 99.48% accuracy in identifying exiting bees.
Prediction analysis and methods used in literature for traffic analysis

Table 5 Long description
Columns list references, data type, samples, data feature, analysis, method, and performance metric for nine studies. Magnier et al. used image data with resolution as the feature, computer vision analysis, color processing, and reported accuracy of 100 percent. Mukharjee et al. used image data with 2,976 samples, resolution, computer vision analysis, no method listed, and reported DWT of 20.75. Kalyunki et al. appears three times: image data with 167,261 samples, resolution, deep learning analysis, MOG2 method, and accuracy of 99.48 percent; image data with 5,819 samples, resolution, deep learning analysis labeled YOLO, no method listed, and F1 score of 0.43; and image plus temperature data with 13,412 samples, resolution, machine learning analysis labeled RF and SVM, no method listed, and R of 0.74. Andrijevi et al. used sound plus temperature data with 480 samples, sampling rate as the feature, deep learning analysis labeled LSTM, SIFT method, and mean square error of 378.4. Stojni et al. used image data with 1,000 samples, resolution, machine learning analysis, color processing method, and IOU of 0.915. Yang et al. used image data with 1,400 samples, resolution, deep learning analysis labeled FCNN, FFT method, and accuracy of 93 percent. Ngo et al. used sound plus temperature data with 3,500 samples, resolution, deep learning analysis labeled YOLO, Otsu Threshold method, and F1 score of 0.94.
FFT, Fast Fourier transform; SIFT, scale invariant feature transform; MOG, mixture of Gaussian; RF, random forest; LSTM, long short-term memory; YOLO, You Only Live Once; FCNN, Faster CNN.
To further improve traffic volume prediction, Kulyukin et al. tested various YOLO models and compared YOLOv3, YOLOv4-tiny and YOLOv7-tiny on a 5819-image dataset. YOLOv3 outperformed others with F1-score of 0.43, while YOLOv7-tiny proved more energy efficient. Furthermore, Kulyukin and Mukharjee utilised directional particle image velocimetry (DPIV) to predict bee traffic as lateral movement and in-–out traffic. This method categorised bee traffic by calculating the pixel-level movement vectors of individual bees and classifying them by direction relative to the hive entrance. The DPIV technique with human counts scored 20.75 in high-traffic circumstances, whereas the VGG16 method and human counts scored 22.02. This shows that the DPIV technique classifies high-traffic situations better. In addition to image-based tracking, researchers have incorporated environmental factors to predict bee traffic. Kulyukin et al. (Reference Kulyukin, Mukherjee and Amlathe2018) utilised RF and SVM algorithms to predict bee invasion considering environmental conditions along with traffic statistics. The authors used BeePIV system to convert video frames into particle motion frames with uniform backgrounds and computed particle displacement vector fields for each pair of consecutive motion frames. RF performed better than SVM, with R 2 values of 0.46–0.74 against 0.39–0.69. Andrijević et al. (Reference Andrijević, Urošević, Arsić, Herceg and Savić2022) further investigated multisensor integration for bee traffic forecasting. They employed ARIMA, Prophet, and LSTM models on sensor data to count in–out movement of bees. The LSTM model achieved the highest accuracy with an RMSE score of 426.4 for outgoing and 378.4 for incoming traffic, demonstrating its potential for predicting bee movement trends. Besides traffic monitoring, various studies have assessed bee pollen collection. Stojnic et al. (Reference Stojnic, Risojevic and Pilipovic2018) classified bee images based on the presence of pollen by combining VLAD with SIFT algorithms. This method classified pollen-carrying bees with an Intersection over Union score of 0.797 and an AUC value of 0.915. Using YOLOv3-tiny and Kalman filtering for hive entrance tracking, Ngo et al. (Reference Ngo, K.c, E.c and T.t2019) developed an automated pollen monitoring system. The model showed a high correlation between pollen collecting rates and environmental parameters, including temperature and light intensity, with an F1-score of 0.94 for pollen detection and R 2 score of 0.91 for traffic counting. Yang and Collins (Reference Yang and Collins2019) isolated pollen-bearing bees using HSV-based colour segmentation and Faster R-CNN. The data-augmentation-trained model achieved 93% classification accuracy.
Threat analysis and risk forecasting
Schurischuster and Kampel (Reference Schurischuster and Kampel2020) introduced a DeepLabV3-based semantic segmentation model using ResNet and AlexNet architectures to classify healthy and Varroa-infected bees. Their dataset comprised 13,500 annotated bee images, with the best models achieving over 90% classification accuracy. This approach outperformed traditional methods by accurately segmenting mite-infected pixels. Mrozek et al. (Reference Mrozek, Gȯrny, Wachowicz and Małysiak-mrozek2021) proposed an embedded system for Varroa mite detection using a Raspberry Pi 4 and Coral TPU accelerator. Their two-stage detection framework first identifies individual bees, followed by Varroa mite detection using Google AutoML-trained models. The system, deployed on Amazon Web Services, achieved an F1-score of 0.8, integrating automated beekeeper notifications. Picek et al. (Reference Picek, Novozamsky, Frydrychova, Zitova and Mach2022) presented a smartphone-based mite infestation monitoring system, where images of hive fallout debris undergo thresholding, Region of Interest (RoI) selection, and CNN classification using VarroaNet. Their lightweight model variants (VarroaNet-0.1 and VarroaNet-0.05) achieved infestation detection accuracies of 96.0% (autumn) and 93.8% (winter). However, occlusion errors in RoI preselection remain a limitation. VoudIotis et al. (Reference VoudIotis, Moraiti and Kontogiannis2022) combined Fast R-CNN for bee detection and Hough Transform for mite identification, utilising dual cameras – one monitoring the brood and the other capturing frame-top views. While achieving 88% bee detection accuracy and 77% mite detection accuracy, camera placement above bee space posed risks of brood cooling. Mahajan et al. (Reference Mahajan, Mehta, Miranda, Pinto and Patil2023) applied sound analysis with Mel spectrograms to classify colony strength and compared it against SSD, YOLO, and DETR object detection models. Their YOLOv5s model achieved the highest mAP score of 0.97, demonstrating DL’s efficacy in mite detection. Braga and Madureira (Reference Braga and Madureira2020) developed a decision-support system that used multiple cameras for hive surveillance. A dataset of 2,750 images was collected and processed using the Mask R-CNN model, achieving 85% accuracy in hornet detection. Terada and Satoh, Reference Terada and Satoh2022 implemented a network of Raspberry Pi cameras for real-time detection, capturing 1,400 images from multiple angles. The YOLOv3 model outperformed other DL models, achieving 88.9% accuracy in detecting hornets. De Jong and Lester (Reference De Jong and Lester2023) introduced a portable hornet detection system based on YOLOv5s, processing high-resolution images (3840 × 2160). Accuracy varied depending on camera distance: 96.7% at 40 cm, 93.8% at 55 cm, and 82.5% at 90 cm, demonstrating the importance of optimal camera positioning. Kwon et al. improved YOLOX models with ShuffleNet features, enhancing small-object detection. Their model achieved a mAP of 93.8%, surpassing the vanilla YOLOX model (mAP = 89.6%), and performed inferences 1.34 × faster. O’Shea-Wheller et al., Reference O’Shea-Wheller, Corbett, Osborne, Recker and Kennedy2024. deployed cameras at hornet bait stations, integrating an IoT-based tracking system. Motion detection using ViBe segmentation and training with the YOLOv5 model resulted in F1-scores of 0.98–0.99, proving high reliability.
Challenges and limitations of IHMSs
Automated beekeeping necessitates regular surveillance and data acquisition, which could significantly increase the level of disruption and distress experienced by the bees. Frequent hive openings for data collection or treatments might disturb the bees’ natural behaviour and the colony dynamics. Bees can get agitated, potentially leading to stinging incidents or colony disruption (Shepherd et al., Reference Shepherd, Hollands, Godley, Sharkh, Jackson and Newland2019). Additionally, radiofrequency electromagnetic radiation emitted by wireless communication devices, including mobile phones, Wi-Fi routers, and other wireless technologies, causes heating that affects the health of bees (Henry et al., Reference Henry, Adamchuk, Stanhope, Buddle and Rindlaub2019). Some studies suggest that exposure to extremely low-frequency electromagnetic fields may lead to decreased brood development or altered bee physiology (Kimmel et al., Reference Kimmel, Kuhn, Harst and Stever2007).
Odemer and Odemer (Reference Odemer and Odemer2019), in their study, evaluated the success of mating and hatching by exposing queen bee larvae in two hives to radiation from a typical GSM (Global System for Mobile Communications) throughout their life cycle. It was observed that the radiation-affected colonies had a lower hatching ratio, but there was no evidence of infertility. However, beekeepers and the researchers have implemented various mitigation strategies to minimise potential risk, such as placing hives away from RF-EMR sources, reducing exposure time to wireless devices near hives, or using shielding material to block or reduce electromagnetic radiation. Furthermore, it is essential to efficiently manage the energy resources of IoT-based PB systems to reduce operating costs. Hadjur et al. (Reference Hadjur, Ammar and L2022) analysed the energy consumption in PB systems and found that power-cycling the system every hour was an energy-efficient strategy for its operation. Similarly, Anwar et al. (Reference Anwar, Keating, Cardell-oliver, Datta and Putrino2023) proposed a PB system to efficiently allocate resources for data collection with successful evaluations and field tests. This system supports low-power, wide-area networks and incorporates strategies for optimising sensor resource consumption. Consequently, the development of future low-power systems should prioritise minimising energy consumption while ensuring efficient data collection and communication. This approach would enable beekeepers to operate PB systems reliably and cost-effectively over the long term, significantly contributing to their commercialisation and widespread adoption.
Predictive monitoring requires complex data processing, thus requiring robust computational resources. Data fusion can enhance model predictive power by providing richer and more comprehensive data sets through AI models that handle complex data, such as deep multimodal techniques (Ramachandra et al., Reference Ramachandra, Bharath, Vinay, Joshi, Kumar and Rao2013). This approach increases the accuracy and improves the robustness of the analysis. This facilitates the detection of subtle patterns that single-mode data might miss, thereby addressing critical requirements in PB research. Primary issues preventing the widespread application of PB devices in contemporary apiculture are their high cost (Hadjur et al., Reference Hadjur, Ammar and L2022). These systems come with a hefty price tag, as components and sensors need to be bought individually, leading to a substantial increase in the overall system cost. Aside from the initial cost, there are additional expenses to consider, such as system maintenance, technical support for troubleshooting, and shipping costs, which can be challenging to estimate in advance [Fiedler et al., Reference Fiedler, Zacepins, Kviesis, Komasilovs, Wakjira, Nawawi, Hensel and Purnomo2020]. Another major concern is the beekeepers’ capability to effectively utilise these technological tools. The tools often require a level of technical expertise to install, operate, and troubleshoot. Indeed, beekeepers lacking fundamental or advanced instruction in the use of sophisticated machinery may not consistently possess the ability to accurately interpret and assess data or capitalise on the benefits of employing software for data manipulation. Adequate infrastructure, including internet coverage and power supply, is essential for the seamless operation of PB tools. Nevertheless, beekeeping enterprises situated in remote locations may face challenges in maintaining a reliable connection (Zacepins et al., Reference Zacepins, Kviesis, Komasilovs and Brodschneider2021).
Future enhancement and research directions
To overcome these challenges, future research must focus on enhancing the scalability, accuracy, and efficiency of AI-driven PB. As technology advances, the integration of more sophisticated AI models, multi-sensor fusion techniques, and blockchain-based data management will enhance the accuracy and efficiency of hive monitoring systems. Energy-efficient IoT solutions, such as solar-powered sensors and edge computing-based analytics, will ensure continuous, real-time hive monitoring while reducing power consumption and computational complexities. The development of self-learning AI algorithms, Generative AI and transfer learning will enable adaptive beekeeping strategies, allowing hive management systems to automatically adjust interventions based on colony health trends. Furthermore, the use of drone-based remote monitoring and satellite imaging can provide large-scale environmental assessments, helping beekeepers understand the impact of climate change and habitat loss on colony survival. Blockchain technology can also be leveraged to create secure, tamper-proof hive data records, ensuring transparency and reliability in honey production and disease tracking. Additionally, open-source beekeeping databases and cloud-based platforms will enable researchers and beekeepers to collaborate and share data, leading to improved AI training models and more generalised solutions for different geographical regions. Ultimately, the future of PB lies in combining automation, AI-driven decision-making, and sustainable hive management practices, ensuring the long-term survival of bee populations and the sustainability of global pollination services.
Discussion
The integration of IoT and ML is transforming conventional hive management into data-driven PB. This transition is particularly important because honeybees support both honey production and global pollination, while facing increasing threats from climate change, habitat loss, pesticides, and pathogens such as Varroa destructor. IoT-enabled sensors, computer vision, and DL facilitate continuous hive monitoring and enable timely, evidence-based interventions.
This paper provides a comprehensive review of IoT- and ML-enabled beehive monitoring systems, with emphasis on their technological evolution, practical benefits, and current limitations. By integrating real-time environmental sensing, bee-activity tracking, acoustic monitoring, and AI-based anomaly detection, these systems are shifting hive management from reactive inspection toward predictive and proactive decision-making. The review focuses on colony-state monitoring, bee-traffic analysis, swarm detection, and threat assessment. Sensor- and AI-based approaches have substantially advanced intelligent hive monitoring by supporting environmental forecasting, acoustic identification of abnormal colony conditions, and accurate image-based classification. ML methods and DL models have greatly improved bee detection, counting, tracking, behavioural classification, pest recognition, stress identification, queen loss, and disturbance. Time-series models further support the prediction of colony and environmental changes. Early identification of pre-swarming conditions allows beekeepers to intervene before colony division, thereby preserving colony strength and reducing potential economic losses.
Despite these advances, data variability, limited model interpretability, computational cost, sensor maintenance, and poor generalisability across species and climatic regions remain major challenges. Future systems should therefore incorporate multimodal sensor fusion, hybrid physics-informed and DL models, explainable AI, and energy-efficient edge processing. Further research is also needed to improve long-term forecasting and validate these methods across different bee species and environmental conditions. Such advances could strengthen apiculture productivity while supporting the sustainability of pollination-dependent ecosystems.
Supplementary material
The supplementary material for this article can be found at https://doi.org/10.1017/S0007485326101291.
Author contributions
Conceptualization and methodology: N.R. and D.A.; Formal analysis: N.R.; Resources: D.A.; Writing – original draft preparation: N.R.; Writing – review and editing: N.R. and D.A. All authors have read and agreed to the published version of the manuscript.
Ethics and approvals
This article does not contain any studies with human participants or animals performed by any of the authors.
Financial support
This study was not funded by anyone.
Competing interests
The authors declare no conflict of interest.