





1. Introduction
Most cleaning operations such as dish washing, window cleaning, or cleaning of other surfaces, as well as many specific cleaning processes in industry, use liquids. The microelectronics industry is at the forefront of the design, implementation and theoretical understanding of the most-demanding cleaning operations, due to the ultimate constraints in the fabrication processes: the ‘killer defect’ for microcircuits such as that specified by the International Roadmap for Devices and Systems (IRDS) is less than 10 nm, whereas cleaning processes represent one-third of the steps and 17 % of the costs of microcircuit fabrication.
Understanding how liquids clean solid surfaces is a problem that goes far beyond these practical issues and raises fundamental open questions. Statically, the fluid (and any surfactants it contains) reduces the adhesion of dirt particles to surfaces, an effect known as detergency (Carroll Reference Carroll1993; Landel & Wilson Reference Landel and Wilson2021). Dynamically, the liquid exerts a wall stress on the surface to be cleaned, helping to loosen the dirt. Computing the mechanical action exerted by the liquid on the surface can be challenging as it requires solving a multiphasic problem in a complex geometry and the role of dynamic parameters such as fluid velocity, fluid viscoelasticity or wettability is not yet fully understood (Burdick, Berman & Beaudoin Reference Burdick, Berman and Beaudoin2001; Burdick, Berlab & Beaudoin Reference Burdick, Berlab and Beaudoin2005). Approaches based on dimensionless numbers constructed on the ratios of hydrodynamic forces, stresses or torques acting on particles to their adhesive counterparts are not conclusive nor widely supported by experiments (Landel & Wilson Reference Landel and Wilson2021).
Furthermore, knowing how to dispense the liquid (in the form of a jet or spray or soaked on a cloth) for optimal cleaning efficiency also remains an open question. Using a jet divided into microdroplets rather than a continuous jet, as is the case with jet spray technologies, seems to considerably improve cleaning efficiency (for unchanged hydrodynamic parameters), but without any framework of understanding supporting this observation. Capillary effects and moving contact lines are obviously dominant mechanisms in this problem, but the current understanding of their action on particle removal remains purely empirical (Okorn-Schmidt et al. Reference Okorn-Schmidt2013), and the highly unsteady and inhomogeneous character of the stress and pressure fields exerted by a droplet spreading on a surface, which have been unveiled recently (Nouhou Bako et al. Reference Nouhou Bako, Darboux, James, Josserand and Lucas2016; Philippi, Lagree & Antkowiak Reference Philippi, Lagree and Antkowiak2016; Cheng, Sun & Gordillo Reference Cheng, Sun and Gordillo2022; Gordillo & Riboux Reference Gordillo and Riboux2022; Sun et al. Reference Sun, Alvarez-Novoa, Andrade, Gutierrez, Gordillo and Cheng2022), are never considered in spray cleaning.
In this article, we present a framework for understanding how microdroplet impact enables nanoparticle removal and cleaning encompassing all spatial scales, from nano to macro, which is supported by extensive experimental study as well as data from the literature. We introduce the concept of the cleaning cross-section of droplets, accounting quantitatively for the cleaning efficiency of sprays in various conditions of droplet size and velocity as well as particle parameters. The cleaning cross-section results from the unsteady shear viscous stress at the moving contact line of the impacting droplet, which washes particles away as a nanotsunami. This framework explains why we observe in experiments that the cleaning cross-section increases as the nanoparticle diameter squared, which is far from trivial. In addition, it provides elements for predicting the cleaning effectiveness of a spray having given characteristics (mean droplet size and velocity) depending on the contamination to be eliminated. Furthermore, by using highly controlled particles adhering on silicon wafers as nanometre-sized strain sensors, our experimental results provide an indirect submicrometre-scale study of hydrodynamic strain amplification at a line of mobile contact in the very first moments of the drop impact.
2. Experiments and results
2.1. Spray cleaning experiment
The experimental device used to measure the cleaning action of a spray comprises a spray generator typically used in the microelectronics industry (NanosprayTM (NS) from Screen) and a 30-cm-wide horizontal silicon wafer (see figure 1). The spray generator is fed by a nitrogen flow rate,  $Q_g$, and a liquid flow rate,
 $Q_l$. Unless specified otherwise,
 $Q_g=35\ {\rm L}\ {\rm min}^{-1}$ and
 $Q_l=0.1\ {\rm L}\ {\rm min}^{-1}$. The liquid is either pure water or an aqueous solution called Standard Clean 1 (SC1) composed of NH
 $_4$OH, H
 $_2$O
 $_2$ and H
 $_2$O in a volume ratio of 1:2:80 (pH 10–11). We have verified that these two solutions give equivalent cleaning results (cleaning efficiency under the spray differs by less than 10
 $\%$). This suggests that the cleaning process is purely physical and not chemical. Therefore, as these experiments are carried out on an industrial production line, we have systematically used the industrial recommended reference liquid, i.e. SC1.
Spray cleaning set-up. (a) A horizontal wafer pre-contaminated with nanoparticles is cleaned by applying a spray. The spray is off-centred at  $r'=r'_s$ and the wafer rotation speed is
 $\omega$. The spray generator is supplied with a liquid flow
 $Q_l$ and a gas flow
 $Q_g$ and placed at a height
 $h$ above the wafer. The droplets are dispersed in a cone of radius
 $\delta r_s$ at height
 $h$. Thus, after one complete rotation of the wafer, the surface area wetted by the spray on the wafer is
 $S=2 {\rm \pi}r'_s 2 \delta r_s$. (b) Left: the contamination of the wafer by nanoparticles before cleaning. The surface is completely black because it is totally contaminated. Middle: the contamination of the wafer after cleaning. A white ring of cleanliness appeared after the application of the spray. The position of this ring coincides with the spray application area. Right: the particles used to contaminate the wafer, either monodisperse and spherical SiO
 $_2$ particles or polydisperse and polymorphic Si
 $_3$N
 $_4$ particles.

The microdroplet spray is generated at a solid angle such that when the wafer is placed at a distance  $h$ from the spray nozzle, the wafer area wetted by the microdroplets is
 ${\rm \pi} (\delta r_s)^2$ with
 $\delta r_s=3$ mm (see figure 1a). To perform the experiments, the wafer is rotated at an angular velocity
 $\omega$ around its symmetry axis while the spray generator is offset by radius
 $r'_s$. Thus, when the wafer is rotated, the wafer area wetted by the spray after one turn can be written as
 $S=2{\rm \pi} r'_s 2 \delta r_s$.
The cleaning efficiency of the spray is defined from the number of nanoparticles on the wafer before and after spray application. In order to quantify this cleaning efficiency we follow a meticulous protocol that consists of several steps.
The surfaces used are 300-mm-diameter silicon wafers of crystalline orientation 1–0–0 cleaned and treated to control the silica oxide layer and to make them hydrophilic with a contact angle of the order of 5 $^\circ$. First, we ‘dirty’ these surfaces by depositing silica (SiO
 $_2$) or silicon nitride (Si
 $_3$N
 $_4$) particles on the wafer. The silica particles are spherical and highly monodisperse with a diameter
 $d_p$ of 60 nm, whereas the silicon nitride particles are less regular in shape and polydisperse with diameter
 $d_p$ ranging between 35 and 190 nm (see figure 1). To do so, an aqueous solution containing the particles is prepared at a given concentration and deposited on the surface until it is uniformly wetted. The plate is then rotated at approximately 1000 rpm to remove the contaminating solution.
The size and position of the particles on the wafer are counted using a laser diffractometer (Surfscan SP3 from Kla-Tencor). The uncertainty in the particle count is evaluated by counting three times the same contaminated wafer. For 191 695 particles on average in the region of interest, the diffractometer registers an absolute deviation of 132 particles, i.e. a relative deviation of 0.07  $\%$, less than 0.1
 $\%$. This demonstrates the reliability of the counting diffractometer.
Then we assess the reproducibility of the contamination procedure: the number  $N_i$ of particles on the dirty wafer does not vary more than 10
 $\%$ between two plates contaminated with the same solution. It is also highly uniform: the contamination of eight distinct areas of the surface of a wafer shows a homogeneity of the density of particles with a standard deviation of less than 5
 $\%$. The ‘dirty’ surfaces prepared in this way typically have
 $3\ {\rm particles}\ {\rm mm}^{-2}$.
The diffractometer also provides a reconstructed image of the dirty wafer as can be seen in figure 1(b, left), where a 15-cm-radius wafer that has been intentionally ‘dirtied’ by SiO $_2$ particles is shown. Despite the low surface density of particles (
 $3\ {\rm particles}\ {\rm mm}^{-2}$), the plate is totally black and thus appears to be completely contaminated: due to the small size of the nanoparticles, each particle is represented by a black circle much larger than its real size, which accentuates the visual rendering of the contamination when reconstructing the contaminated wafer image.
After this pre-cleaning count, the contaminated wafer is left to age for a period  $\alpha$ varying between 24 and 144 hours at
 $25 \pm 0.1^\circ$C and 40
 $\,\% \pm 0.1\,$% relative humidity.
The next step consists of rotating the wafer at  $\omega =10$ rpm and applying the spray for a time
 $t_s$ between 12 and 2000 s. We have verified that for the same time
 $t_s$, the efficiency of cleaning is not modified when this rotation speed is varied between 10 and 500 rpm (cleaning efficiency differs by less than 5
 $\%$).
After this cleaning step, the wafer is rinsed with water, dried with a stream of nitrogen and placed back into the laser diffractometer to count the size and position of the particles on the surface post-cleaning. The reconstructed image reveals a white ring on the wafer (see figure 1b, middle). The position as well as the width of this ring perfectly coincide with the surface  $S$. Moreover, the post-cleaning particle count
 $N_f$ reveals that the surface density of particles is divided by 10 and typically reaches
 $0.3\ {\rm particles}\ {\rm mm}^{-2}$ in this area. Thus a ring of ‘cleanliness’ of radius
 $r'_s$ and width
 $2\delta r_s = 6$ mm has appeared on the surface (see figure 1b, middle). Note that we have also verified that outside this clean zone, the number and position of the particles are identical for pre- and post-cleaning counts. Thus, outside the spray action zone, there is no movement of particles and therefore no cleaning. Finally, with these silicon surfaces, we never noticed any surface degradation associated with erosion as observed for more fragile materials (Li et al. Reference Li, Zhang, Guo and Lv2014; Brunier-Coulin, Cuellar & Philippe Reference Brunier-Coulin, Cuellar and Philippe2020).
2.2. Spray characteristics
The coincidence of the ring of cleanliness and the sprayed ring as well as the equivalent cleaning efficiency observed for water and SC1 fluid suggests that it is the impact of the spray droplets on the hydrophilic surface that causes the cleaning. We therefore characterised the velocity and radius distributions of the spray droplets using a phase Doppler interferometer (PDI-300 MD from Artium Technologies). The measurements were performed 10 mm downstream from the injector exit, on the symmetry axis. The probe volume of the phase Doppler interferometer is typically 1 mm $^3$. The typical distributions found experimentally for the droplet velocity
 $V_d$ and radius
 $R_d$ are shown in figure 2(a), for
 $Q_g= 35\ {\rm L}\ {\rm min}^{-1}$ and
 $Q_l= 0.1\ {\rm L}\ {\rm min}^{-1}$. The two distributions, although different in shape, are relatively peaked. To determine their mean values, we fit the radius distribution by a log-normal distribution and the velocity distribution by a Gaussian distribution. We found that the mean droplet radius is
 $\bar {R}_d=34 \mathrm {\mu }$m with a standard deviation of 17
 $\mathrm {\mu }$m whereas the mean velocity is
 $\bar {V}_d=73\ {\rm m}\ {\rm s}^{-1}$ with a standard deviation of 13 m s
 $^{-1}$ for
 $Q_g= 35\ {\rm L}\ {\rm min}^{-1}$ and
 $Q_l= 0.1\ {\rm L}\ {\rm min}^{-1}$. Note that for
 $Q_l= 0.1\ {\rm L}\ {\rm min}^{-1}$,
 $\bar {R}_d$ barely depends on
 $Q_g$, whereas
 $\bar {V}_d$ varies linearly with
 $Q_g$.
(a) Velocity,  $V_d$, and radius distribution,
 $R_d$, of the droplets of the spray. The velocity distribution fitted by a Gaussian distribution exhibits a mean value of
 $\bar {V}_d=73\ {\rm m}\ {\rm s}^{-1}$. The radius distribution is fitted by a log-normal distribution with a mean value of
 $\bar {R}_d=34\ \mathrm {\mu }$m. (b) Sequence of a droplet impact on a solid surface. Left: droplet position at
 $t=0$. Middle: droplet impacting on the surface with a moving contact line
 $R_{CL}$. Right: maximal droplet spreading at
 $R_M.$

2.3. Spray cleaning efficiency
By comparing  $N_i$ and
 $N_f$, the number of particles in the area of interest
 $S=4{\rm \pi} r'_s \delta r_s$ before and after the spray application, we define the cleaning efficiency of the spray as
 $N_c/N_i$, where
 $N_c=(N_i-N_f)$ is the number of particles that have detached from the surface under the action of the spray. As can be seen in figure 3(a), the cleaning efficiency of the spray for monodisperse silica particles of 60 nm in diameter increases rapidly with
 $t_s$ for
 $t_s<100$ s and saturates around
 $1$ (ultimate cleaning efficiency) for
 $t_s>250$ s of spray application.
(a) Cleaning efficiency  $N_c/N_i$ as a function of spray time
 $t_s$ for a wafer contaminated with monodisperse SiO
 $_2$ particles with
 $d_p = 60$ nm,
 $\alpha =144$ h,
 $\bar {R}_d= 34\ \mathrm {\mu }$m and
 $\bar {V}_d=73\ {\rm m}\ {\rm s}^{-1}$. The experimental data (open circles) are fitted by (2.2). (b) Droplet cleaning section,
 $\beta$, as a function of the particle diameter,
 $d_p$, for Si
 $_3$N
 $_4$ particles (grey squares) or SiO
 $_2$ particles (white circle).

Thus, the longer the spray is applied, the more effective the cleaning. This observation suggests that the cleaning efficiency is related to the number of droplets hitting the area of interest, and that each droplet participates in the cleaning process. To go further, we assume that there is no cooperative cleaning behaviour between adjacent droplets and introduce  $\beta$, the droplet ‘cleaning section’. This cleaning section is defined as the area that a droplet is able to clean thoroughly. During the time
 ${\rm d} t_s$, the number of particles detached will thus be
 \begin{equation} \frac{{\rm d}N_c}{N_i-N_c(t)}=f \beta \, {\rm d} t_s, \end{equation}
where  $f$ is the number of droplets falling on the wafer per unit surface area per unit time. This equation expresses that the relative number of particles detached during each time interval is equal to the fraction of the surface thoroughly cleaned by the droplets impacting the wafer during that time.
Assuming that neither  $\beta$ nor
 $f$ varies with
 $t_s$, (2.1) reads
 \begin{equation} \frac{N_c}{N_i}=1-\exp[-\beta f t_s]. \end{equation}
As shown in figure 3(a), (2.2) captures well the characteristics of the experimental cleaning efficiency, i.e. very low but rapidly increasing at short spray time ( ${N_c}/{N_i}\sim \beta f t_s)$ but saturating towards the maximum value of 1 at long spray time. It also provides an experimental value for the product
 $\beta f$. For instance, for
 $d_p = 60$ nm,
 $\alpha = 144$ h,
 $\bar {R}_d=34\ \mathrm {\mu }$m and
 $\bar {V}_d = 73\ {\rm m}\ {\rm s}^{-1}$, we find
 $\beta f = 0.011\ {\rm s}^{-1}$.
To estimate  $\beta$, we first calculate
 $f$, the number of droplets falling on the wafer per unit surface area per unit time. The wafer area receiving the droplets is
 $S=4 {\rm \pi}r'_s\delta r_s$, and the number of droplets emitted per unit time is
 $Q_L/((4/3){\rm \pi} \bar {R}_d^3)$; therefore
 \begin{equation} f=\frac{Q_L}{\dfrac{4}{3}{\rm \pi} \bar{R}_d^3 4 {\rm \pi}r'_s \delta r_s}.\end{equation}
Using typical values ( $Q_L=0.1\ {\rm L}\ {\rm min}^{-1}$,
 $\delta r_s=3$ mm,
 $\bar {R}_d=34\ \mathrm {\mu }$m and
 $r'_s = 67.8$ mm), we obtain
 $f \sim 4 \times 10^{9}\ {\rm droplets}\ {\rm m}^{-2}\ {\rm s}^{-1}$. This gigantic number is the result of the spray nozzle design, which is very efficient in fragmenting the continuous liquid flow into high-speed microdroplets.
From  $\beta f=0.011\ {\rm s}^{-1}$, we find that the cleaning cross-section of one droplet
 $\beta$ is
 $3\ \mathrm {\mu }{\rm m}^2$. Comparing this cross-section with the characteristic sizes of the problem is instructive. The cleaning cross-section of a droplet is three orders of magnitude smaller than its own cross-section
 ${\rm \pi} R_d^2=3600\ \mathrm {\mu }{\rm m}^2$, but three orders of magnitude larger than the cross-section of the dirt particles
 ${\rm \pi} d_p^2/4=3 \times 10^3\ {\rm nm}^2$. Finally, it is five orders of magnitude smaller than the area wetted by the impact of the droplet, which can be written as
 ${\rm \pi} R_M^2=0.1\ {\rm mm}^2$ with
 $R_M = 1.1 Re^{1/5} R_d$ in our range of impact parameters with
 $Re=2\rho V_d R_d/\mu$ (Eggers et al. Reference Eggers, Fontelos, Josserand and Zaleski2010) (see Appendix A.5). Therefore, only 1/30 000 of the area wetted upon the impact is efficient for cleaning.
A next step is to understand if the cleaning cross-section  $\beta$ is intrinsic to the characteristics of the spray, or if it depends also on the dirt particles. For this purpose, we perform the experiment on a surface contaminated with polydisperse, silicon nitride particles (Si
 $_3$N
 $_4$). All the other parameters, including the ageing time
 $\alpha$ of 144 h, are kept the same. As the device used to count the particles also measures their diameters, we measure the evolution of the cleaning efficiency
 $N_c/N_i$ as a function of the spray time
 $t_s$ for different particle sizes. From the adjustment given by (2.2), we extract the cleaning cross-section
 $\beta$ for different particle diameters
 $d_p$. As can be seen in figure 3(b), we find that
 $\beta$ increases with
 $d_p$. The data is well fitted by a power law with exponent 1.9, which is very close to 2. Hence, surprisingly,
 $\beta$ is higher for large than for small particles, despite the fact that large particles are expected to have a larger adhesion force and energy on the wafer surface. We also point out that the nature of the particles matters: for equivalent particle diameters, the effective cleaning cross-section of SiO
 $_2$ particles is greater than that of Si
 $_3$N
 $_4$ particles.
3. Modelling
3.1. Stress amplification at the contact line
The small value of the cleaning cross-section  $\beta$ compared with the droplet size suggests that the cleaning power of droplets occurs at an early stage after their impact on the wafer. In order to understand the mechanics of detachment of nanoparticles, we first concentrate on the stress tensor generated by the impact of a single microdroplet, of radius
 $R_d$ and impact velocity
 $V_d$, on a solid surface, assuming that the droplets fall on a dry surface, an assumption which will be justified later. The stress tensor can be divided into normal and shear tangential stresses. The details of the non-stationary and spatially inhomogeneous flow generated at the very first instants of the impact of a drop on a solid surface are now well known thanks to various works in the literature based on numerical simulations (Popinet Reference Popinet2009; Eggers et al. Reference Eggers, Fontelos, Josserand and Zaleski2010; Visser et al. Reference Visser, Frommhold, Wildeman, Mettin, Lohse and Sun2015; Kondo & Ando Reference Kondo and Ando2019), high-speed imaging experiments (Rioboo, Marengo & Tropea Reference Rioboo, Marengo and Tropea2002; Visser et al. Reference Visser, Frommhold, Wildeman, Mettin, Lohse and Sun2015; Gordillo, Sun & Cheng Reference Gordillo, Sun and Cheng2018; Mitchell et al. Reference Mitchell, Klewicki, Korkolis and Kinsey2019; Cheng et al. Reference Cheng, Sun and Gordillo2022) and detailed asymptotic analyses (Cointe Reference Cointe1989; Rioboo et al. Reference Rioboo, Marengo and Tropea2002; Howison et al. Reference Howison, Ockendon, Oliver, Purvis and Smith2005; Purvis & Smith Reference Purvis and Smith2005; Roisman Reference Roisman2009; Eggers et al. Reference Eggers, Fontelos, Josserand and Zaleski2010; Philippi et al. Reference Philippi, Lagree and Antkowiak2016). In the early stage of the drop spreading, the characteristic length scale of the problem is the extension of the contact line on the solid surface,
 $R_{CL}$, as defined in figure 2(b) (Rioboo et al. Reference Rioboo, Marengo and Tropea2002). It typically sets the amplitude of the pressure concentration field, which diverges when
 $R_{CL}=0$ at time origin
 $t=0$ as
 $1/\sqrt {t}$, a scaling first proposed by Josserand and Zaleski for drops splashing on liquid films (Josserand & Zaleski Reference Josserand and Zaleski2003) and then extended to solid surfaces in Eggers et al. (Reference Eggers, Fontelos, Josserand and Zaleski2010). At a later stage, the pressure
 $p$ exhibits self-similar structures, whose early-time analytical expressions have been revealed recently in the limit of large Reynolds number (Josserand, Ray & Zaleski Reference Josserand, Ray and Zaleski2016; Nouhou Bako et al. Reference Nouhou Bako, Darboux, James, Josserand and Lucas2016; Philippi et al. Reference Philippi, Lagree and Antkowiak2016). The important point is that the maximum of
 $p$ is not on the vertical axis of symmetry where
 $p$ is minimum, but rather near the contact line as shown for a flat surface in Philippi et al. (Reference Philippi, Lagree and Antkowiak2016) and for surfaces of various shapes in Ross & Hicks (Reference Ross and Hicks2019). By integrating the pressure field on the impact surface, the normal force due to the impacting drop can be calculated and compared with experimental results (Li et al. Reference Li, Zhang, Guo and Lv2014; Soto et al. Reference Soto, Borel de Larivière, Boutillon, Clanet and Quéré2014; Frommhold, Mettin & Ohl Reference Frommhold, Mettin and Ohl2015; Gordillo et al. Reference Gordillo, Sun and Cheng2018; Cheng et al. Reference Cheng, Sun and Gordillo2022). Its intensity can reach such a high value that soils (Brunier-Coulin et al. Reference Brunier-Coulin, Cuellar and Philippe2020; Yu et al. Reference Yu, Shao, Teh and Hung2022) or surfaces (Gamero-Castaño et al. Reference Gamero-Castaño, Torrents, Valdevit and Zheng2010; Keegan, Nash & Stack Reference Keegan, Nash and Stack2013; Nouhou Bako et al. Reference Nouhou Bako, Darboux, James, Josserand and Lucas2016; Cheng et al. Reference Cheng, Sun and Gordillo2022) can be damaged significantly. Of course, this inviscid framework cannot be used very close to the solid surface where the nanoparticles are stuck, because the boundary condition of inviscid flow is not compatible with the no-slip boundary condition prevailing in viscous flows. Yet, remarking that the contact line advance is geometrically similar to a shock wave advancing in a fluid near a solid surface, an analogy between the drop impact problem and shock-induced boundary layers can be drawn. This approach provides an analytical expression for the longitudinal velocity that compares well with numerical solutions (Philippi et al. Reference Philippi, Lagree and Antkowiak2016). Thanks to this boundary solution, an estimation of the tangential wall shear stress
 $\tau$ along the radial axis
 $r$ (defined in figure 2b, middle) can be calculated (Philippi et al. Reference Philippi, Lagree and Antkowiak2016):
 \begin{equation} \tau(r)=\frac{2 \sqrt{3}}{{\rm \pi}^{3/2}}\rho V_d^2 \sqrt{\frac{\mu}{\rho V_d R_d}}\left(\frac{rR_d}{R_{CL}(t)^2-r^2}\right), \end{equation}
where  $R_d$ is the drop radius,
 $V_d$ the impact velocity,
 $\rho$ the density of the fluid,
 $Re$ the Reynolds number of the impact and
 $R_{CL}$ the radius of the contact line. In this expression, the time dependency of
 $\tau$ is incorporated in the expression of
 $R_{CL}$, which varies over time in a diffusive-like manner,
 $R_{CL}=\sqrt {3V_d R_d t}$ (Rioboo et al. Reference Rioboo, Marengo and Tropea2002; Riboux & Gordillo Reference Riboux and Gordillo2014; Philippi et al. Reference Philippi, Lagree and Antkowiak2016). Thus, like
 $p$, the theoretical expression of
 $\tau$ diverges when
 $R_{CL}=0$ and also near the contact line (for
 $r=R_{CL}$). However, this last divergence is not confirmed either by experience, due to limited spatial resolution of the order of 100
 $\mathrm {\mu }$m (Cheng et al. Reference Cheng, Sun and Gordillo2022), or by numerical simulations (Philippi et al. Reference Philippi, Lagree and Antkowiak2016). The latter show a cut-off (maximum value) of the shear stress near the contact line, in the form of
 \begin{equation} \tau_\varDelta= \frac{3}{\varDelta {{\rm \pi}^{3/2}}}\rho V_d^2\sqrt{\frac{\mu}{\rho V_d R_d}}\frac{R_d}{R_{CL}}, \end{equation}
where  $\varDelta = 0.03$.
In figure 4, we report the variations of  $\tilde {\tau }=\tau (r)/(\rho V_d^2)$ with
 $r$ given by (3.1), taking into account the cut-off value
 $\tau _\varDelta$ close to the contact line (3.2), for two different times after impact,
 $t=0.2$ ns and
 $t=1$ ns. For these two times,
 $R_{CL}$ is of the order of a few micrometres and therefore is much larger than the diameter of the nanoparticles, which is at most 200 nm. As the maximum tangential stress
 $\tau _\varDelta$ scales as
 $1/R_{CL}$ with
 $R_{CL}=\sqrt {3V_d R_d t}$, so the smaller
 $t$ is, the larger
 $\tau _\varDelta$ is. Furthermore, we note that for both
 $t=0.2$ ns and
 $t=1$ ns after impact,
 $\tau _\varDelta$ exceeds the inertial stress
 $\rho V_d^2$, by a factor of nearly 10 for
 $t=0.2$ ns. Thus, in dimensional variables, the maximum tangential stress
 $\tau _\varDelta$ transiently reaches the huge value of
 $\tau _\varDelta \sim 10 \rho V_d^2\sim 50$ MPa for
 $V_d = 73\ {\rm m}\ {\rm s}^{-1}$ as can be seen in figure 5.
Evolution of  $\tau /(\rho V_d^2)$ as a function of
 $r$ for two different impact times (
 $\tau /(\rho V_d^2)$ is calculated from (3.1) and (3.2)). At
 $t=0.2$ ns,
 $\tau$ saturates at the value
 $\tau _\varDelta (t=0.2\ {\rm ns}) =10 \rho V_d^2$, whereas at
 $t=1$ ns,
 $\tau _\varDelta (t=1\ {\rm ns})$ is only
 $4 \rho V_d^2$.

Solid black line:  $\tau _\varDelta$ as a function of the contact line radius
 $R_{CL}$, calculated from (3.2). By comparing the adhesive stress
 $4 \gamma /d_p$ with
 $\tau _\varDelta$, the cleaning cross-section of particles with two different diameters is obtained. Blue and pink hatched areas:
 $R_{CL}<\sqrt {\beta _1}/{\rm \pi} <\sqrt {\beta _2}/{\rm \pi}$; both types of particles are cleaned. Pink area hatched in blue:
 $\sqrt {\beta _1}/{\rm \pi} < R_{CL}<\sqrt {\beta _2}/{\rm \pi}$; only the big particles are cleaned. Purple area without hatching: neither large nor small particles are cleaned.

This stress amplification near a moving contact line is a characteristic of boundary layer flows in which the velocity variations induced by the presence of the wall are concentrated in an extremely thin region of thickness  $\delta$, leading to very high shear stresses. It is of interest to compare the thickness
 $\delta \sim \sqrt {{\mu R_d}/(\rho V_d)}$ of a classical boundary layer on a flat plate with zero incidence for
 $t\sim R_d/V_d$ with that given by (3.2). Writing (3.2) in the generic form
 $\mu V_d / \delta$, we find
 $\delta \sim \sqrt {{\mu R_d}/(\rho V_d)} ({R_{CL}}/{R_d})$. The
 $\sqrt {Re}$ dependency of the shear stress is characteristic of a Blasius-type friction law also observed in surface erosion by an impinging jet flow (Brunier-Coulin et al. Reference Brunier-Coulin, Cuellar and Philippe2020). However, there is also an additional, non-stationary term characteristic of the drop geometry,
 $R_{CL}/R_d$, whose amplitude can reach extremely low values from the first moments of impact, considerably reducing the value of
 $\delta$ and thus amplifying the shear stress enormously.
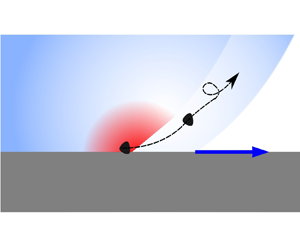
Thus, at the nanoparticle scale, the flow generated by the impact of the microdroplet is like a tidal wave, whose front sweeps the surface all the more vigorously the shorter the time after impact. This suggests that particles closer to the impact point  $I$ such as the green particle in figure 2, which will be reached earlier by the contact line, will be more easily detached from the surface than particles further from
 $I$ such as the orange or even red particles outside the drop flow area.
3.2. Particle removal
We now write a mechanical balance at the scale of a particle to determine if this flow is able to detach the particle from the surface. The force deriving from the pressure gradient acting on the particles is proportional to  $F_p\sim \nabla p {\rm \pi}d_p^3/6$, whereas the force deriving from the viscous shear stress is proportional to
 $F_\varDelta \sim \tau _\varDelta {\rm \pi}d_p^2/4$. Since the particles are very small and the shear stress is very high in the boundary layer, we consider only the latter contribution. We introduce the adhesion energy per unit surface
 $\gamma$ between the particle and the silicon flat surface. Both the Johnson–Kendall–Roberts and the Derjaguin–Muller–Toporov theories of adhesion (Johnson, Kendall & Roberts Reference Johnson, Kendall and Roberts1971; Derjaguin, Muller & Toporov Reference Derjaguin, Muller and Toporov1975) state that the adhesion force of the particle scales as
 $F_{adh} \sim {\rm \pi}\gamma d_p$. We assume here that particle detachment occurs only if the hydrodynamic force
 $F_\varDelta$ on the particle exceeds its adhesion force:
 $F_\varDelta > {\rm \pi}\gamma d_p$. A more rigorous analysis based on torques (Burdick et al. Reference Burdick, Berman and Beaudoin2001, Reference Burdick, Berlab and Beaudoin2005) leads to the same result. This force balance requires that the maximum tangential stress
 $\tau _\varDelta$ should exceed a threshold value
 $\tau _\varDelta ^*= 4\gamma /d_p$ in order to detach the particle. Using (3.2), we deduce a maximum contact line radius
 $R_{CL}^*$ to achieve particle detachment, and from it we get the cleaning cross-section
 $\beta ={\rm \pi} {R_{CL}^*}^2$ of a single drop, which may be written as
 \begin{equation} \beta=\frac{9}{16\varDelta^2 {\rm \pi}^2}\frac{\rho \mu V_d^3 R_d }{\gamma^2} d_p^2. \end{equation}
In this model, we assume the distributions of size and velocity of the droplets to be monodisperse, hence  $\overline{V_d^3 R_d}=\overline{V_d}^3 \overline{R_d}$. (We made sure that the velocity and size distributions are not strongly correlated: the relative difference between
 $\overline {V_d^3 R_d}$ and
 $\overline {V_d}^3 \overline {R_d}$ is less than
 $15\,\%$.)
Equations (2.2) and (3.3) thus express the cleaning efficiency of a spray in terms of the cleaning section of a multitude of droplets. These are the main results of our work.
3.3. Comparison with experimental results
Equation (3.3) contains many of the qualitatively expected trends: the smaller the adhesion energy  $\gamma$, the larger the impact velocity
 $V_d$ and the fluid viscosity
 $\mu$, and the larger the cleaning efficiency of the spray is expected to be. But (3.3) also provides a non-trivial dependency on the particle diameter, in very good agreement with our quantitative experiments. The predicted power law of
 $\beta$ in
 $d_p^2$ is indeed very close to the power law in
 $d_p^{1.9}$ observed experimentally (see figure 3).
In view of the mechanism at work, we can interpret the effect of the particle diameter on the cleaning cross-section as follows. Two different particles of diameters  $d_{p_1}< d_{p_2}$ generate different adhesive stresses
 $4 \gamma /d_{p_1}>4 \gamma /d_{p_2}$. The smaller the particle, the higher its adhesive stress. As
 $\tau _\varDelta$ decreases with
 $R_{CL}$, the cleaning cross-section on the small particles is smaller than that on the large particle (see the graphical illustration in figure 5). This effect can be illustrated in the case of a bimodal particle distribution. At a short time after the drop impact,
 $R_{CL}$ is very small, the stress amplification at the contact line is very high and all particles are washed away in this small wetted area (see the pink hatched area on white background in figure 5). At an intermediate time,
 $\tau _\varDelta$ only overcomes the adhesive stress of the large particle. Therefore, only the large particles in this area will be detached from the surface by the flow of the moving contact line, the small particles remaining stuck to the surface (see the blue hatched area on pink background in figure 5). At longer times,
 $\tau _\varDelta$ remains below the adhesion stresses of both particles and no more particles are detached by the contact line (see the purple area in figure 5).
In addition, the adhesion energies for silica–silicon,  $\gamma _{\mathrm {SiO_2/Si}}$, or silicon nitride–silicon,
 $\gamma _{\mathrm {Si_3N_4/Si}}$, can be estimated from the prefactor of
 $\beta$ versus
 $d_p$ dependency (figure 3b):
 $\gamma _{\mathrm {SiO_2/Si}}= 1.1\ {\rm J}\ {\rm m}^{-2}$ and
 $\gamma _{\mathrm {Si_3N_4/Si}}=1.8\ {\rm J}\ {\rm m}^{-2}$ for
 $\alpha =144$ h. The unit J m
 $^{-2}$ is the appropriate magnitude for silica adhesion on silicon wafers (Fournel et al. Reference Fournel, Continni, Morales, Da Fonseca, Moriceau, Rieutord, Barthelemy and Radu2012). It is nonetheless surprising to find
 $\gamma _{\mathrm {Si_3N_4/Si}}>\gamma _{\mathrm {SiO_2/Si}}$. We attribute this deviation to the complex shape of the silicon nitride particles (see figure 2, left), whereas the almost perfect spherical shape of SiO
 $_2$ particles suits particularly well all the numerical prefactors entering into our model. We indeed expect that particles of non-spherical and complex shape should lie on the surface so as to maximise their adhesion energy, leading to an increased adhesion force and possibly a decreased hydrodynamic force as compared with spherical particles of the same size and same chemistry.
The full validation of the framework of understanding proposed here requires a further comparison with experiments, in particular regarding the role of the spray parameters. In order to go further, we now study the influence of  $V_d$ in (3.3). To do so, we modify
 $Q_g$ from 15 to
 $35\ {\rm L}\ {\rm min}^{-1}$ while keeping
 $Q_L$ constant and measure the corresponding velocity and radius droplet distributions using the phase Doppler interferometer. We find that
 $R_d$ barely changes with
 $Q_g$, whereas
 $V_d$ increases linearly with
 $Q_g$ from 30 to 73 m s
 $^{-1}$. This ensures that
 $f$ remains constant as seen from (2.3). We then follow the protocols described above for the surface contamination using monodisperse SiO
 $_2$ particles with an ageing time of
 $\alpha = 24$ h, and we measure
 $N_i$ and
 $N_c$ after spray application during
 $t_s = 300$ s. The experimental value of
 $\beta$ is determined from
 $N_c/N_i$ using (2.2). The variation of
 $\beta$ as a function of
 $V_d$ is well described by (3.3) except for the higher (
 $V_d=73\ {\rm m}\ {\rm s}^{-1}$) and smaller values (
 $V_d=30\ {\rm m}\ {\rm s}^{-1}$) of the velocity range. More precisely, the variation of
 $\beta$ as a function of
 $V_d$ is in good agreement with the cubic power law
 $\beta =\epsilon V_d^3$, with
 $\epsilon = 15\ \textrm {nm}^2 \ \textrm {s}\ {\rm m}^{-1}$. This value of
 $\epsilon$, obtained for
 $\alpha = 24$ h, allows us to obtain the adhesion energy, which is here
 $\gamma = 0.7\ {\rm J}\ {\rm m}^{-2}$. As for the data of figure 3(b), we find a silica–silicon adhesion energy of the order of J m
 $^{-2}$, yet 30
 $\%$ smaller. It is the difference in the age of the samples (
 $\alpha =24$ h for the data in figure 6 versus
 $\alpha =144$ h for the data in figure 3b) that accounts for the discrepancy in
 $\gamma$, as the adhesion energy of many materials is known to increase with time due to viscoplastic creep of the contact asperities (Scholz & Engelder Reference Scholz and Engelder1976) or changes in chemical bonding due to a humid environment (Li et al. Reference Li, Tullis, Goldsby and Carpick2011). We also note that this cubic power fit is worse for two experimental points, which remain outside the fit. For the largest value of the velocity,
 $\beta$ is below the theoretical value, but the upper error bar of this point is very high. For these values of
 $\alpha$ and
 $t_s$, the cleaning is almost perfect and
 $N_c/N_i$ is very close to 1. In this case, the relative counting uncertainty of the diffractometer, about 0.07
 $\%$, is no longer negligible. For the smallest value of the velocity (
 $V_d = 30\ {\rm m}\ {\rm s}^{-1}$),
 $\beta$ is also significantly below the predicted value. This could be a signature of a too slow gas flow near the surface as discussed in the following.
Evolution of  $\beta$, the cleaning cross-section, with
 $V_d$ for SiO
 $_2$ particles,
 $t_s=300$ s and
 $\alpha =24$ h. The straight green line is a cubic fit
 $\beta =\epsilon V_d^3$, with
 $\epsilon =15 \ {\rm nm}^2\ {\rm s}\ {\rm m}^{-1}$.

Finally, our model allows us to understand the cleaning efficiency at the macroscopic scale via (2.2), (2.3) and (3.3), and proposes the following relation for  $N_c/N_i$:
 \begin{equation} -\ln{\left(1-\frac{N_c}{N_i}\right)}= \frac{9}{16\varDelta^2 {\rm \pi}^2} \frac{d_p^2}{\gamma^2} \rho V_d^3 R_d \mu f t_s. \end{equation}
Interestingly, (3.4) mixes quantities related to the nanoscopic scale of the adhesive particles ( $d_p^2/\gamma ^2$), the microscopic scale of the droplets (
 $\rho V_d^3 R_d \mu$) and the macroscopic scale of the spray (
 $\,ft_s$).
4. Discussion
We now compare our results with data from the literature. Sato et al. (Reference Sato, Sotoku, Yamaguchi, Tanaka, Kobayashi and Nadahara2011) empirically proposed that at a constant  $t_s$,
 $N_c/N_i$ depends on the droplet energy density, which they defined as
 $(4{\rm \pi} /3) R_d^3(1/2)\rho V_d^2/({{\rm \pi} R_d^2})\sim {2 \rho V_d^2 R_d}/{3}$. They tested this relation by measuring the number of particles removed from a silicon wafer intentionally contaminated with SiO
 $_2$ particles, using a monodisperse spray. This spray allowed the authors to obtain a very narrow distribution of both the radius and the velocity of droplets (with standard deviations lower than 5
 $\%$) and to modulate independently
 $R_d$ and
 $V_d$ while keeping a constant value of
 $f$, the number of droplets falling on the surface per unit time and surface. Unfortunately, neither
 $t_s$ nor
 $f$ is provided in this work. Thus, in figure 7 we plot
 $-\ln {(1-N_c/N_i)}$, as reported in Sato et al. (Reference Sato, Sotoku, Yamaguchi, Tanaka, Kobayashi and Nadahara2011), as a function of
 $\rho V_d^3 R_d \mu$. We observe that the two series of data corresponding to droplets with mean radius 11 and 22
 $\mathrm {\mu }$m are well fitted by a single linear relationship, in excellent agreement with our (3.4).
Comparison between literature data and our model. (a) Monodisperse spray droplets data from Sato et al. (Reference Sato, Sotoku, Yamaguchi, Tanaka, Kobayashi and Nadahara2011):  $-\ln {(1-N_c/N_i)}$ as a function of
 $\rho V_d^3 R_d \mu$ in arbitrary units. (b) Polydisperse spray droplets from Xu et al. (Reference Xu2009):
 $-\ln {(1-N_c/N_i)}$ as a function of
 $\rho V_d^3 \mu / R_d^2$ in arbitrary units. The difference between the two scalings of the
 $x$-axis is that in Sato et al. (Reference Sato, Sotoku, Yamaguchi, Tanaka, Kobayashi and Nadahara2011)
 $f$ is kept constant whereas in Xu et al. (Reference Xu2009) it is the liquid flow
 $Q_L$ that is kept constant. According to (2.3), a factor
 $R_d^3$ exists between the two scalings.

We also compare our model with data from Xu et al. (Reference Xu2009) obtained with contamination and cleaning protocols similar to ours, but for which the factor  $f$ rather than the liquid flow rate
 $Q_L$ is kept constant. Therefore, we use (2.3) to replace
 $f$ in (3.4) and predict that
 $-\ln {(1-N_c/N_i)}$ should increase linearly with
 $\rho V_d^3/R_d^2$. This prediction is compared with the data of Xu et al. (Reference Xu2009) in figure 7, which again shows good agreement with our model.
We now discuss the validity of the incompressible single-drop model described previously.
First, it assumes that the cleaned area is the product of the cleaning cross-section of a single droplet multiplied by the number of droplets that have fallen during  $t_s$ (see (2.1)). We thus consider each impact as isolated. This is true when the dimensionless number
 $A$, comparing the characteristic impact time
 $T_i\sim R_d/V_d$ with the time
 $T$ elapsing between impacts of two consecutive droplets with overlapping wetted surfaces, is smaller than one. Since
 $R_M\sim R_d Re^{1/5}$ (see Appendix A.5 and Eggers et al. (Reference Eggers, Fontelos, Josserand and Zaleski2010)), we obtain
 $T \sim ({\rm \pi} R_M^2\, f)^{-1} \sim ({\rm \pi} R_d^2\, f)^{-1} Re^{-2/5}$. Hence, using the characteristic values of the problem, we find
 $A={R_d}/{V_d T}\sim {{\rm \pi} R_d^3\, f Re^{2/5}}/{V_d}\sim 3.10^{-4}$, which justifies this one-drop approximation.
Second, we assume that the droplet impacts the surface perpendicularly. The angular aperture of the spray used is less than 10 $^\circ$, but Garcia-Geijo, Riboux & Gordillo (Reference Garcia-Geijo, Riboux and Gordillo2020) showed that for these angles the impact phenomenology is little altered.
Third, our model assumes that each droplet falls on a dry surface. But what would be the influence of a liquid film left by the impact of a previous drop on the shear stress exerted by a drop impacting the surface? Several works in the literature discuss this point. If they all agree on the fact that the maximum stress on a wet surface is always in the wake of the moving contact lines, there is no consensus on the level of maximum stress reached in the presence of a film compared with that reached on a dry surface. For a liquid film of thickness  $h$ of the order of
 $0.5 R_d$, Kondo & Ando (Reference Kondo and Ando2019) reported a maximum stress in the presence of a film equal to
 $4 \times 10^{-2}$ times the value of the maximum stress on a dry surface, whereas Nouhou Bako et al. (Reference Nouhou Bako, Darboux, James, Josserand and Lucas2016), Yu et al. (Reference Yu, Shao, Teh and Hung2022) and Frommhold et al. (Reference Frommhold, Mettin and Ohl2015) only indicated a factor of between
 $1/3$ and
 $1/10$. Based on those latter results, the influence of a prefilm would allow modulation of the intensity of the shear stress, which could be useful when cleaning surfaces with a fragile coating. However, in these works, there is no gas flow. We emphasise that a high gas flow rate is likely to evaporate the residual films, or to transport them out of the spray area, thus reducing the thickness of any remaining film. A large flow rate of gas therefore plays multiple roles in this problem: it breaks the liquid into a myriad of droplets in the nozzle, it accelerates the droplets and it eventually suppresses residual liquid films, thus ensuring that the drop impacts on a dry surface, which ensures the largest cleaning cross-section.
Finally, the cleaning efficiency calculated here neglects the possible redeposition of detached particles away from the cleaned area. Such redeposition has been observed in water spray cleaning of hydrophobic surfaces: when comparing the positions of the individual particles before and after cleaning, it was found that many particles had redeposited outside the spray area. For optimal cleaning, the physicochemistry of the liquid must be adapted to the nature of the particles as well as that of the surface to avoid any redeposition.
5. Conclusion
In this paper, we have proposed a new quantitative framework to model the efficiency of spray cleaning, which is perfectly validated by experimental measurements at the nanoscale. The forced spreading of the contact line of each microdroplet, which can be considered as isolated because the spray used is not very dense, shears the surface violently and can therefore be seen as a ‘nanotsunami’ on the surface to be cleaned. This nanotsunami is all the more intense if the particle to be cleaned is close to the initial impact point of the microdrop. Indeed, during the impact, the moving contact line generates a dynamic boundary layer which is thinner the earlier the impact is. It is this boundary layer that determines the velocity gradient at the wall: the thinner it is, the higher the velocity gradient and the greater the hydrodynamic stress at the wall. When this parietal stress exceeds the adhesion stress, the particle is detached from the surface and carried away by the flow. In addition to this quantitative aspect, which constitutes in itself a major advance in the field of cleaning, this work highlights several points. First of all, the extremely fine division of the fluid into a myriad of micrometre droplets allows the length of the contact line to be multiplied to the extreme: this allows an increase in both the probability that dirt is swept by an intense nanotsunami and the frequency of impact of the drops. Then, while the description of this cleaning process seems a priori extremely complex, the simplicity and robustness of our analysis allows us to use this spray cleaning problem to better understand what quantifies the adhesion of a nanoparticle on a surface. The cleaning efficiency of spray microdroplets can then be used as a probe to quantify the adhesion of nanoparticles on a surface, and possibly to study how it evolves with time or with relative humidity. Last, one might think that using a single drop would be an easier way to measure this adhesion energy. However, a quantitative measurement would require at least 10 particles per effective drop cleaning cross-section. Keeping the characteristic values of this study for  $\beta \sim 3\ {\rm nm}^2$, this would correspond to
 $3\ {\rm particles}\ {\rm nm}^{-2}$, i.e.
 $10^6$ times higher than the value actually used, which is
 $3\ {\rm particles}\ {\rm mm}^{-2}$. At these concentrations, it will be much more difficult to avoid the formation of particle aggregates and to ensure that the droplet flow is not disturbed by particles. By using a spray made up of a myriad of drops rather than a single drop, we can get down to very low particle surface densities, thus ensuring reproducible and quantitative measurements.
Acknowledgements
The authors thank J. Giraud for his valuable help and for fruitful discussions. LIPhy and the LEGI are part of the LabEx Tec21 (Investissements d'Avenir; grant agreement number ANR-11-LABX-0030).
Declaration of interests
The authors report no conflict of interest.
Appendix A.
A.1. Surface
The surfaces used for this study are 300-mm-diameter silicon wafers of crystalline orientation 1–0–0 with a thickness between 755 and 795 m. They are first cleaned with a 0.5  $\%$ hydrofluoric acid solution for 20 s at a flow rate of 1.5 L min
 $^{-1}$ in order to remove the native silicon oxide formed by exposure to air before their use. Then a solution of SC1 (mixture of NH
 $_4$OH, H
 $_2$O
 $_2$ and H
 $_2$O) heated to 65
 $^\circ$C is distributed on the surface as a jet with a flow rate of 2 L min
 $^{-1}$ for 30 s before being distributed as a spray for 32 s with a liquid flow rate (
 $Q_L$) of 100 mL min
 $^{-1}$ and a gas flow rate (
 $Q_g$) of 35 L min
 $^{-1}$ during 30 s. This process allows the formation of a chemical silicon oxide more uniform than the oxide initially present on the surface. The surface presents a majority of silanol groups, which makes it hydrophilic. An infrared analysis shows that the chemical oxide surface hydrates naturally in the air and two to three water monolayers are present on the surface. The roughness of these surfaces is less than 0.25 pm.
A.2. Spray characterisation
Drops size and velocity were measured using a phase Doppler interferometer (model PDI-300 MD from Artium Technologies). The system used a 532-nm laser beam with a transmitter focal length of 1000 mm and a receiver focal length of 500 mm. The receiver was set at a 30 $^\circ$ deviation as recommended for water drops in air. The measurements were highly localised (the probe volume was approximately 0.02 mm
 $^3$ with an extent of approximately 650
 $\mathrm {\mu }$m along the injector axis and approximately 200
 $\mathrm {\mu }$m in the other directions). With these settings, diameters from 3 to 300
 $\mathrm {\mu }$m can be detected with a
 ${\pm }0.5\ \mathrm {\mu }$m uncertainty. That interval included all the drops present in our experiments. In addition, all drops were spherical. Consequently, the resulting validation rate was good. All size and velocity measurements were performed on the symmetry axis and 10 mm downstream of the injector exit, a distance nearly equal to
 $h$ (see figure 1a), which was set to 6 mm.
A.3. Cleaning efficiency measurement
As we work on an industrial line also used for production, we use SC1 Standard Clean One, a mixture of NH $_4$OH, H
 $_2$O
 $_2$ and H
 $_2$O, 1:2:80 by volume, with a pH of 10. This high pH value increases the zeta potential of the silicon wafer, thus preventing redeposition of particles after cleaning. The different steps of the experimental protocol to determine the cleaning efficiency of the spray are detailed in figure 8.
Different steps of the experimental protocol: a perfectly clean wafer is contaminated in a controlled way (step 1), its state of cleanliness is quantified by laser spectrometry (step 2), spray cleaning is performed (step 3), the wafer is dried (step 4) and the state of cleanliness is quantified again (step 5).

A.4. Particle diameters measurements
To determine the different particle diameters of the polydisperse silica nitride particles, we segment the diameter interval 30–170 nm into several subintervals, all containing the same proportion of particles, and attribute to all the particles in each subinterval the mean value of the subinterval.
A.5. Regime of impact for a single droplet
For a liquid droplet with air–liquid surface tension  $\sigma = 70\ {\rm mN}\ {\rm m}^{-1}$, liquid density
 $\rho =1000\ {\rm kg}\ {\rm m}^{-3}$ and viscosity
 $\mu =0.001\ {\rm Pa}\ {\rm s}$, we have
 $Re=2\rho V_d R_d/\mu =4964$ and
 $We= 2\rho V_d^2 R_d/\sigma = 5176$. These numbers are both large with respect to unity. We also calculate
 $We Re^{-2/5}$, as this dimensionless number allows us to know whether the impact is controlled by a balance between inertia and viscosity or inertia and capillarity, and find
 $We Re^{-2/5}>10$, yielding a viscous impact regime where most of the initial kinetic energy will be dissipated into viscous dissipation. In this regime, the impact of the drop will proceed as follows. First, in a short time, i.e. for
 $t\ll R_d/V_d$, the drop will spread by deforming only in a region located near the contact zone, the rest of the drop keeping its spherical shape. In this regime, the radius of the contact zone is denoted by
 $R_{CL}$. At a longer time
 $t\sim R_d/V_d$, the whole volume of the drop is deformed.



