


Introduction
Paleoatmospheric reconstruction is one of the main topics of research on ice cores (e.g. Reference Neftel, Moor, Oeschger and StaufferNeftel and others, 1985; Reference Barnola, Raynaud, Korotkevich and LoriusBarnola and others, 1987; Reference Neftel, Oeschger, Staffelbach and StaufferNeftel and others, 1988; Reference Raynaud, Chappellaz, Barnola, Korotkevich and LoriusRaynaud and others, 1988; Reference Stauffer, Lochbronner, Oeschger and SchwanderStauffer and others, 1988; Reference Chappellaz, Barnola, Raynaud, Korotkevich and LoriusChappellaz and others, 1990). Atmospheric gases are trapped in air bubbles when firn is transformed into ice by sedimentation near the surface of polar ice sheets. Air bubbles are compressed with depth and gradually transform into clathrate hydrates below a depth at which the hydrostatic pressure becomes greater than the dissociation pressure of the hydrate phase (Reference MillerMiller, 1969; Reference Shoji and LangwayShoji and Langway, 1982). Air bubbles and clathrate hydrates coexist in the deep ice within a range of depths (the transition zone) which covers 500–1250 m in the Vostok Antarctic ice cores (Reference LipenkovLipenkov, 1989; Reference Uchida, Duval, Lipenkov, Hondoh, Mae and ShojiUchida and others, 1994).
When clathrate hydrate forms in a ternary system (i.e. a gas mixture and H2O), the gases are fractionated by selective enclathration (Reference Barrer and StuartBarrer and Stuart, 1957). According to the theory of Reference Van der Waals and PlatteeuwVan der Waals and Platteeuw (1959), air clathrate hydrate transformed from air and ice (or water) is enriched in 02 . This fractionation effect on air clathrate hydrate was confirmed from Raman spectroscopic study of artificial air clathrate hydrate by Reference Chazallon, Champagnon, Panzcer, Pauer, Klapproth and KuhsChazallon and others (1998). Thus, fractionation of air gases during the transition process from air bubbles to clathrate hydrates in polar ice sheets is expected. Since the fractionation affects the composition and distribution of the atmospheric gases in ice, the effect of fractionation has been studied in order to reconstruct accurate records of the paleoatmosphere from polar ice cores (Reference Nakahara, Shigesato, Higashi, Hondoh and LangwayNakahara and others, 1988; Reference Pauer, Kipfstuhl and KuhsPauer and others, 1995, Reference Pauer, Kipfstuhl and Kuhs1996, Reference Pauer, Kipfstuhl and Kuhs1997; Reference Fukazawa, Ikeda, Suzuki, Hondoh, Mae and LangwayFukazawa and others, 1996a,Reference Fukazawa, Ikeda, Hondoh, Duval, Lipenkov and Maeb; Reference IkedaIkeda and others, 1999, in press; Reference Salamatin, Lipenkov, Hondoh and IkedaSalamatin and others, 1999).
From measurements of the depth profile of the N2/O2 composition ratios in the clathrate hydrates and the air bubbles, Reference Fukazawa, Ikeda, Hondoh, Duval, Lipenkov and MaeFukazawa and others (1996b) and Reference IkedaIkeda and others (1999) found significant fractionation of gas molecules in the transition zone inVostok ice. They measured Raman spectra of 140 clathrate hydrates and 120 air bubbles from depths of 83–3316 m inVostok ice cores, and found remarkable variations of the N2/O2 ratios in clathrate hydrates and air bubbles with depth in the transition zone. They reported that the average N2/O2 ratio in air bubbles increases from the atmospheric value at the beginning of the transition to 11.7 at the end, while the average N2/O2 ratio in clathrate hydrates is 2.0 at the beginning and asymptotically approaches the atmospheric value. They concluded that the variation in gas compositions in clathrate hydrates and air bubbles is attributable to faster diffusion of O2 than N2 through the ice lattice. This conclusion is consistent with the results of optical microscopic observations of the sizes of air bubbles and clathrate hydrates in the Vostok ice cores (Lipenkov and others, in press). The distribution of the radii of clathrate hydrates, s/r (i.e. the ratio of the standard deviations, s, and the mean radius, r), in the transition zone is about 25%, while that of air bubbles above the transition zone is about 40%. These results showed that clathrate hydrate grows outward due to the diffusive mass transfer of air molecules between clathrate hydrates and air bubbles through the ice matrix during and after the transformation from air bubble.
Reference Salamatin, Hondoh, Uchida and LipenkovSalamatin and others (1998) modeled the process of conversion of an air bubble to a clathrate hydrate crystal in ice after nucleation. On the basis of the theory, Reference Salamatin, Lipenkov, Hondoh and IkedaSalamatin and others (1999) developed a mathematical model of the post-nucleation growth of clathrate hydrate, taking into account the outward growth caused by the diffusive mass transfer of air molecules through the surrounding ice matrix. Reference Salamatin, Lipenkov, Hondoh and IkedaSalamatin and others (1999) and Ikeda and others (in press) applied the model to the conditions of Vostok and Greenland ice cores. According to their theoretical model, a large percentage of air molecules (30–70% of the total mass) in an air bubble is abruptly converted into a clathrate hydrate crystal after nucleation because of the high supersaturation of the initial air bubble. During this stage, the pressure of the air bubble drops to the dissociation pressure level. The shell of the clathrate hydrate then grows inward, filling up the air bubble. The inward growth occurs due to (1) diffusion of air and water molecules through the clathrate hydrate layer in opposite directions, and (2) hydrostatic compression of the air bubble confined to the shell of the clathrate hydrate and surrounding ice, both plastically deformed under the excess load pressure. The hydrostatic compression of the air bubble is the rate-limiting step in the inward growth of the clathrate hydrate (Reference Salamatin, Lipenkov, Hondoh and IkedaSalamatin and others, 1999). At the same time, the crystal grows outward as described above. Thus, the post-nucleation growth of clathrate hydrate is controlled by the hydrostatic compression of the air bubble and the diffusive transfer of air molecules through the ice matrix. Accordingly, the spatial distribution of air molecules within an individual clathrate hydrate crystal might not be uniform and in equilibrium.
In order to investigate the spatial distribution of air molecules within an individual clathrate hydrate crystal, Reference Pauer, Kipfstuhl and KuhsPauer and others (1996) measured the focal-plane dependence of the N2/O2 ratio within a clathrate hydrate from 1475.65 m depth in the Greenland Ice Core Project (GRIP) ice core using Raman spectroscopy. However, they found no fractionation effect (i.e. gradient) on the N2/O2 concentration within a clathrate hydrate crystal. They concluded that the gradient of the concentration that resulted from the initial fractionation may have been leveled out with time.
On the other hand, Reference Fukazawa, Ikeda, Suzuki, Hondoh, Mae and LangwayFukazawa and others (1996a) found an inhomogeneous distribution of air molecules within a clathrate hydrate from 1501m depth in the Dye-3 (Greenland) ice core using Raman spectroscopy. They showed that the N2/O2 ratio decreases with increase in the distance from the center of the crystal, and reaches its minimum at the interface with surrounding ice Ih. The N2/O2 ratio at the interface was about 20% lower than that at the center of the crystal. Fukazawa and others concluded that the inhomogeneous distribution is due to the lower dissociation pressure for pure O2 clathrate hydrate than for pure N2 clathrate hydrate.
In order to investigate the mechanism of the variation in the spatial distribution of air molecules in an individual clathrate hydrate crystal in a polar ice sheet, we measured the focal-plane dependence of the N2/O2 ratio within clathrate hydrate over a large depth range in Vostok ice cores, using Raman spectroscopy.
Experiment
Raman spectra of 79 clathrate hydrates from depths of 750–3299 m in the Vostok ice cores were measured using aJOBIN YVON RAMANOR T64000. The excitation energy for Raman emission was produced by an NEC Ar-ion laser using a single-mode operation of 514.5 nm with an output of 300 mW. The laser beam was focused on an individual clathrate hydrate with a diameter of 1 μm under an optical microscope, which was connected to a spectrometer for backscattering measurement. The spectra were measured at intervals of several μm within an individual clathrate hydrate. Atmospheric gas was used as a standard to estimate the N2/O2 composition ratio from the N2/O2 peak-intensity ratio. During the experiments, a continuous flow of nitrogen gas maintained the samples at 248 ± 0.1 K. Further details of the procedures are described elsewhere (Reference Fukazawa, Ikeda, Hondoh, Duval, Lipenkov and MaeFukazawa and others, 1996b).
Results and Discussion
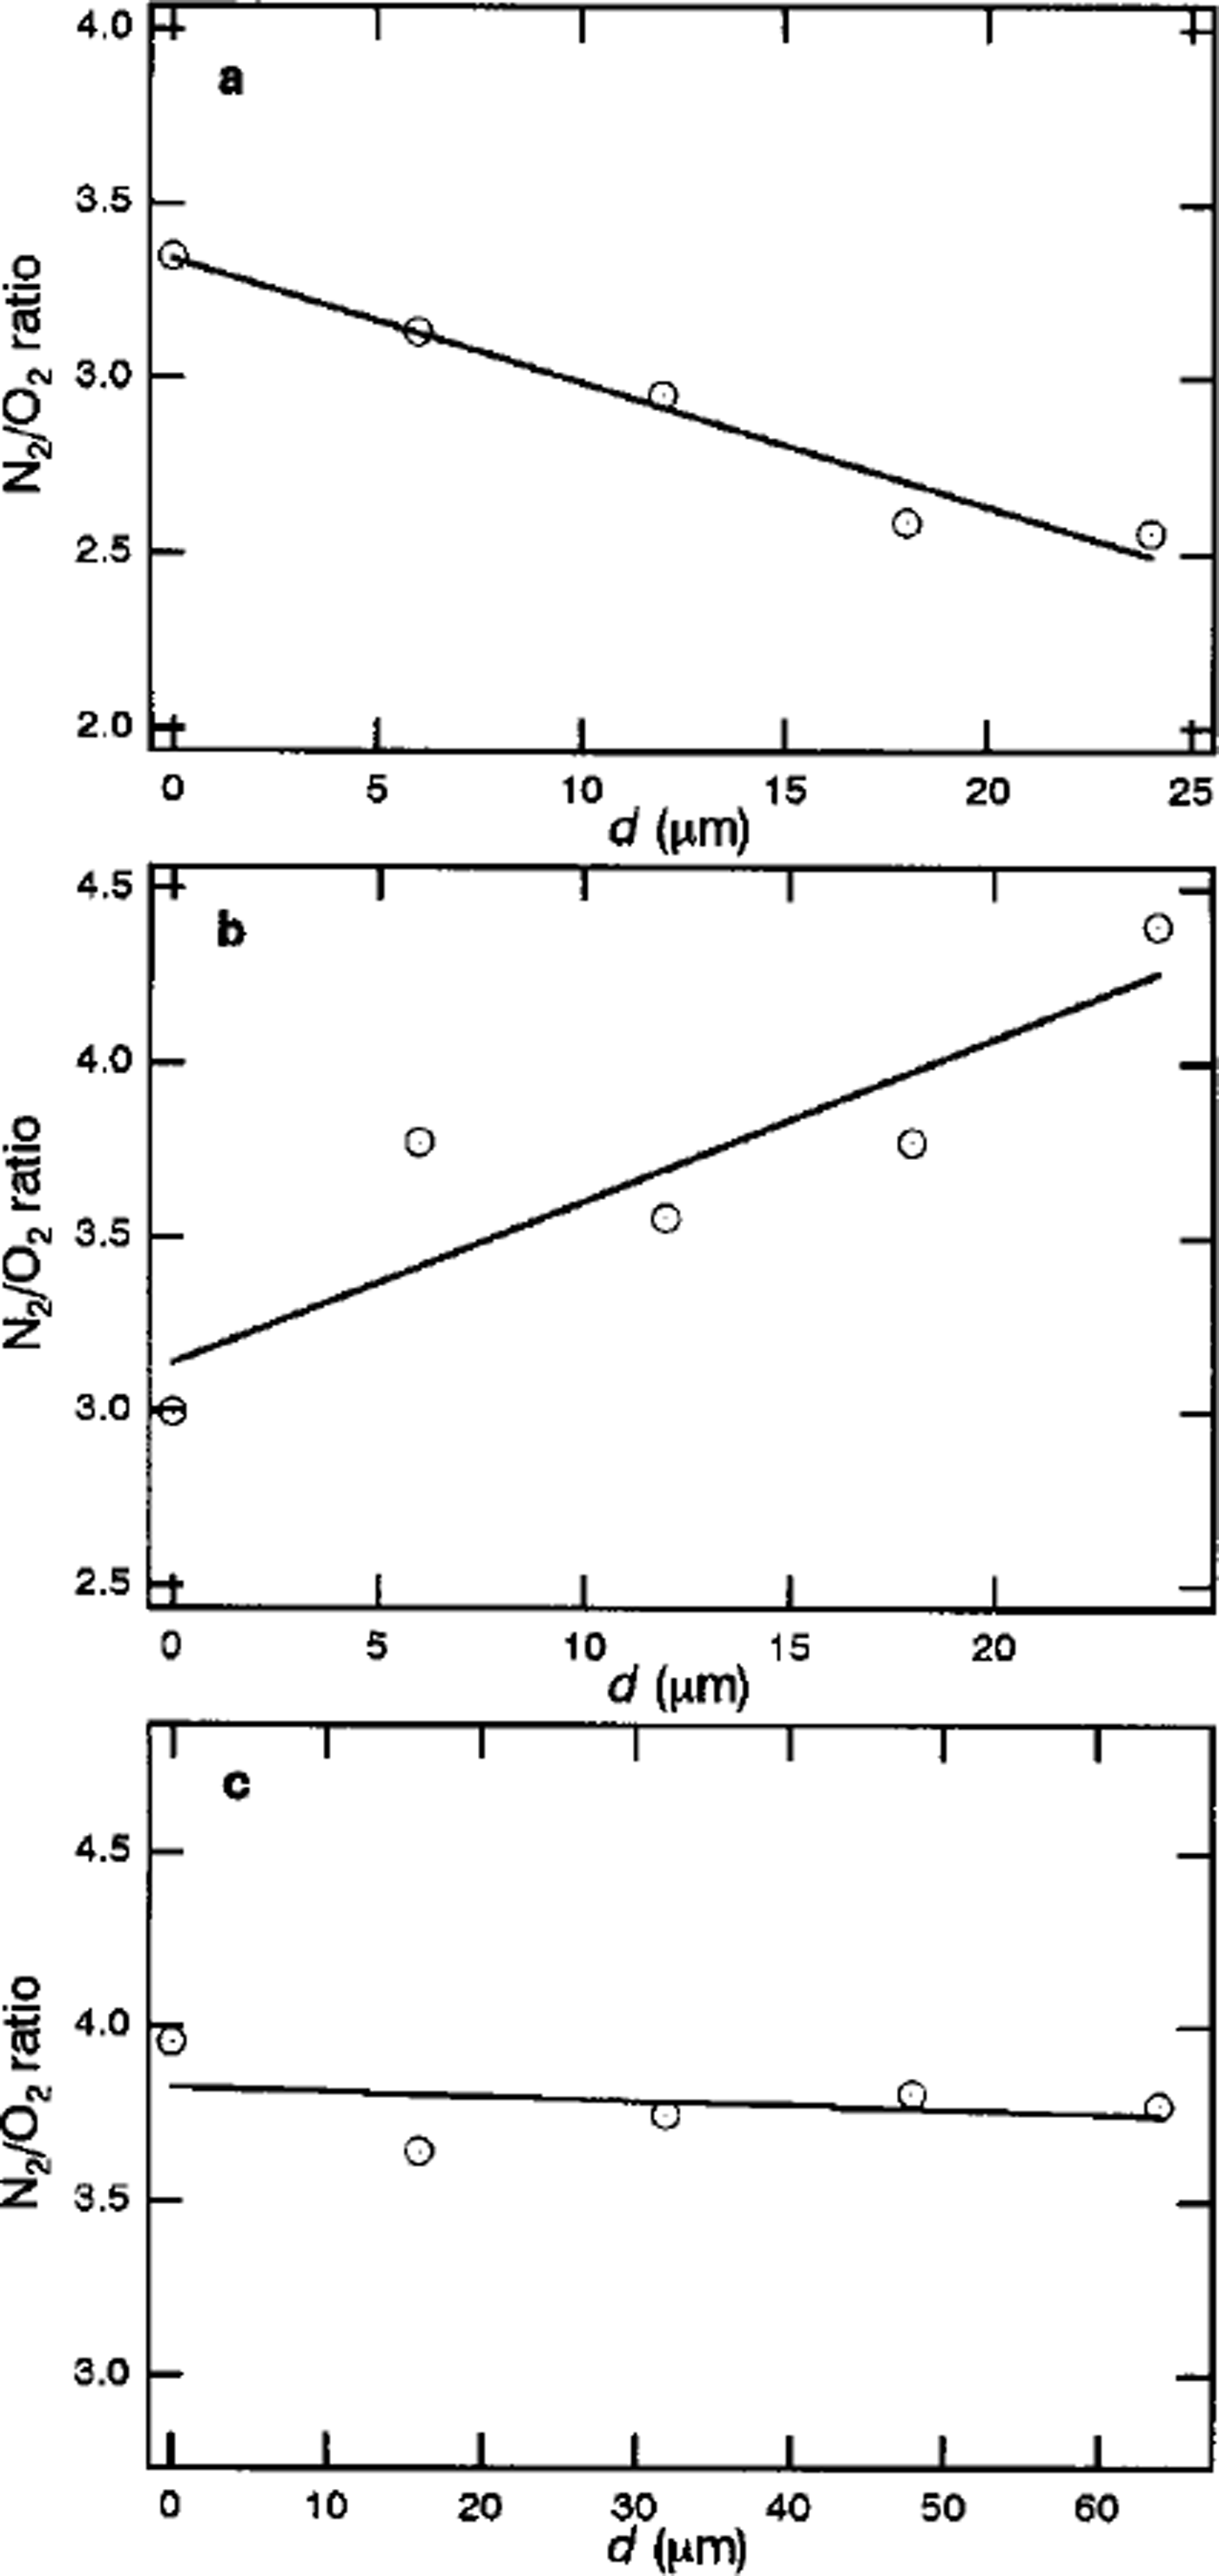
Figure la-c show the focal plane dependencies of N2/O2 ratios within crystal-a (1100 m depth), crystal-b (1100 m depth) and crystal-c (1751m depth), respectively. The pattern of the spatial distribution of air molecules in clathrate hydrate depends on the crystal. As shown in Figure la-c, crystals-a and –b have inhomogeneous distributions of N2/O2 ratios, while the distribution in crystal-c is practically homogeneous. For crystal-a, the N2/O2 ratio is about 3.3 at the center of the crystal. The value decreases with increase in distance from the center, d, and reaches 2.5 at the interface with surrounding ice Ih. For crystal-b, the N2/O2 ratio at the center of the crystal is about 3.0. The value increases with increase in d, and reaches 4.4 at the interface with surrounding ice Ih. Crystal-c has a constant N2/O2 ratio of 3.8.
Focal-plane dependencies of N2/O2 ratios within (a) crystal-a (1100 m depth), (b) crystal-b (1100 m depth) and ( c) crystal-c (1751m depth) in Vostok ice cores.
In order to investigate the depth profile of the distributions of air molecules in individual crystals, we assume that the degree of the distribution is given by

where
 and
 are the N2/O2 ratios at the interface with ice Ih and at the center of the crystal, respectively, and τh is the radius of the crystal. A negative value of
 means that the N2/O2 ratio of the crystal decreases with increase in d. A positive value of
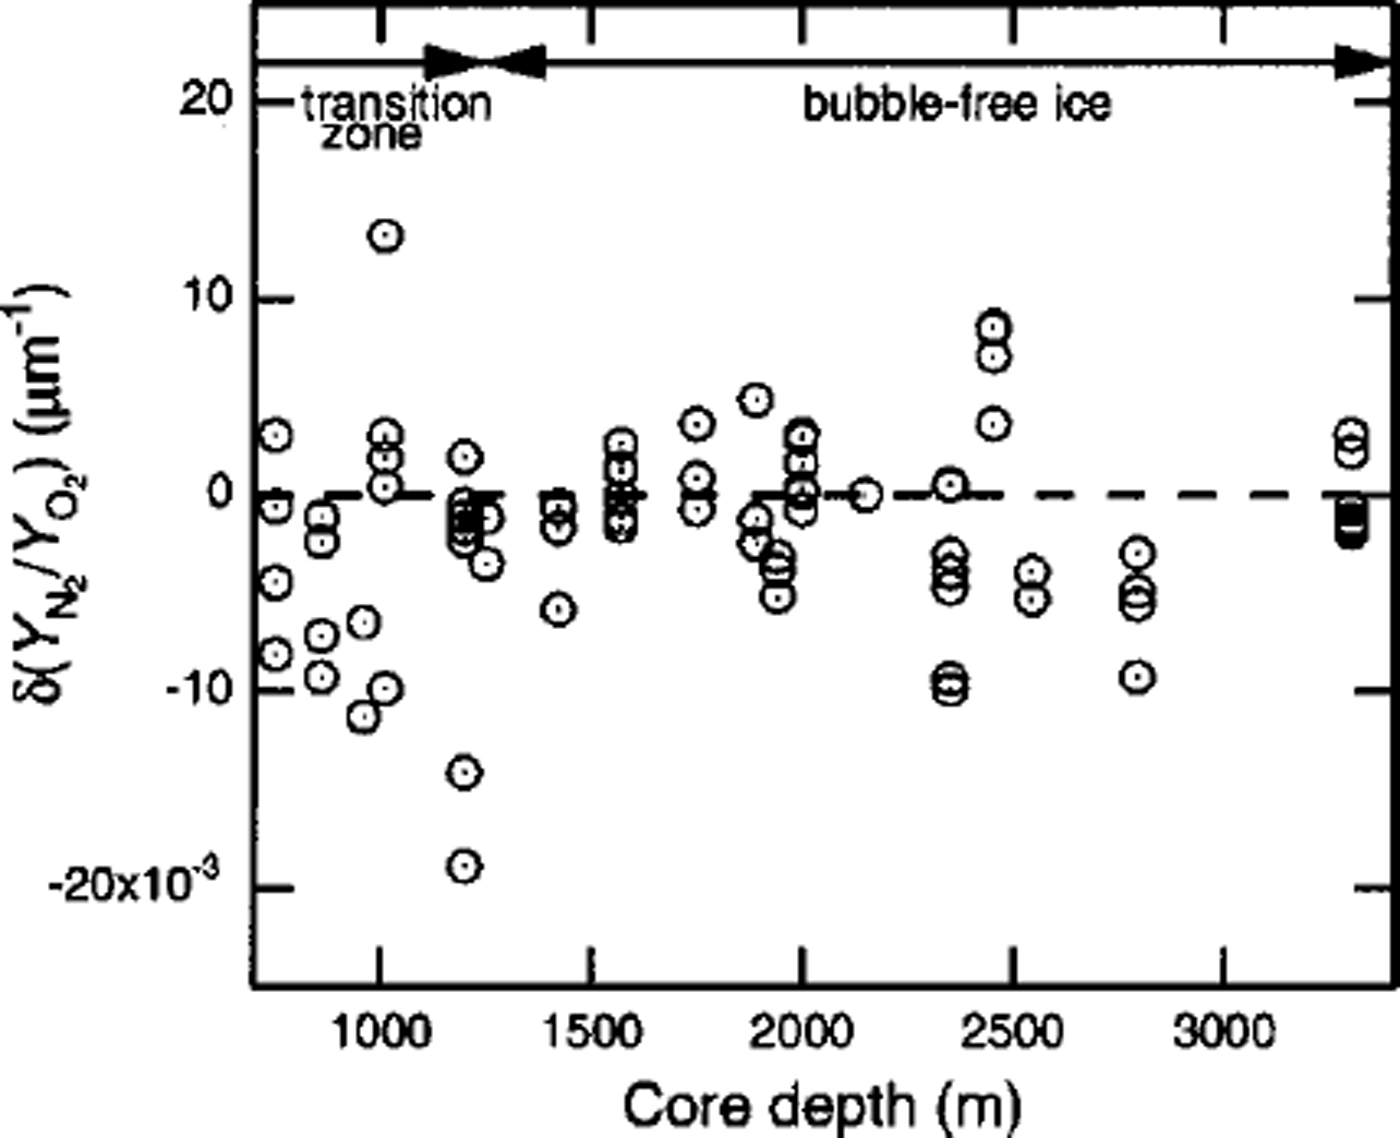
 means that the N2/O2, ratio of the crystal increases with increase in d. The values of for crystals-a, –b and –c are –0.0098,0.0133 and –0.0007μmȡ1, respectively. Figure 2 shows the depth profile of
 of clathrate hydrates in the Vostok ice cores. The values of
 are widely scattered, depending on the individual crystal. However, it can be seen that some crystals at the end of the transition zone have high negative or positive values of
 compared with those at other depths. In addition, the values of
 are systematically negative in the beginning of the transition zone.
Depth profile of
of clathrate hydrates in Vostok ice cores. The broken horizontal line shows the value for a crystal with a homogeneous distribution ( i.e.
 .
The spatial distribution of air molecules within a clathrate hydrate changes with time due to three processes: (1) the initial selective enclathration caused by the difference between the dissociation pressures of pure N2- and 02 - clathrate hydrates, (2) the diffusive mass transfer of air molecules from surrounding air bubbles through the ice matrix, and (3) diffusion of air molecules in the clathrate hydrate crystal. Therefore, the inhomogeneous distribution found in the present study can be explained using the theoretical models (Reference Salamatin, Hondoh, Uchida and LipenkovSalamatin and others, 1998,Reference Salamatin, Lipenkov, Hondoh and Ikeda1999).
To evaluate the diffusive mass fluxes, the conventional cell-model approximation for diluted multiphase media is used (Reference Salamatin, Lipenkov, Hondoh and IkedaSalamatin and others, 1999). For simplicity, the simulations are restricted to the case when the clathrate hydrate crystal, after nucleation, rapidly coats the wall of the air bubble and then grows as a spherical hydrate shell. A spherical air bubble of radius τb coated by a spherical clathrate hydrate shell (with an external radius τh ) is confined to a spherical ice cell of a specific volume related to one inclusion. That is, the radius of the ice cell is given by τ c = (4πN 0/3)–1/3, where N 0 is the number concentration of all inclusions (i.e. clathrate hydrates and air bubbles). The N2 and O2 molecules diffuse through the spherical ice layer toward its center occupied by the semi-bubble with growing clathrate hydrate.
The composition of gas molecules in the clathrate hydrate growing inward (i.e., filling up the air bubble) can be estimated using the solid-solution model (Reference Van der Waals and PlatteeuwVan der Waals and Platteeuw, 1959). The site occupancy of the cages in mixed clathrate hydrate, y, is given by
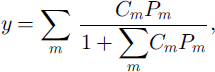
where Cm and Pm are the Langmuir constant and the partial pressure of m-molecule, respectively (Reference Van der Waals and PlatteeuwVan der Waals and Platteeuw, 1959). Under the assumption of equal site occupancy for pure N2- and O2–clathrate hydrates at the dissociation pressures, the composition of the air molecules in the inward-growing clathrate hydrate at d = di, is given by

where YN2(di), YO2(di) and Z N2 di ZO2(di) are the mole fractions of N2 and O2 in the clathrate hydrate and the air

 bubble, respectively, and and are the dissociation pressures of pure N2- and O2–clathrate hydrates.
According to the theory of radial diffusion in a sphere (Reference CrankCrank, 1975), the averaged quantities of diffusing N2 and O2 through the ice layer toward the growing clathrate hydrate are given by
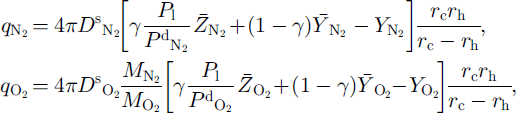
where
 and
 respectively, are the diffusive permeation (self-diffusion) coefficients of N2 and O2 in the ice lattice, at a given temperature and dissociation pressure (Reference Salamatin, Lipenkov, Hondoh and IkedaSalamatin and others, 1999). The diffusive permeation coefficient is given by the product of the diffusion coefficient (m2 s–1) and the fractional concentration (mol molH2O–1) of (or 0 in the ice lattice (Ikeda and others, in press).
 and
 and are the mean mole fractions of N2 and O2 of surrounding, non-nucleated air bubbles,
 and
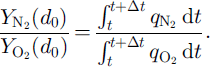
 are the mean mole fractions of N2 and O2 of surrounding, completely formed clathrate hydrates, P1, is the load pressure, MN2 and MO2 are the mole masses of N2 and 02, respectively, and 7 is the averaging parameter, which ranges from 0 to 1 and is assumed to be equal to the number fraction of non-nucleated air bubbles nb in N0, Assuming that the distributions of air molecules are frozen, the composition of the air molecules in the outward-growing clathrate hydrate at d = d
0 is given by
The parameters at the beginning of the transition zone in Vostok ice (600 m depth) are assumed to be T = 220 K (i.e.
 , and
 ,
 ,
 , P
1 = 5.1 MPa, n
b = 1, N
0 = 800 cm–3, and
 (Ikeda and others, in press). The radius of the initial air bubble, τb0, is assumed to be 0.02 mm, since small air bubbles are preferentially transformed to clathrate hydrates (Lipenkov and others, in press).
Figure 3a shows simulated temporal variations in N2/O2 ratios (i.e.
in the portions growing inward and outward in a clathrate hydrate nucleated at 600 m depth. The N2/O2 ratio in the portion formed immediately after the nucleation is 2.7. The N2/O2 ratio in the portion growing inward increases with time, as shown by the solid line in Figure 3a, because of the increase in the N2/O2 ratio in the remaining air bubble. By contrast, the N2/O2 ratio in the portion growing outward decreases rapidly, as shown by the dashed line in Figure 3a. The decrease in the N2/O2 ratio is attributed to the faster diffusion of O2 compared with N2 in the ice lattice (Reference IkedaIkeda and others, 1999). Because there are few clathrate hydrates compared with the number of air bubbles at the beginning of the transition zone, the surrounding non-nucleated air bubbles contribute a large number of air molecules to the clathrate hydrates. Thus, the composition of the portion growing outward changes rapidly.
(a) Temporal variation in N2/O2 ratio in portions growing inward and outward (solid and dashed lines, respectively) in a clathrate at the beginning of the transition zone of Vostok ice core (600 m depth), (b) Spatial distribution of the N2/O2 ratio in the crystal at t = l000 years. The dotted lines show the average N2/O2 ratio in the crystal.
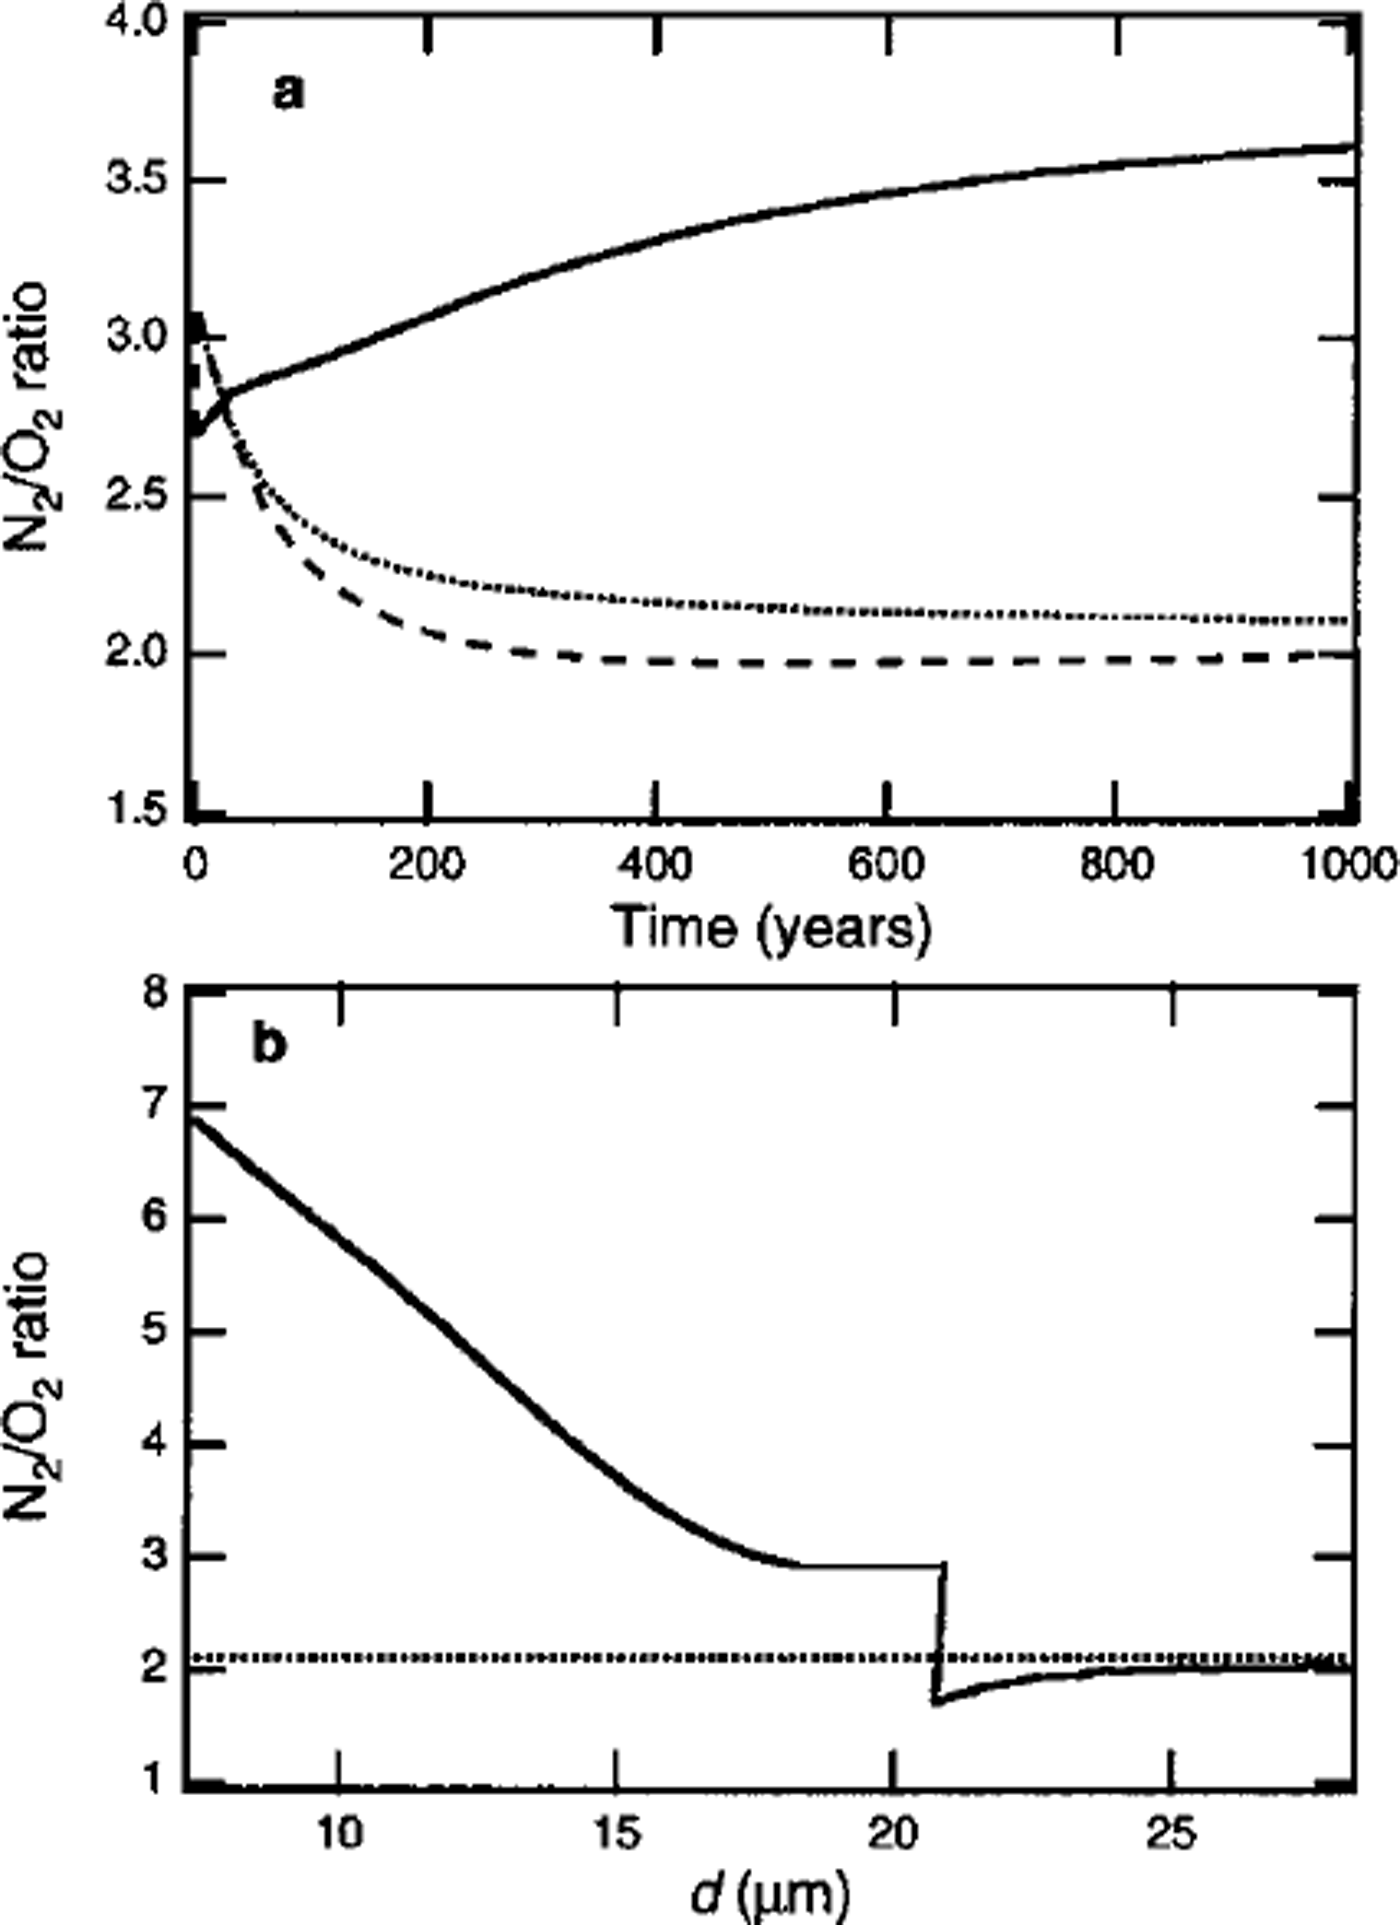
Figure 3b shows the spatial distribution of the N2/O2 ratio in the clathrate hydrate at t = 1000 years, under the assumption that the distributions are frozen during growth. The crystal has a high negative value of
. To estimate the limit of the inhomogeneous distribution, it was assumed that the diffusion rates of air molecules in clathrate hydrate are zero. In reality, however, the significant inhomogeneous distribution that resulted from the initial fractionation is leveled out during the formation of the crystal, because air molecules diffuse in clathrate hydrate. The diffusion coefficients of air molecules in clathrate hydrate are estimated as 0.2–1.3 × 10⁻¹⁴ m2 s-1 1 (at 263 K), about two orders of magnitude less than those in ice (Reference Salamatin, Hondoh, Uchida and LipenkovSalamatin and other, 1998). The time-scale of the diffusion of air molecules in clathrate hydrate, τD, is much less than the time-scale of the hydrostatic compression of air bubbles, τc , in the beginning of the transition zone (Reference Salamatin, Hondoh, Uchida and LipenkovSalamatin and others, 1998). Thus, the distribution of air molecules in the clathrate hydrate formed at the beginning of the transition zone becomes homogeneous (i.e.
during the formation if there is no mass transfer of air molecules through the surrounding ice. However, the
of the crystal changes with time due to the diffusive gas-mass exchange between a clathrate hydrate and its neighbors through the ice matrix. Since the time-scale of the diffusive gas-mass exchange for a clathrate hydrate, τB, is comparable with τ c in the beginning of the transition zone (Reference Salamatin, Lipenkov, Hondoh and IkedaSalamatin and others, 1999), the clathrate hydrate has a negative value of
in the beginning.The value of
gradually increases with depth and reaches a high positive value at the end of the transition zone, because the N2/O2 ratios in the surrounding air bubbles gradually increase with depth. Actually, the values of
are systematically negative in the beginning of the transition zone, and some crystals have positive value in the end of the transition zone as shown in Figure 2. It is thought that the crystal with a high positive value of
at the end of the transition zone was formed at the beginning of the transition zone.
The parameters at the end of the transition zone in Vostok ice (1100 m depth) are assumed to be T = 225 K (i.e.
 , and
 ),
 ,
 P
1 = 9.6 Mpa, n
b = 0.05, N
0 = 800 cm–3
 and r
b0 = 0.05 mm (Reference IkedaIkeda and others, 1999b).
Figure 4a shows simulated temporal variations in N2 / 02 ratios in the portions growing inward and outward in a clathrate hydrate nucleated at 1100 m depth. The outward growth of clathrate hydrate at the end of the transition zone is slow compared with that at the beginning of the transition zone, since the number concentration of air bubbles is low. Thus, the distribution of gas molecules in the clathrate hydrate formed at the end of the transition zone is dominated by inward growth. The N2/O2 ratio in the portion growing inward increases with time, as shown by the solid line in Figure 4a, because of the increase in the N2/O2 ratio in the remaining air bubble.
(a) Temporal variation in N2/O2 ratio in portions growing inward and outward (solid and dashed lines, respectively) in a clathrate at the end of the transition zone of Vostok ice core (1100 m depth), (b) Spatial distribution of the N2/O2 ratio in the crystal at t = 15 years. The dotted lines show the average N2/O2 ratio in the crystal.
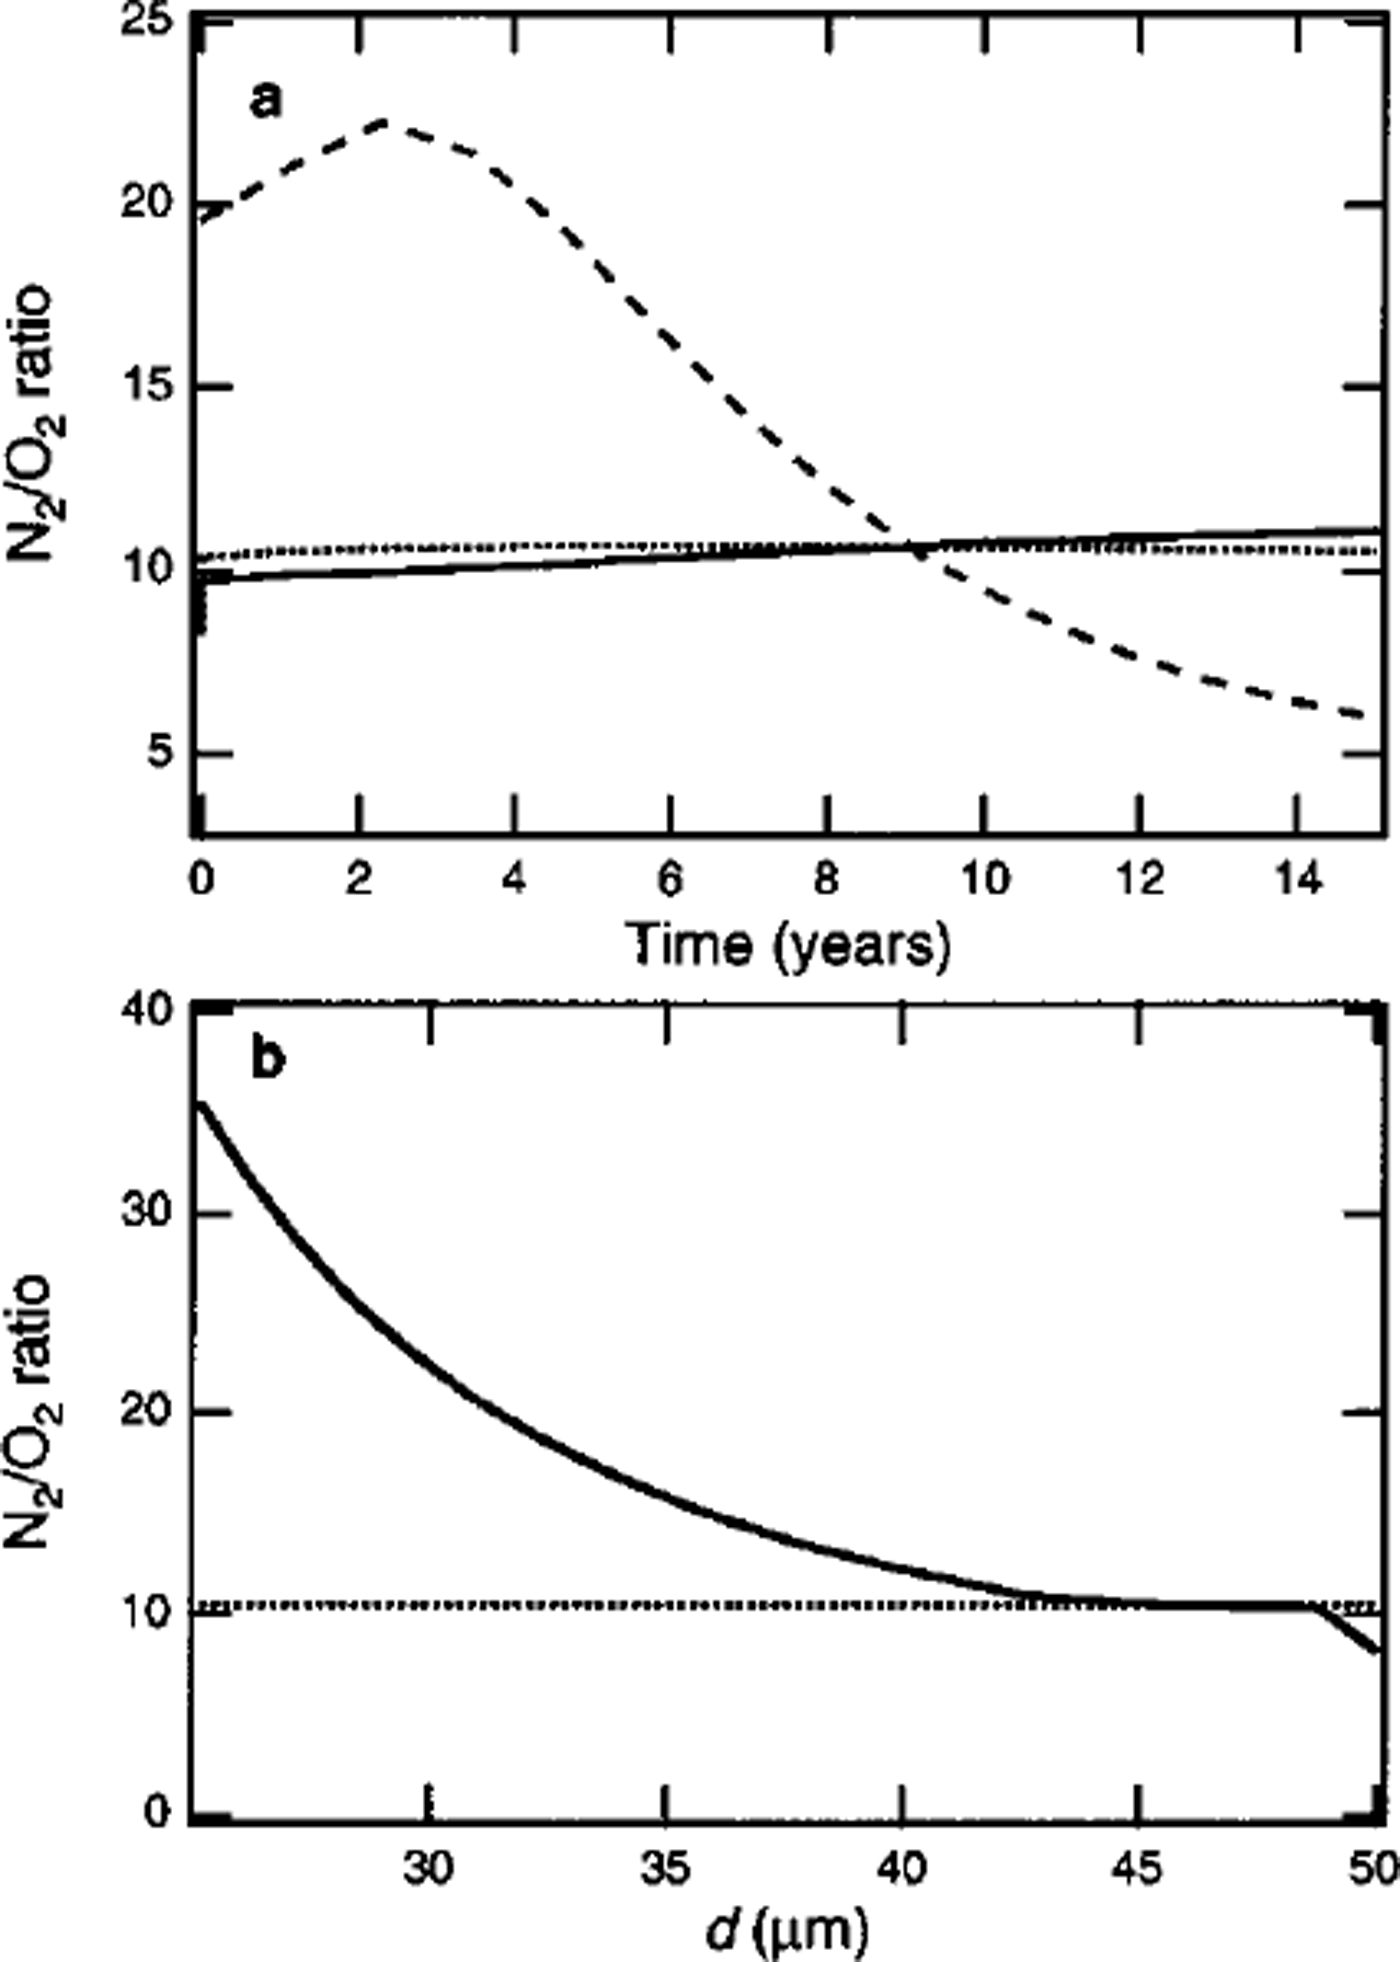
Figure 4b shows the spatial distribution of the N2 / 02 ratio in the clathrate hydrate at t = 15 years, under the assumption that the distributions are frozen during growth. The newly formed crystal at the end of the transition zone has a high negative value of
The scale of τc becomes comparable with τD in the end of the transition zone, because the bubble-compression rate increases with increase in depth (Reference Salamatin, Hondoh, Uchida and LipenkovSalamatin and others, 1998). In addition, τE is much larger than τ c (Reference Salamatin, Lipenkov, Hondoh and IkedaSalamatin and others, 1999). Thus, a high negative value of
remains in the rare crystals formed at the end of the transition zone.
The clathrate hydrate from 1501 m depth in the Dye-3 ice core has a high negative value of
(Reference Fukazawa, Ikeda, Suzuki, Hondoh, Mae and LangwayFukazawa and others, 1996a), because this crystal was formed deeper in the transition zone. On the other hand, the clathrate hydrate from 1475.65 m depth in the GRIP ice core has a homogeneous distribution (Reference Pauer, Kipfstuhl and KuhsPauer and others, 1996), because this crystal was formed at a depth in the middle of the transition zone.
The dissociation pressures as well as the diffusion and compression rates strongly depend on temperature. Therefore, it can be concluded that the pattern of the spatial distribution of air constituents in clathrate hydrate is mainly determined by the depth at which they formed and thermodynamic conditions in the ice sheets. We expect that the pattern of the spatial distribution of air molecules in clathrate hydrate can be used as a measure of the age (i.e. the depth of the formation) of the clathrate hydrate. The age of clathrate hydrate is one of the primary factors for the fractionation process of gas molecules in polar ice sheets. The gas fractionation might have important implications for the interpretation of gas distributions in ice sheets and the paleoatmospheric reconstruction.
Acknowledgements
We would like to thank H. Fukazawa and P. Duval for valuable discussions, and G. K. C. Clarke and T. Sowers for valuable advice. This work was supported by a grant-in-aid for scientific research from the Ministry of Science, Education and Sports, Japan. One of the authors, T.I., has been supported by a Research Fellowship of the Japan Society for the Promotion of Science for Young Scientists.



