Introduction
Both cerebellar and cortical atrophy were described decades ago in middle-aged alcoholics.Reference Allsop and Turner 1 Torvik and Torp found that 42% of autopsied alcoholics showed cerebellar atrophy,Reference Torvik and Torp 2 a figure higher than that described by Yokota et al, who only reported a prevalence of 10.7%.Reference Yokota, Tsuchiya and Terada 3 Higher values, up to 80%, were reported when brain computed tomography (CT) was blindly evaluated by an expert radiologist.Reference Fernandez-Rodriguez, Gonzalez-Reimers and Quintero-Platt 4 Brain atrophy in alcoholics mainly depends on white matter atrophy,Reference de la Monte and Kril 5 although gray matter atrophy, at least affecting the frontal lobe, has also been described.Reference Qin and Crews 6 These changes are associated with the amount of ethanol consumedReference Pfefferbaum, Lim, Desmond and Sullivan 7 , Reference Estruch, Nicolas and Salamero 8 and are partially reversible with abstinence.Reference Pfefferbaum, Rosenbloom and Chu 9 Treatment-naïve alcoholic patients show a steeper age-related gray matter shrinkage than the nonalcoholic population.Reference Fein, Shimotsu and Barakos 10 Alcoholics also frequently suffer from chronic myopathy, a usually painless muscle wasting disease that may cause weakness and even tetraparesis in severe cases.Reference Martin, Slavin and Levi 11 , Reference Preedy and Peters 12
In the last two decades, several lines of evidence strongly suggest that there is a link between muscle and brain.Reference Cooper, Moon and van Praag 13 In experimental studies, it was shown that exercise increases synaptic plasticity in hippocampal neurons, neurogenesis, and learning,Reference van Praag, Christie, Sejnowski and Gage 14 , Reference van Praag, Shubert, Zhao and Gage 15 and many observational studies support the hypothesis that exercise slows cognitive impairment associated with neurodegenerative processes such as Alzheimer’s disease.Reference Guure, Ibrahim, Adam and Said 16 In this sense, it was shown that muscle activity induces the liberation and/or expression of several myokines with neurotrophic effects.Reference Pedersen, Pedersen, Krabbe, Bruunsgaard, Matthews and Febbraio 17 , Reference Pedersen 18 Brain-derived neurotrophic factor (BDNF) is one of these mediators. Serum levels of BDNF increase after muscle activity,Reference Heyman, Gamelin and Goekint 19 an effect mainly due to increased brain (especially hippocampal) expression and secretion.Reference Rasmussen, Brassard and Adser 20 During exercise, muscle BDNF expression also increases, but it is not secreted, being involved in AMPK-dependent fat oxidation, facilitating muscle contraction.Reference Matthews, Astrom and Chan 21
In addition to its neurotrophic effect, BDNF protects mitochondria against oxidative damage and exerts antiapoptotic effects.Reference Chen, Wu, Hwang and Yang 22 Therefore, reduced BDNF may be also associated with brain dysfunction,Reference Laske, Stransky and Leyhe 23 , Reference Zuccato and Cattaneo 24 and there is a direct relationship between BDNF values and hippocampus volume in older adults.Reference Erickson, Prakash and Voss 25
Altered BDNF values have been reported in alcoholics. Some experimental data have shown that acute ethanol administration increases BDNF expression in the dorsal striatum,Reference Logrip, Barak, Warnault and Ron 26 and that this increase in BDNF may attenuate ethanol ingestion.Reference Hensler, Ladenheim and Lyons 27 , Reference Jeanblanc, Logrip, Janak and Ron 28 On the contrary, chronic, excessive ethanol consumption blunts BDNF expression, especially in the medial prefrontal cortex, leading to decreased levels in chronic alcoholics, and disrupting the modulating effect on ethanol drinking.Reference Logrip, Barak, Warnault and Ron 26 Therefore, the cortico-striatal BDNF pathway seems to play a homeostatic role, modulating excessive intake, a circuitry that becomes disrupted by excessive drinking. There is, however, some disparity in relation with plasma or serum BDNF levels in alcoholics. A recent meta-analysis suggests lower serum BDNF values among these patients.Reference Ornell, Hansen and Schuch 29
In any case, the association between reduced BDNF levels and the intensity of brain atrophy in alcoholics has been less explored. This issue may be important, since BDNF production may be reduced not only by an atrophied brain, but also by impaired secretion of muscle-derived myokines that play a role on brain BDNF secretion.Reference Pedersen 30 Indeed, it was shown that muscle activity releases cathepsin B, which, in turn, increases BDNF production by brain, therefore enhancing neurogenesis, memory, and learning.Reference Moon, Becke and Berron 31 Other myokines, such as irisin, may be also involved in a similar process.Reference Wrann, White and Salogiannnis 32
As reported earlier, ethanol provokes muscle atrophy. To the best of our knowledge, there are no experimental reports showing that ethanol-induced atrophied muscle leads to reduced brain BDNF secretion, and clinical observations recording the eventual relationships among brain atrophy, muscle function, and BDNF levels in alcoholics are also lacking. Therefore, we have performed this clinical observational study in order to analyze serum BDNF levels in alcoholic patients and their relations to muscle strength, ethanol intake, liver function derangement, and the degree of brain atrophy assessed both quantitatively and semiquantitatively by CT.
Patients and Methods
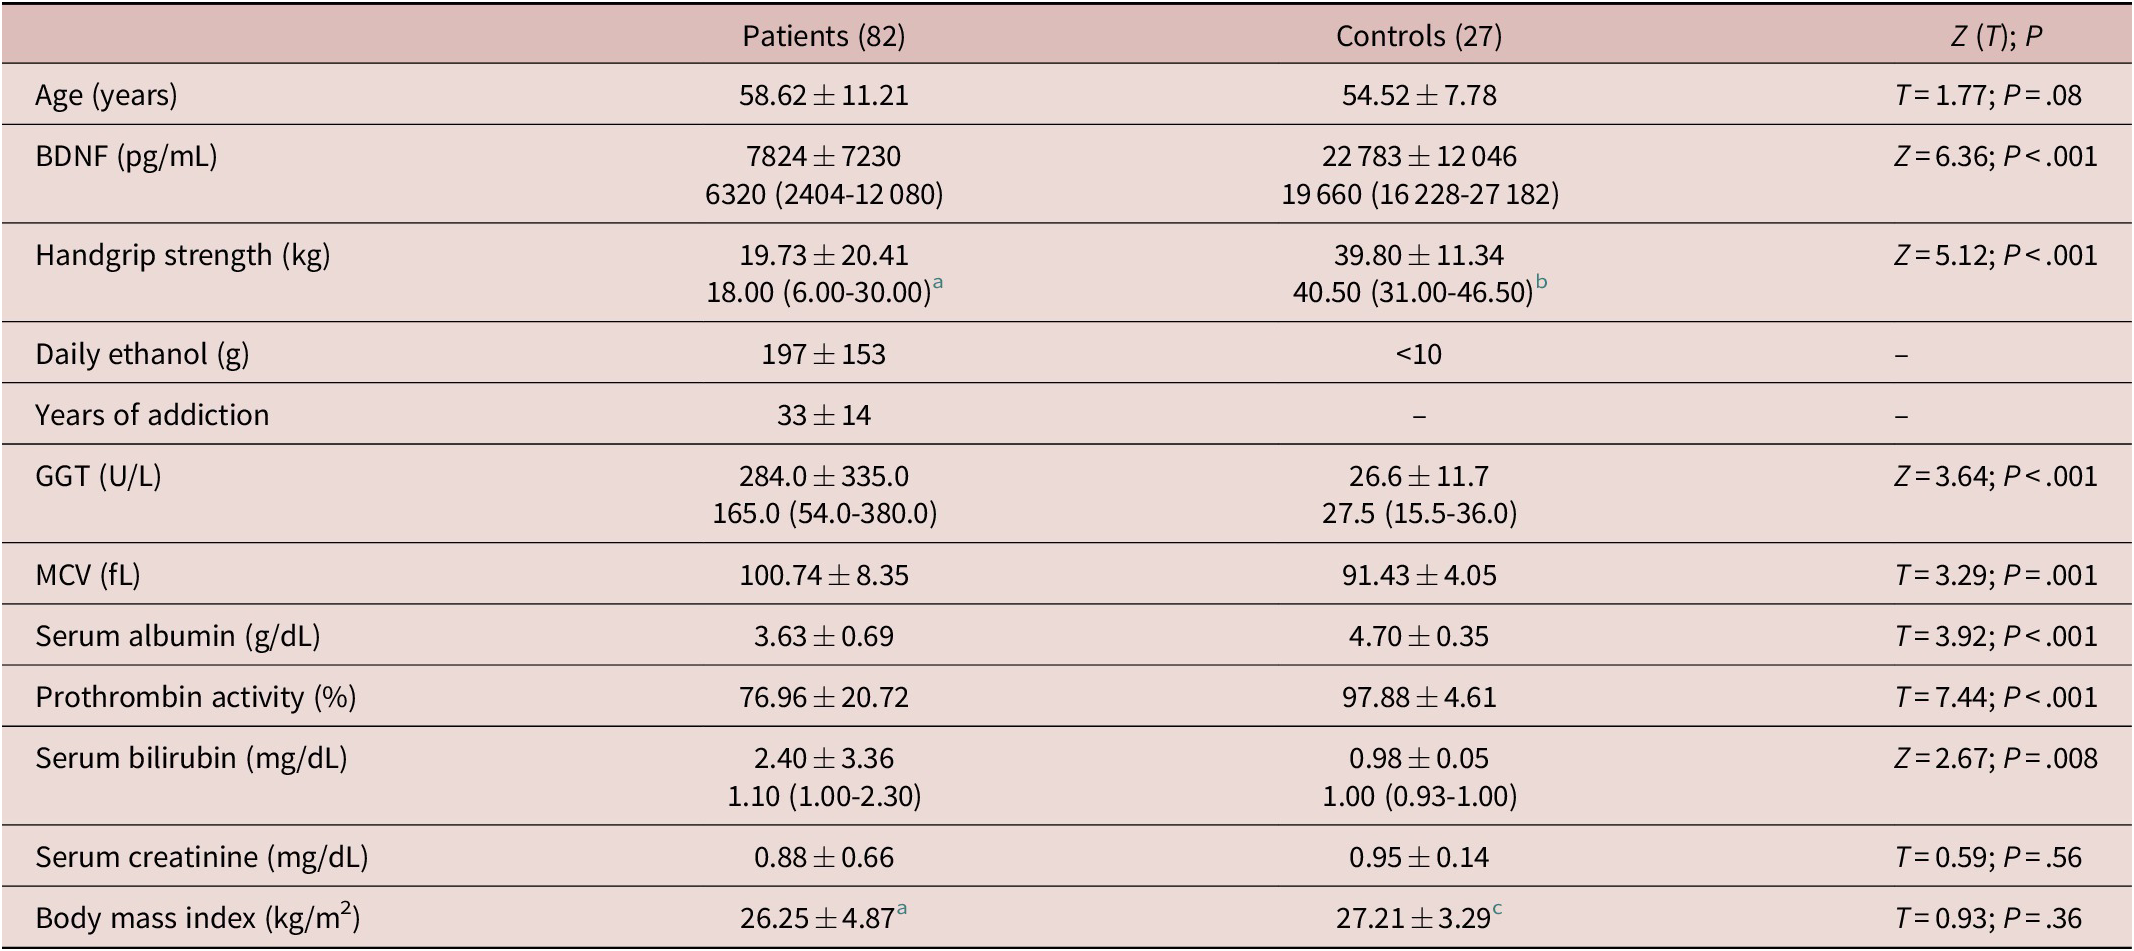
We only included men in this study by two main reasons: the low prevalence of alcoholic women (not included in this prospective study) in our geographical area, and the expected gender-associated differences in handgrip strength that could distort the interpretation of the results. Therefore, in this observational study, we prospectively included 82 male patients aged 58.62 ± 11.21 years and 27 male controls of similar age (54.52 ± 7.78 years, T = 1.77; non-significant), who were recruited among hospital workers. In Table 1, we provide some data of both groups. All patients were heavy drinkers (Table 1) of only wine (38 cases), only beer (4 cases), only spirits (8 cases), and mixed distilled or nondistilled beverages (32 cases), and were admitted for organic complications related to ethanol ingestion. Main causes for hospital admission included major manifestations of alcohol withdrawal syndrome, such as seizures and/or delirium (38 cases), decompensated liver cirrhosis (22 cases), and sepsis (6 cases). Only five patients showed positive anti-hepatitis C virus antibodies and only two patients showed positive hepatitis B virus surface antigen. None of the patients was infected by human immunodeficiency virus. In addition, 29 patients suffered hypertension and 15 suffered diabetes. Excluding patients with ascitis (12), only 8 showed values of body mass index (BMI) over 30 kg/m2. Median BMI value was 26.25 kg/mReference Torvik and Torp 2 and interquartile range, 23.78 to 27.64 kg/m2 (Table 1).
Some Biological Features of Patients and Controls, Relevant for This Study

Abbreviations: BDNF, brain-derived neurotrophic factor; GGT, gamma-glutamyl transferase; MCV, mean corpuscular volume.
a n = 63.
b n = 20.
c n = 24.
Data about duration of addiction and intensity of consumption were also confirmed by asking the patients’ relatives. Patients with comorbid psychiatric conditions, as well as those who also consumed other drugs besides tobacco, were excluded. Fifty-seven patients smoked tobacco (40.0 [22.5-60.0] pack-years, as median and interquartile range).
All patients underwent complete laboratory evaluation and abdominal ultrasound exploration. They were classified as cirrhotics (32 cases in total) when liver was irregular in shape, heterogeneous in texture, and splenomegaly and/or portal dilatation were observed, together with altered levels either of albumin, bilirubin, or prothrombin activity.
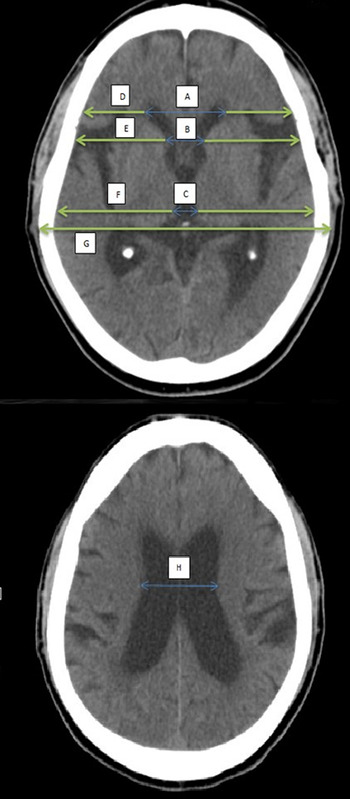
All patients underwent complete physical examination. Assessment of handgrip strength with a Collins dynamometer was performed to 63 patients. The patients underwent CT examination at admission, using a Toshiba Astelion TCX-034A/4C CT. From the CT images, we calculated the indices shown in Figure 1. In five cases, technical problems (moved images) precluded accurate calculation of these indices. Patients’ CT data were compared with those derived from a historical control group composed of 39 age-matched male hospital workers, drinkers of less than 10-g ethanol/day, who underwent CT examination due to traumatic injury or headache.
Brain computed tomography, indicating the different indices used in this study and how were they calculated: Bifrontal index = maximum width of frontal horns/skull width at the same level = A/D. Evans index = maximum width of frontal horns/skull width at the level of the third ventricle = A/F. Bicaudate index = minimum width of lateral ventricles/skull width at the same level = B/E. Ventricular index = minimum width of lateral ventricles/maximum width of frontal horns = B/A. Cella index = width of the third ventricle/skull width at the same level = C/F. Celda media index = maximum width of the skull/width of lateral ventricles = G/H.

BDNF and biochemical parameters
Within the first 72 hours after admission, blood samples were taken at 8:00 a.m. in fasting conditions and were immediately frozen at −20°C. In addition to routine laboratory evaluation, serum BDNF levels were determined by quantitative sandwich enzyme immunoassay technique. Sensitivity stated by the manufacturer was 20 pg/mL (R&D Systems, Abingdon Science Park, Abingdon, UK). Inter-assay variation coefficient ranges 7.6% to 11.3%; intra-assay variation coefficient was 3.8% to 6.2%; and recovery ranged 93% to 100% (data provided by the manufacturer).
Statistics
The Kolmogorov–Smirnov test was used to explore whether the variables showed a normal distribution or not, a condition not fulfilled by several of them. Therefore, nonparametric tests (Mann–Whitney’s U test and eventually the Kruskal–Wallis [KW] test) were used to analyze differences of these parameters between groups. Student’s t test, variance analysis, and Pearson’s correlation analysis were used with the variables with a normal distribution, whereas Spearman’s ρ (instead of Pearson’s correlation) was utilized in the case of nonparametric variables. Multivariable analyses were also performed when appropriate, as indicated in the “Results” section. These analyses were performed with SPSS software (15.0) (Chicago, IL).
The study protocol was approved by the local ethical committee of our hospital (number 2017/50) and conforms to the ethical guidelines of the 1975 Declaration of Helsinki. All patients gave their written informed consent.
This research did not receive any specific grant from funding agencies in the public, commercial, or not-for-profit sectors.
Results
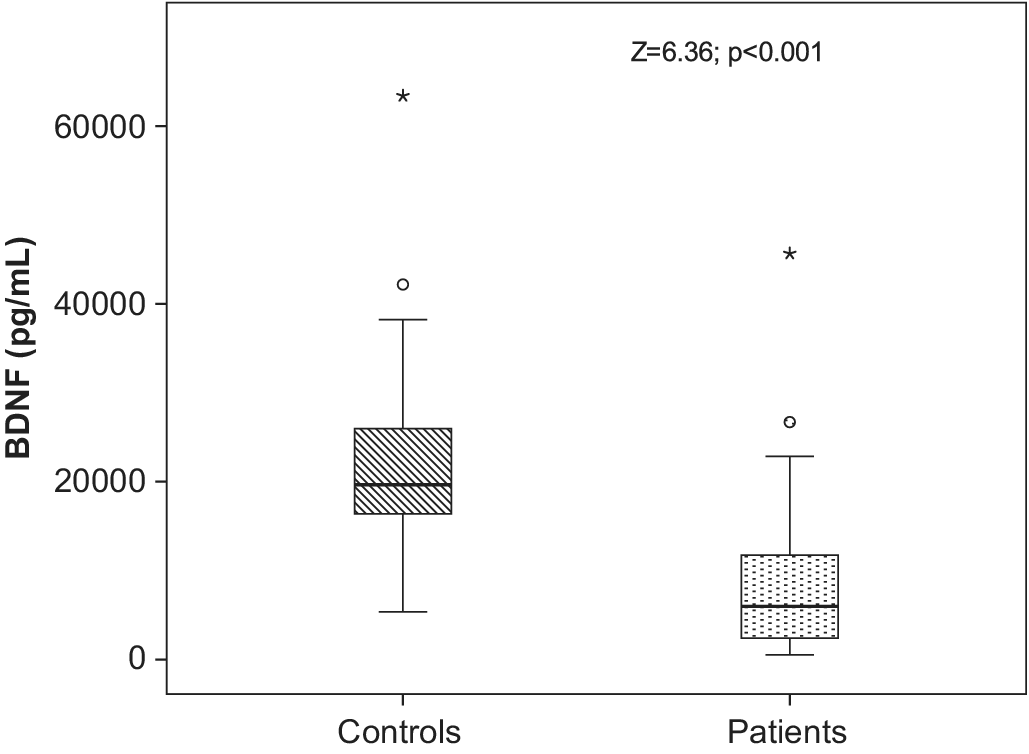
Serum BDNF levels were significantly lower among patients (Z = 6.36; P < .001, Figure 2). No correlations were found between BDNF and daily ethanol consumption or duration of ethanol consumption, or between BDNF and age. Also, no correlation between BDNF and age was observed when controls were also included in the analysis.
Serum brain-derived neurotrophic factor levels were significantly lower among patients (Z = 6.36; P < .001).

Handgrip strength was clearly reduced among patients (Z = 5.12; P < .001) compared with controls. Including both patients and controls, there was an inverse correlation between age and handgrip strength (ρ = −0.52, P < .001), something that was also observed when only patients were included (ρ = −0.63; P < .001). However, no correlation was observed between handgrip strength and daily amount of ethanol consumption (ρ = 0.07; P = .58), but indeed between handgrip strength and duration of ethanol addiction (ρ = −0.39; P = .002), a correlation that was displaced by age was observed when a multivariable analysis (including age and duration of ethanol addiction) was performed. Handgrip strength was significantly related to BMI when patients and controls were pooled together (ρ = 0.29; P = .02).
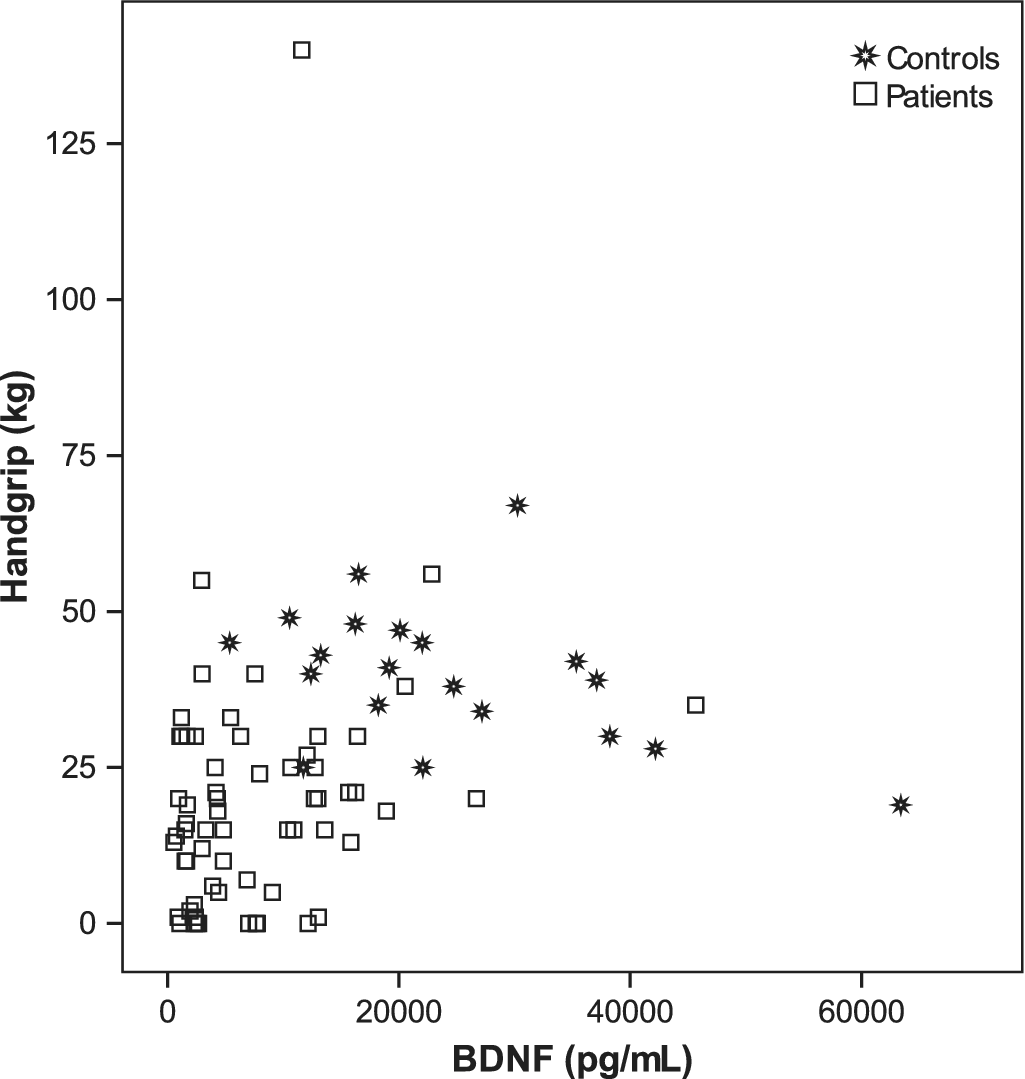
Including both patients and controls, a significant correlation was observed between BDNF and handgrip strength (Figure 3) (ρ = 0.47; P < .001), a statistical significance that still persisted (P = .032) when age was also included (together with handgrip strength) in a multivariable analysis. A significant correlation between BDNF and handgrip was also observed when only patients were included (ρ = 0.25; P = .05). Indeed, patients with BDNF in the highest tercile showed significantly increased handgrip strength (27.86 ± 28.40 kg) than the remaining patients (15.66 ± 13.62 kg; Z = 2.22; P = .026). Considering only patients aged more than 59 years (median of our series), a strong correlation was observed between BDNF values and handgrip strength (r = .57; P < .001), that was even stronger when also controls were included (r = .68; P < .001), that was independent on age in the multivariable analysis.
Correlation between brain-derived neurotrophic factor and handgrip strength among patients and controls (ρ = 0.47; P < .001).

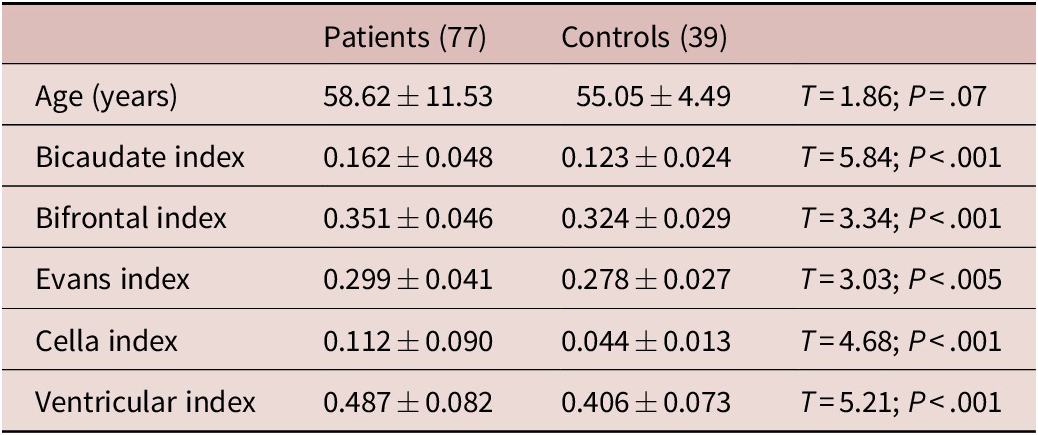
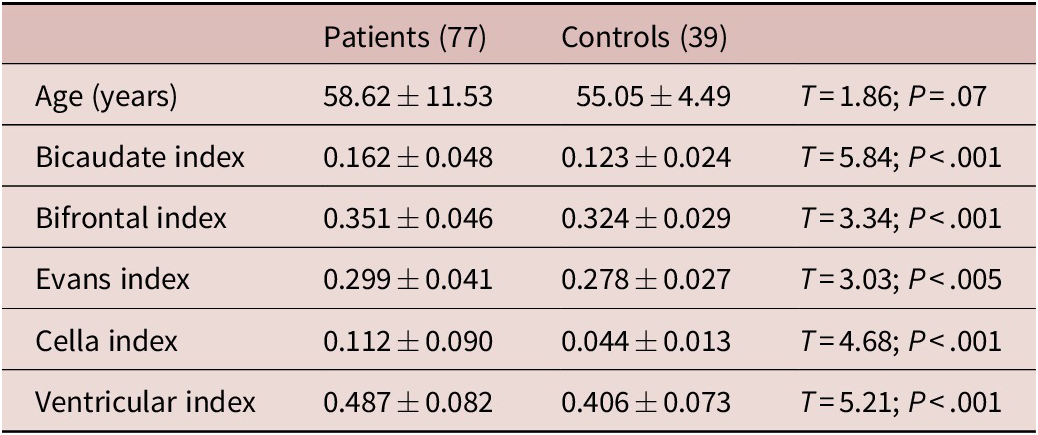
Patients showed markedly altered values of the CT indices when compared with a historical control group, composed of 39 individuals of similar age (Table 2). Reduced handgrip strength was directly related to the intensity of cortical atrophy. Indeed, we found that handgrip strength was inversely related to bicaudate index (ρ = −0.52), cella index (ρ = −0.35), bifrontal index (ρ = −0.53), Evans index (ρ = −0.50), P < .01 in all cases, and also ventricular index (ρ = −0.30; P = .02). However, relationships between BDNF values with CT-derived indices were not statistically significant, both in the whole group and considering only patients aged >59 years.
Brain Computed Tomography-Derived Indices in Patients and Controls
No relationships were observed between BDNF values and bilirubin or prothrombin activity, but between BDNF and serum albumin (ρ = 0.30; P = .003). However, no differences were observed among cirrhotics and noncirrhotics (Z = 1.06; P = .29), or among patients classified as belonging to child A (62), B (15), or C (5) groups (KW = 0.84; P = .66). Also, we failed to find differences in BDNF among patients admitted for delirium tremens and those admitted for other reasons (Z = 0.80; P = .42), and no differences were observed among patients with or without hypertension (Z = 1.36; P = .18) or with or without diabetes (Z = 0.63; P = .53). No relationship at all were observed between BMI and serum BDNF levels among patients (ρ = 0.004; P = .98) or among controls (ρ = 0.32; P = .11), and no differences existed among smokers and nonsmokers (Z = 0.84; P = .40). BDNF was not related to the number of pack-years (ρ = 0.20; P = .09).
Discussion
In this study, we found that serum BDNF levels are markedly decreased in alcoholics. This result agrees with those reported by Joe et alReference Joe, Kim and Kim 33 and Umene-Nakano et alReference Umene-Nakano, Yoshimura and Ikenouchi-Sugita 34 but not with those of Huang et al,Reference Huang, Chen and Chen 35 who reported normal values, or with the higher values obtained by Lee et al,Reference Lee, Choi and Kim 36 as examples of the disparate results existing in the literature regarding this item.
The individuals included in this study, all of them heavy alcoholics, also showed a marked decrease in handgrip strength when compared with controls, and also a high prevalence of cortical and cerebellar atrophy and markedly altered values of the CT indices that measure the degree of ventricular dilatation. Handgrip strength was related to brain atrophy. In accordance with this result, in a previous study, we showed that, among alcoholics, there is a close correlation between handgrip strength and brain atrophy, that is independent of age, duration of ethanol consumption, and liver functionReference Romero-Acevedo, Gonzalez-Reimers and Martin-Gonzalez 37 suggesting the existence of a link between muscle performance and brain atrophy in alcoholics.
In this study, serum BDNF was related to handgrip strength. As previously commented, BDNF is produced by several tissues, including muscle fibers.Reference Pedersen, Pedersen, Krabbe, Bruunsgaard, Matthews and Febbraio 17 Muscle contraction is a major contributor to the increased expression of this myokine in muscle fibers, although this does not necessarily mean that serum BDNF levels increase. However, muscle contraction also leads to secretion of other myokines, such as cathepsin B, able to enhance BDNF brain secretion.Reference Moon, Becke and Berron 31 Therefore, rather than secreted by muscle, it seems that the increased BDNF values observed in relation to exercise are produced by the brain under the influence of muscle-derived myokines such as cathepsin B and possibly other molecules, such as irisin.Reference Wrann, White and Salogiannnis 32 This may explain the findings reported by other authors,Reference van Praag, Christie, Sejnowski and Gage 14 who found that exercise enhances neurogenesis and increases hippocampal synaptic plasticity in murine models. Several clinical studies also suggest that physical activity delays the evolution of neurodegenerative diseases such as Alzheimer’s disease.Reference Guure, Ibrahim, Adam and Said 16 In any case, BDNF serum levels increase with muscle activity, mainly by increased cerebral expression and secretion of this molecule,Reference Heyman, Gamelin and Goekint 19 , Reference Rasmussen, Brassard and Adser 20 , Reference Gallego, Cox, Funk, Foster and Ehringer 38 , Reference Lee, Ahmad, Wang and Leenen 39 and it is assumed that BDNF is the main mediator of the beneficial effect of exercise on the evolution of Alzheimer’s disease.Reference Nigam, Xu, Kritikou, Marosi, Brodin and Mattson 40
In this study, we found low BDNF values in a condition in which brain atrophy is frequent, as alcoholism, affecting 74% of the patients included in this series. In this sense, our results are comparable to those shown in several other reports, in which low-serum BDNF levels have been found in neurodegenerative situations, including advanced Alzheimer’s disease,Reference Laske, Stransky and Leyhe 23 Huntington’s disease, and Parkinson’s disease,Reference Zuccato and Cattaneo 24 as well as among patients with major depression,Reference Karege, Perret, Bondolfi, Schwald, Bertschy and Aubry 41 obese diabeticsReference Krabbe, Nielsen and Krogh-Madsen 42 (in contrast with the findings of this study), patients with multiple sclerosis,Reference Wens, Keytsman, Deckx, Cools, Dalgas and Eijnde 43 or consumers of a high fat-containing diet.Reference Molteni, Wu, Vaynman, Ying, Barnard and Gomez-Pinilla 44 However, surprisingly, we failed to find any relation between the intensity of brain atrophy and BDNF values, perhaps because several other factors may contribute to brain atrophy, such as oxidative damage, inflammation, vitamin/micronutrients deficiency, or direct effect of ethanol, or perhaps because the severity of brain atrophy among the patients included in this study. In any case, it seems clear that in our series of alcoholics, with a high prevalence of brain atrophy, BDNF values are low compared with controls, in a similar fashion as reported when BDNF was measured in other conditions associated with brain atrophy.Reference Laske, Stransky and Leyhe 23
In all these neurodegenerative conditions mentioned before, as well as in alcoholics, it is difficult to discern whether the decreased BDNF levels are the cause or the consequence of brain atrophy: either atrophied brain produces lower amounts of BDNF or atrophied muscle produces scarce amounts of myokines that enhance brain BDNF expression, leading to brain atrophy. The design of this study does not allow an answer to this question, but altered BDNF was related to handgrip strength rather than to cortical atrophy, suggesting a greater importance of muscle dysfunction on BDNF values, especially in the oldest group of patients.
We failed to find differences in BDNF values among cirrhotics and noncirrhotics. Moreover, no relation was observed between BDNF and Child–Pugh’s score, although serum albumin was related to BDNF. By contrast, other authors do find lower BDNF values in cirrhotics.Reference Garcia-Marchena, Silva-Pena and Martin-Velasco 45 Perhaps the relatively short number of patients with advanced liver damage (child B or C groups), which may constitute a shortage of this study, may account for the lack of differences observed. It is also remarkable that BDNF values were not related to age or to the amount of ethanol consumed.
As said before, we excluded patients with psychiatric disorders (besides alcohol addiction). All the patients included in this study were heavy drinkers. Most of them lived in rural areas and worked in agriculture. They were mainly wine drinkers—in many cases, they consumed the wine they produced—and they did not use any other drug besides tobacco. This pattern of alcohol consumption and style of life may differ from that of alcoholics living in large urban areas. In this sense, perhaps, our data may not be applicable to an urban population of alcoholics, something that may be viewed both as a limitation of this study, but also as a strength of it, since the interpretation of the alterations in serum BDNF values observed in this study is not obscured by other coexisting neuropsychiatric conditions or consumption of other drugs. Indeed, as commented before, major depression and other neuropsychiatric conditions may affect BDNF levels.Reference Karege, Perret, Bondolfi, Schwald, Bertschy and Aubry 41
Conclusion
All these data suggest that the decreased BDNF serum levels observed in alcoholics are related to reduced handgrip strength rather than to age, brain atrophy, liver dysfunction, or the amount of ethanol consumed. The relationship with muscle function impairment is more marked in older individuals.
Funding
This research received no specific grant from any funding agency, commercial, or not-for-profit sectors.
Disclosure
The authors have nothing to disclose.
Acknowledgment
The authors thank Internal Medicine Unit of Hospital Universitario de Canarias for collaboration in this study.