





1 Introduction
Laser-induced damage to high-energy laser facilities is a critical issue[ Reference Miquel, lion and Vivini 1 , Reference Néauport, Airiau, Beck, Belon, Bordenave, Bouillet, Chanal, Chappuis, Coic, Courchinoux, Denis, Gaudfrin, Gaudfrin, Gendeau, Heymans, Julien, Lacombe, Lamy, Lebeaux, Luttmann, Modelin, Perrin, Ribeyre, Rouyer, Tournemenne, Valla and Vermersch 2 ]. It increases the operating costs and reduces the laser chain availability for experimental campaigns. Strong efforts are devoted to improving the quality of optical component polishing[ Reference Baisden, Atherton, Hawley, Land, Menapace, Miller, Runkel, Spaeth, Stolz, Suratwala, Wegner and Wong 3 ] and to decreasing the pollution level within laser chains in order to reduce laser damage. Another challenging aspect consists of mitigating nonlinear propagative processes[ Reference Manes, Spaeth, Adams, Bowers, Bude, Carr, Conder, Cross, Demos, Nicola, Dixit, Feigenbaum, Finucane, Guss, Henesian, Honig, Kalantar, Kegelmeyer, Liao, MacGowan, Matthews, MacCandless, Mehta, Miller, Negres, Norton, Nostrand, Orth, Sacks, Shaw, Siegel, Stolz, Suratwala, Trenholme, Wegner, Whitman, Widmayer and Yang 4 ], such as for example the Kerr effect[ Reference Boyd 5 ], originating from the nonlinear part of the refractive index. Soileau et al. [ Reference Soileau, Williams, Mansour and Van Stryland 6 ] have shown that the fused silica nonlinear refractive index is lowered when the laser beam polarization is converted from linear to circular. Bonod et al. [ Reference Bonod, Branceau, Daurios, Grosjean, Roquin, Gleyze, Lamaignère and Néauport 7 ] have experimentally observed that this linear to circular laser polarization conversion reduces the number of filaments generated by a noisy top hat laser beam propagating in a thick fused silica sample. Laser-induced damage is triggered by the photo-ionization process, which generates electron plasma, enabling energy transfer from the laser to the substrate. Thus, the influence of circular polarization on laser-induced damage requires one to analyze its impact on both combined effects: the nonlinear Kerr effect leading to a laser intensity increase and the photo-ionization process responsible for the electron plasma generation.
In Ref. [Reference Nuter8], we have theoretically demonstrated that the photo-ionization process depends on laser polarization when the ratio of the material bandgap over the photon energy is sufficiently high. By performing Kerr-free measurements of laser-induced damage on a fused silica sample[ Reference Nuter, Kandy, Gallais, Grosjean, Lamaignère, Wagner and Natoli 9 ], we have shown that a linearly polarized infrared laser beam produces a higher damage density on a sample front surface than a circularly polarized one. In contrast, experimental measurements performed with an ultraviolet (UV) laser beam exhibit no difference in the damage density between the two laser polarizations.
In this present work, we explore the influence of circular beam polarization on a laser beam propagating in fused silica samples. Firstly, we measure, for both laser polarizations, the nonlinear gain acquired by the laser beam as it propagates within a thick sample. We use the statistical analysis developed by Garnier[ Reference Garnier 10 ] to bring a theoretical support to these experimental measurements. Then, we study the laser-induced damage generated on the rear surface of fused silica samples. We thus look at the influence of laser polarization on both nonlinear processes, which are the Kerr effect and the photo-ionization process. To acquire in-depth knowledge of this polarization impact, we consider two sample thicknesses, 10 and 34 mm, and two beam spatial shapes, a small size Gaussian shaped beam mostly found in high-intensity laser facilities or in laser testbed and a large laser noisy top hat beam characterizing high-energy laser systems. We first look at the laser-induced damage initiation, which displays a difference in beam polarization dependent damage between thin and thick components. Then, we look at the damage growth where no impact of polarization is observed. Finally, we focus our attention on the multifilamentation process: a linear to circular polarization conversion reduces the number of filaments and increases the filamentation threshold intensity.
2 Nonlinear gain of the laser beam power spectral density
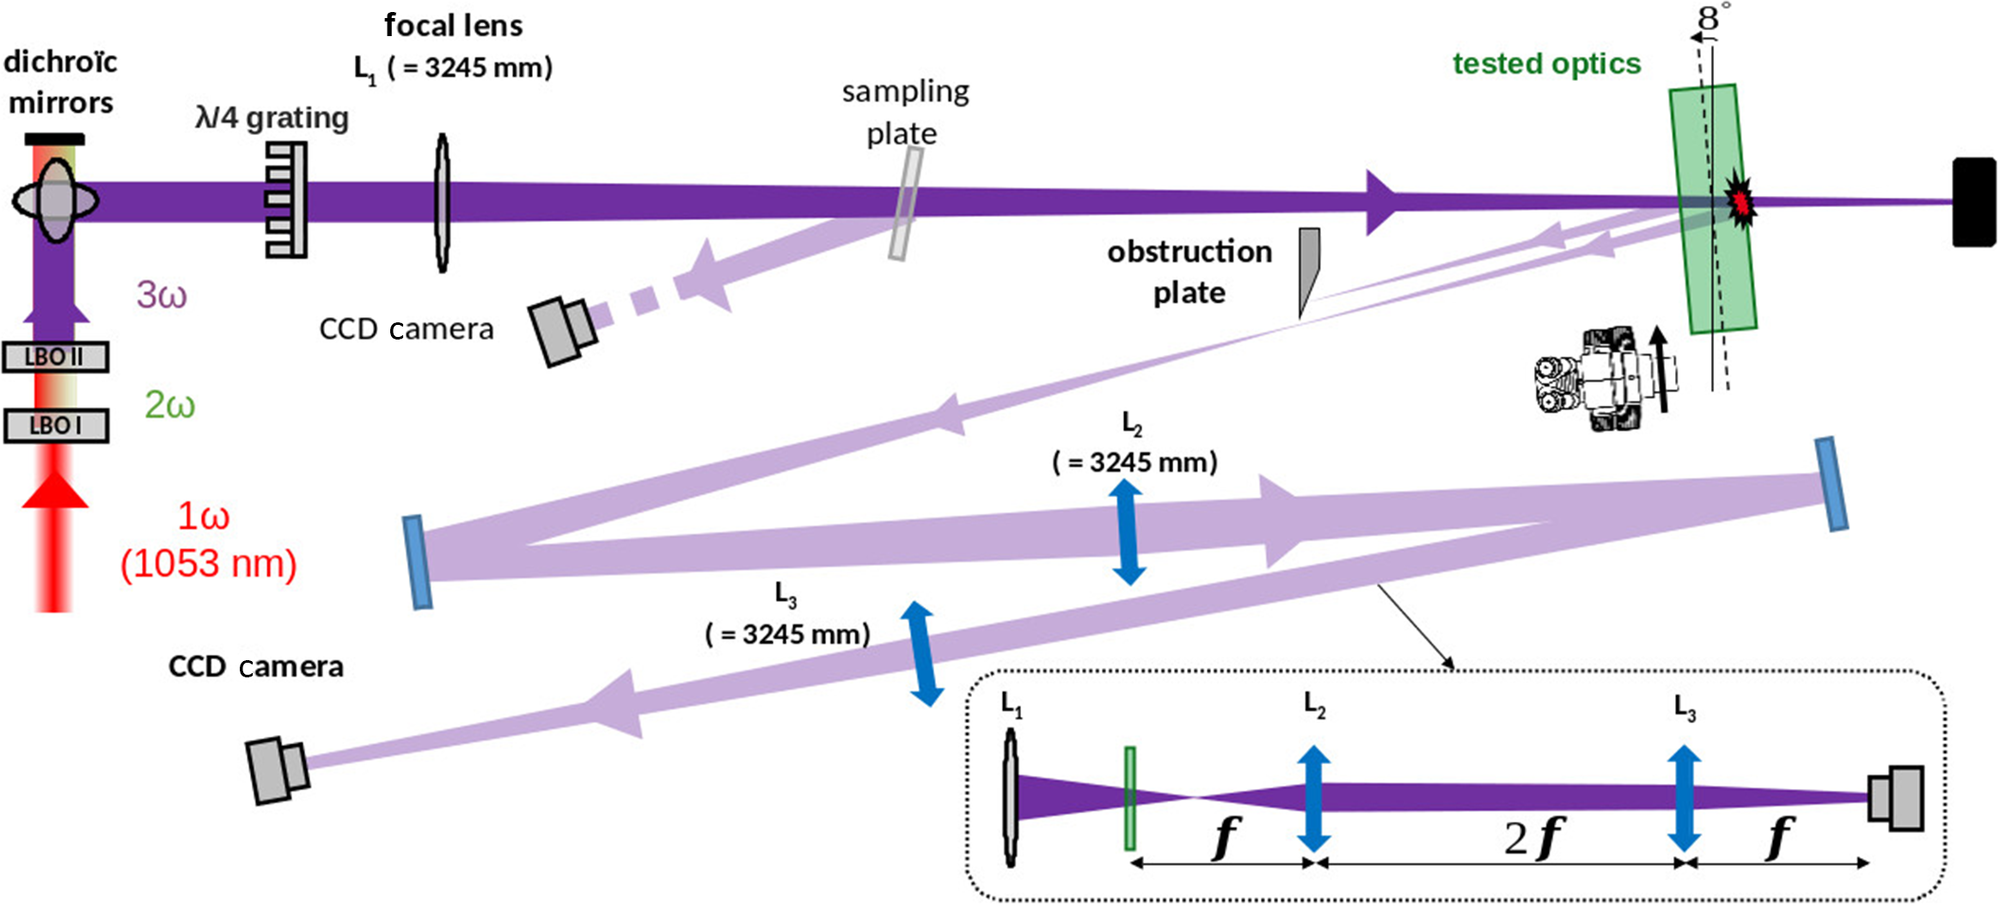
Firstly, we look at the influence of the laser beam polarization on the nonlinear Kerr process experienced by the laser beam as it propagates within a thick optical component. These measurements were realized with the MELBA laser testbed, as presented in Figure 1. A spatially and temporally shaped laser beam at 1053 nm is frequency converted to 351 nm with the help of two lithium triborate (LBO) nonlinear crystals in type I/II configurations. The UV laser beam is characterized with a noisy top hat spatial shape with a diameter of approximately 5 mm and a flat in time profile of approximately 3 ns. The 351 nm laser propagates through a
$\lambda$
 /4 grating[
Reference Bonod, Branceau, Daurios, Grosjean, Roquin, Gleyze, Lamaignère and Néauport
7
] in order to rotate its polarization from linear to circular. For linear propagation, we keep the waveplate but rotate it so that the polarization is kept linear. This is the case when the incident polarization is aligned with one of the plate’s principal axes. Then, the laser beam is focused to the tested optics (shown with the green color in Figure 1) thanks to the L1 lens characterized with a 3245 mm focal length. The 34 mm thick fused silica sample is localized in front of the focal point in order to reduce the laser beam inhomogeneities strongly marked into a focused laser beam. Because the lens focal length is much larger than the sample thickness, we can assume that the MELBA laser beam is collimated.
Imaging part of the MELBA setup.

Figure 1 Long description
A schematic diagram of an optical experiment.
* Laser Source and Conversion: At the bottom-left, a red beam labeled 1 omega (1053 nm) travels upward through two crystals labeled L B O I (2 omega) and L B O I I (3 omega), changing color to green then purple.
* Main Beam Path: The purple beam hits dichroic mirrors at the top-left and turns 90 degrees to travel horizontally to the right. It passes through a lambda/4 grating and a focal lens L sub 1 with a focal length of 3245 mm.
* Interaction Zone: The beam passes through a sampling plate and hits the tested optics, which are tilted at an 8 degree angle. A microscope icon is positioned near this interaction point.
* Diagnostic Paths: A reflection from the sampling plate is directed to a C C D Camera. A second reflection from the tested optics passes through an obstruction plate and is directed through a series of mirrors and lenses labeled L sub 2 and L sub 3 (both 3245 mm) in a zig-zag pattern, ending at a second C C D Camera at the bottom-left.
* Geometric Inset: A dashed box at the bottom-right illustrates the focal arrangement of lenses L sub 1, L sub 2, and L sub 3. It shows the beam converging and diverging with distances marked as f, 2f, and f between the optical elements and the final sensor.
The spatial distribution of the laser beam fluence is captured with a charge-coupled device (CCD) camera on two near-field planes equivalent to the front and rear surfaces of the sample, respectively (Figure 1). Spatial resolution for the fluence measurement is equal to 6.45
$\mu \mathrm{m}$
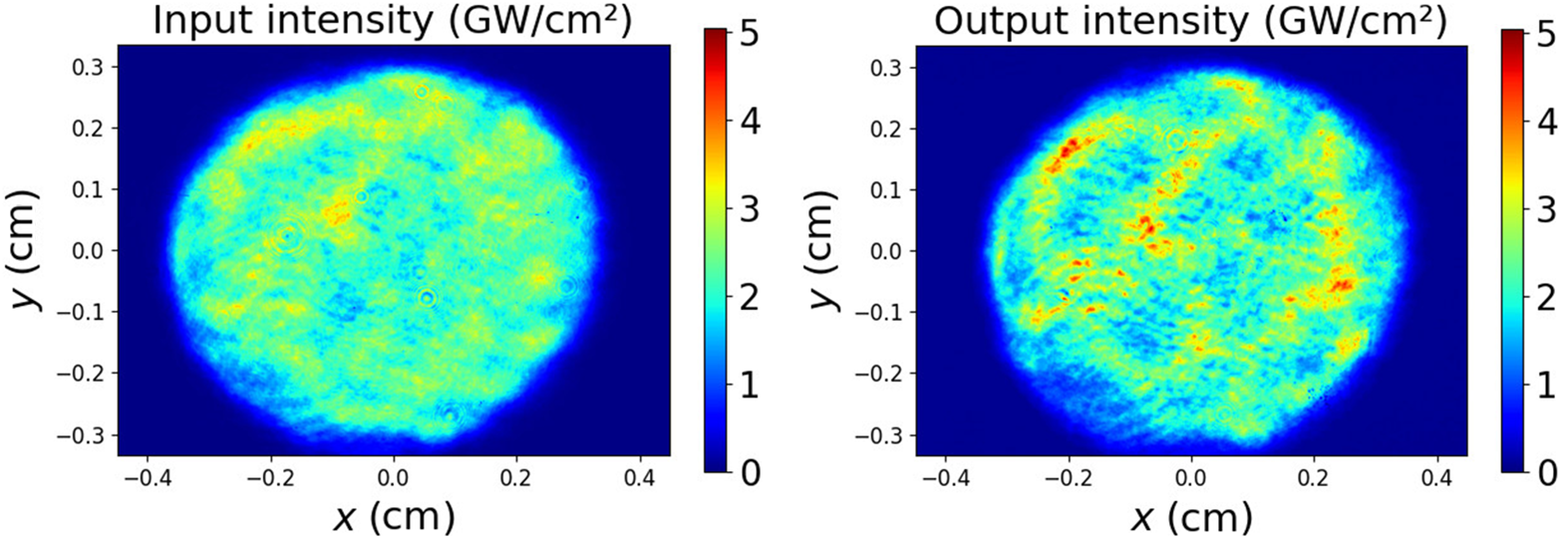
 . The laser fluence is thus measured at the entrance and at the exit of the fused silica sample. Because the temporal dispersion is weak for nanosecond pulse duration, we assume that the temporal shape is kept unchanged during the beam propagation. Figure 2 shows the spatial distribution of the laser intensity at these two locations: the front surface and rear surface of the optical sample. It corresponds to the same laser shot. The comparison of the right- and left-hand panels of Figure 2 shows that the laser beam propagation in the nonlinear material makes some hot spots (red stains) appear in the beam spatial shape. These hot spots are called filamentary structures, and originate from the beam spatial shape structuring Kerr effect.
Spatial distribution of the laser intensity at the entrance (left) and the exit (right) of a 34 mm thick fused silica sample. These two images correspond to the same laser shot.

Figure 2 Long description
The plot uses a Cartesian coordinate system where the x-axis and y-axis both represent distance in cm, ranging from minus 0.4 to 0.4 and minus 0.3 to 0.3 respectively. A vertical color bar on the right indicates intensity levels from 0 to 5 G W per cm squared, with dark blue representing 0 and dark red representing 5. The laser beam profile is roughly circular, centered at coordinate (0, 0). At the core of the beam, the intensity is heterogeneous, primarily consisting of cyan and yellow hues indicating values between 2 and 3.5 G W per cm squared. Several small, localized hot spots in orange appear near the center. Moving toward the perimeter, the intensity transitions through light blue to a dark blue background, indicating a drop to zero intensity outside the beam diameter of approximately 0.6 cm.
We use the theory developed by Garnier[ Reference Garnier 10 ] to analyze these filamentary structures. He proposed a statistical approach to solve the nonlinear Schrödinger equation:

where
$E$
 is the electric field of the laser beam,
${k}_0={n}_0\frac{2\pi }{\lambda_0}$
 is the laser wavenumber in the material and
$\gamma ={k}_0\frac{n_2}{n_0}$
 with
${n}_0$
 and
${n}_2$
 the linear and nonlinear parts of the refractive index, respectively. Here,
${\lambda}_0$
 is the laser wavelength. The nonlinear Kerr process, modeled with the
$\gamma {\left|E\left(\vec{r},z\right)\right|}^2E\left(\vec{r},z\right)$
 term, is responsible for the apparition of filamentary structures in the laser beam profile.
In this theory, the electric field of an initially noisy laser beam is written as follows:

where
${I}_0$
 is the averaged laser intensity and
$q\left(\vec{r},z=0\right)$
 is a complex number modeling the amplitude and phase modulations of the laser beam at the entrance of the thick fused silica sample (
$z=0$
 ). By defining the Fourier transform with

where
${q}_\mathrm{R}\left(\vec{r},z\right)$
 and
${q}_\mathrm{I}\left(\vec{r},z\right)$
 are the real and imaginary parts of the
$q\left(\vec{r},z\right)$
 modulations, respectively, Garnier[
Reference Garnier
10
] showed that the z-evolution of the amplitude and phase modulations verifies the following:


where the linear growth, equal to
$g\left(\vec{k}\right)=\frac{\mid \vec{k}\mid }{2{k}_0}\sqrt{2{k}_{\mathrm{c}}-{\left|\vec{k}\right|}^2}$
 , reaches its maximum value at
${k}_{\mathrm{c}}=\sqrt{2\gamma {k}_0{I}_0}$
 . The power spectral density (PSD) is proportional to the averaged square modulus of the Fourier components[
Reference Garnier
10
]:

where
$<>$
 denotes the statistical average.
By considering Equations (4) and (5), we obtain the PSD at any z-distance as a function of the amplitude and phase modulations known at
$z=0$
 :

where
${\Gamma}_{q_\mathrm{R},{q}_\mathrm{I}}\left(\vec{k},z\right)=<{\hat{q}}_\mathrm{R}\left(\vec{k},z\right){\hat{q}}_\mathrm{I}^{\ast}\left(\vec{k},z\right)>$
 and
$\operatorname{Re}(x)$
 is the real part function. We do not have diagnostics to measure the initial phase modulations
${\Gamma}_{q_\mathrm{I}}\left(\vec{k},z=0\right)$
 . So, we follow the same method as that presented in Ref. [Reference Bouyer, Nuter, Cormier, Gleyze, Grosjean, Roquin, Natoli and Lamaignère11], and consider that the initial phase modulation is proportional to the initial amplitude modulation. We thus write
${\hat{q}}_\mathrm{I}\left(\vec{k},z=0\right)=\alpha \cdot {\hat{q}}_\mathrm{R}\left(\vec{k},z=0\right)$
 . The present experimental setup slightly differs from that used in Ref. [Reference Bouyer, Nuter, Cormier, Gleyze, Grosjean, Roquin, Natoli and Lamaignère11]: a
$\lambda /4$
 waveplate[
Reference Bonod, Branceau, Daurios, Grosjean, Roquin, Gleyze, Lamaignère and Néauport
7
] is added to transform the laser beam polarization from linear to circular. Because both linearly and circularly polarized laser beams propagate within this optical component, we assume that the initial phase and amplitude modulations do not vary with the beam polarization.
We aim to analyze our experimental measurements with this analytical expression of the PSD. We assume a cylindrical symmetry such that

where
$k$
 is the modulus of the spatial fluctuations wavenumber
$\vec{k}$
 . The nonlinear gain of the amplitude modulation is written as follows:

where
$g(k)=\frac{k}{2{k}_0}\sqrt{2{k}_{\mathrm{c}}-{k}^2}$
 . For
$k={k}_{\mathrm{c}}$
 , we obtain the following:

where
$L$
 is the fused silica sample thickness and
${\lambda}_0$
 is the laser wavelength.
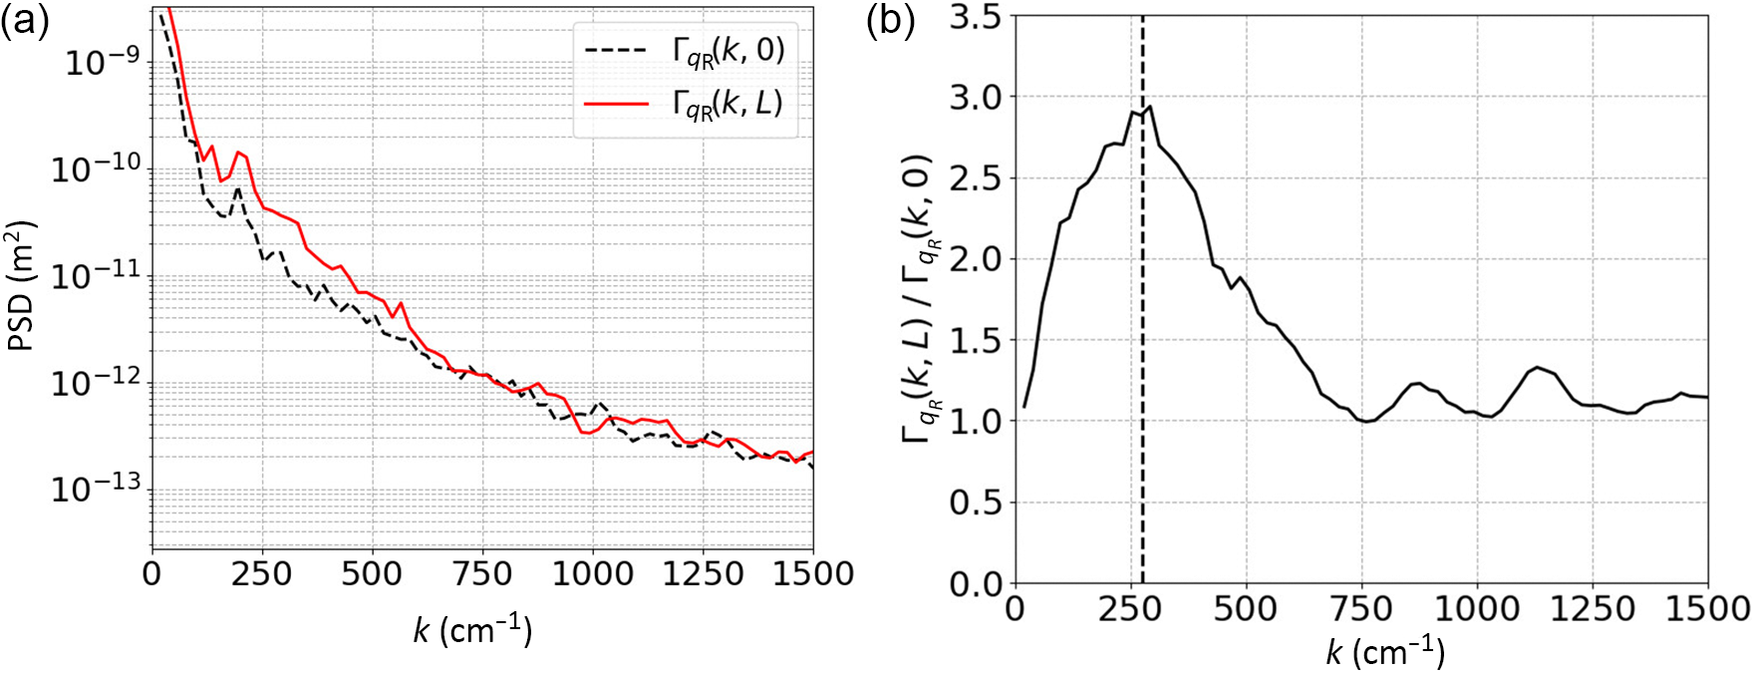
Figure 3(a) draws the measured PSD, associated with Figure 2, in the input (black dashed curve) and output (red solid curve) of a 34 mm thick fused silica sample. We observe a PSD increased in the 100–600 cm
${}^{-1}$
 k-range by the nonlinear Kerr process. The associated Figure 3(b) draws the PSD nonlinear gain equal to the ratio of the output PSD over the input PSD (Equation (9)). This nonlinear gain reaches its maximum value near
$k={k}_{\mathrm{c}}$
 (labeled with the vertical dashed line);
${k}_{\mathrm{c}}$
 corresponds to the wavenumber for which the linear gain (
$g(k)$
 ) is maximal.
(a) Measured power spectral density of the laser beam in the input (black curve) and output (red curve) of the component. (b) Measured nonlinear gain of the laser beam propagating within a 34 mm thick fused silica sample. The vertical dashed line indicates the k
${}_{\mathrm{c}}$
 value.

Figure 3 Long description
Panel a is a semi-logarithmic line graph. The horizontal X-axis represents k in units of inverse centimeters, ranging from 0 to 1500. The vertical Y-axis represents P S D in meters-squared, ranging from 10 super minus 13 to 10 super minus 9 on a log scale. Two lines are plotted. A dashed black line representing Gamma sub q R (k, 0) and a solid red line representing Gamma sub q R (k, L). Both lines show a steep exponential decay from k equals 0 to k equals 250, followed by a more gradual linear decrease on the log scale. The red line remains consistently higher than the black line until approximately k equals 750, where they begin to overlap and fluctuate together.
Panel b is a linear line graph. The horizontal X-axis is identical to panel a. The vertical Y-axis represents the ratio Gamma sub q R (k, L) all over Gamma sub q R (k, 0), ranging from 0.0 to 3.5. A single solid black line starts at a ratio of approximately 1.1 at k equals 0, rises to a peak of nearly 3.0 at k equals 250, and then decays toward a value of 1.0 as k increases toward 1500. A vertical dashed line is positioned at k equals 250 to mark the peak of the curve.
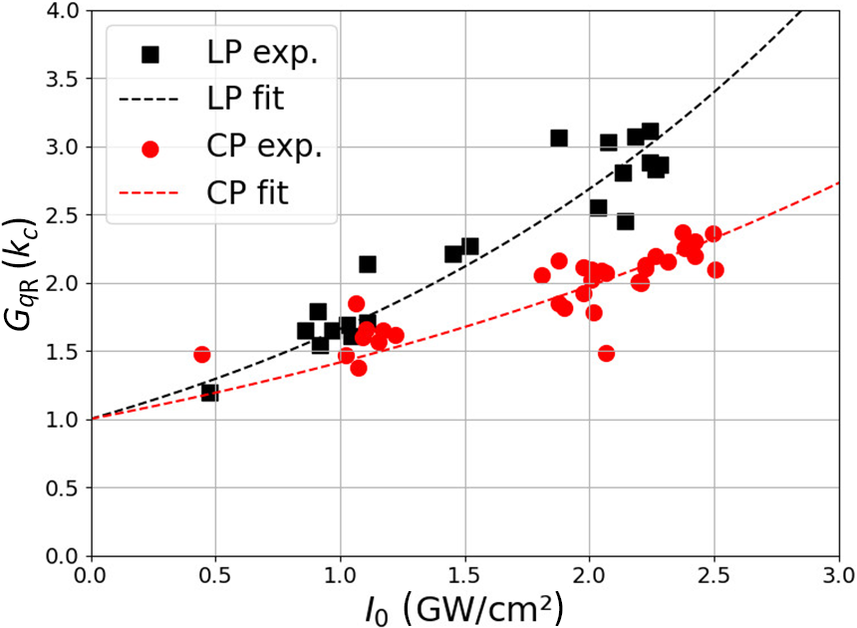
Then, we repeat these nonlinear gain measurements by varying the input laser intensity. Note that the initial spatial shape of the laser beam is kept constant. Figure 4 displays these values obtained for
$k={k}_{\mathrm{c}}$
 with linearly (black square) and circularly (red circle) polarized laser beams. A linearly polarized laser beam displays a larger nonlinear gain value than a circularly polarized one, as is expected with the nonlinear refractive index values.
Nonlinear gain,
${G}_{q_\mathrm{R}}\left({k}_{\mathrm{c}}\right)$
 , versus the laser intensity for linear (LP, black) and circular (CP, red) laser beam polarization, experimentally measured (symbols) and numerically fitted (dashed curves).

Figure 4 Long description
A line graph on a grid background. The horizontal X-axis is labeled I sub 0 (G W forward slash cm super 2) with a scale from 0.0 to 3.0. The vertical Y-axis is labeled G sub q R (k sub c) with a scale from 0.0 to 4.0.
A legend in the top-left quadrant identifies four data series:
* Black square: L P exp.
* Black dashed line: L P fit
* Red circle: C P exp.
* Red dashed line: C P fit
Data Trends:
* The L P exp. data points (black squares) show a non-linear increase, starting near (0.5, 1.2) and rising to approximately (2.3, 3.1). The L P fit line follows an upward parabolic curve starting at 1.0 on the Y-axis and reaching 4.0 at the far right of the X-axis.
* The C P exp. data points (red circles) follow a similar but lower trajectory, starting near (0.4, 1.5) and rising to approximately (2.5, 2.3). The C P fit line is a shallower upward curve, also starting at 1.0 on the Y-axis but only reaching approximately 2.7 at the far right of the X-axis.
* Both datasets show a positive correlation between intensity and the G sub q R value, with L P values consistently higher than C P values as intensity increases beyond 1.0 G W forward slash cm super 2.
We use Equation (10) to interpolate the nonlinear gain values presented in Figure 4 for a linearly polarized laser beam. As the product
$\frac{2\pi L}{\lambda_0}{n}_2{I}_0=\beta {I}_0$
 is not large and the range of intensity values is quite small, we can show that Equation (10) is written in the dominant order:
${\left(1+\alpha \beta {I}_0\right)}^2$
 . As there is a coupling of parameters with the product
$\alpha \beta$
 , we proceed with alternatively fixing one parameter. The interpolation, performed with
${n}_2^{\mathrm{lin}}=3.6\times {10}^{-20}$
 m
${}^2$
 /W[
Reference Milam
12
], enables us to extract the
$\alpha$
 value equal to the ratio of amplitude modulations over phase modulations of the laser beam for the linear case. Then, by considering that this
$\alpha$
 ratio is kept constant for a circularly polarized beam, we interpolate the associated nonlinear gain values to extract the
${n}_2^{\mathrm{cir}}$
 value. We obtain a
$\frac{n_2^{\mathrm{cir}}}{n_2^{\mathrm{lin}}}$
 ratio equal to 0.68 that is close to the theoretical value equal to 0.66[
Reference Weber, Milan and Smiths
13
,
Reference Schimpf, Eidam, Seise, Hädrich, Limpert and Tünnermann
14
].
We reproduce this process to extract the
${n}_2^{\mathrm{cir}}$
 values for a laser beam having different initial amplitude modulations. These initial amplitude modulations are characterized with a standard deviation
$\sigma (z)$
 computed with the following:

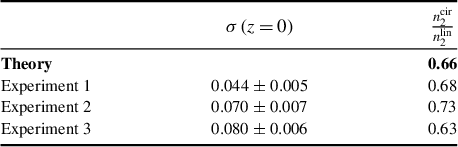
Table 1 compares the experimental
${n}_2^{\mathrm{cir}}/{n}_2^{\mathrm{lin}}$
 values for different initial laser beam amplitude modulations (
$\sigma \left(z=0\right)$
 ) to the theoretical one
${\left.{n}_2^{\mathrm{cir}}/{n}_2^{\mathrm{lin}}\right|}_{\mathrm{th}}=2/3$
 [
Reference Weber, Milan and Smiths
13
,
Reference Schimpf, Eidam, Seise, Hädrich, Limpert and Tünnermann
14
]. We observe an excellent agreement between the measured and theoretical
${n}_2^{\mathrm{cir}}/{n}_2^{\mathrm{lin}}$
 values, the averaged experimental value being equal to 0.68 ± 0.02. These experimental measurements highlight the ability of circular polarization to mitigate the nonlinear Kerr process.
Ratio of the nonlinear refractive index for circular laser beam polarization over that for linear beam polarization for different amplitude modulated laser beams characterized with a different standard deviation
$\sigma \left(z=0\right)$
 .

Table 1 Long description
The table consists of three columns and four data rows.
Column headers:
1. The first column is unlabeled and contains the source of the data.
2. The second column is labeled sigma open parenthesis z equals 0 close parenthesis.
3. The third column is labeled n sub 2 super cir all over n sub 2 super lin.
Data rows:
- Theory: The second column is empty. The third column value is 0.66.
- Experiment 1: The second column value is 0.044 plus or minus 0.005. The third column value is 0.68.
- Experiment 2: The second column value is 0.070 plus or minus 0.007. The third column value is 0.73.
- Experiment 3: The second column value is 0.080 plus or minus 0.006. The third column value is 0.63.
3 Initiation of laser-induced damage on the rear surface of a fused silica sample
In the previous section, we measured the nonlinear gain accumulated by the laser beam during its propagation within a 34 mm thick fused silica sample. When this nonlinear gain is large, it could make the laser fluence higher than the damage threshold fluence of the optical component. In this section, we study how the laser beam polarization influences laser-induced damage initiated on the sample rear surface. In our previous work[ Reference Nuter, Kandy, Gallais, Grosjean, Lamaignère, Wagner and Natoli 9 ], we experimentally and theoretically showed that the density of laser damage generated on the sample front surface by a UV laser beam does not vary with the laser polarization. This originates from the photo-ionization theory computing a similar ionization rate for linear and circular beam polarizations in the UV regime[ Reference Nuter 8 , Reference Otobe, Shinohara, Sato and Yabana 15 ]. This present work is focused on the laser-induced damage initiated on the rear surface of a fused silica sample, irradiated with a UV nanosecond laser beam. It thus presents the laser polarization impact on two of the laser damage processes, which are the Kerr effect, already highlighted in the previous section, and the ionization processes studied in Ref. [Reference Nuter, Kandy, Gallais, Grosjean, Lamaignère, Wagner and Natoli9]. Two spatial shapes for the UV laser beam are considered: a small Gaussian beam for which its nonlinear propagation results in a self-focusing spatial shape[ Reference Marburger 16 ], and a large and noisy top hat laser beam for which nonlinear propagation results in a large number of filamentary structures[ Reference Bespalov and Talanov 17 ]. For the laser-induced damage measurements, we have considered uncoated magnetorheological finishing (MRF) polished fused silica samples provided by the ZYGO company. Note that all our damage measurements are obtained without any filamentary formation presence.
3.1 Gaussian laser beam
Nonlinear propagation of a Gaussian laser beam is well modeled with the Marburger self-focusing theory[ Reference Marburger 16 ]. When an intense laser beam propagates within a dense media, it experiences a self-focusing process originating from the Kerr effect[ Reference Boyd 5 ]. It results in an intensity increase of the laser beam, which could exceed the laser-induced damage threshold intensity. Thus, a laser beam with an input fluence lower than the damage threshold could deteriorate the fused silica sample rear surface under the Kerr effect. We thus look at the influence of the laser polarization on these propagative processes.
Damage density measurements were performed with a Q-switched neodymium-doped yttrium aluminum garnet (Nd:YAG) single longitudinal mode laser, lasing at 1064 nm. The laser wavelength was converted to 355 nm by considering potassium dihydrogen phosphate (KDP)/potassium dideuterium phosphate (DKDP) crystals. The laser beam irradiates fused silica samples with a Gaussian temporal shape characterized with a full width at half maximum (FWHM) equal to 7 ns ± 0.5 ns, and a Gaussian spatial shape with a 1/e diameter equal to 445
$\mu \mathrm{m}$
 . As we use a lens with a long focal length (8 m), the depth of field of the beam is around 1 m, so we consider the beam as collimated through the fused silica samples. The circular polarization is obtained by inserting a quarter waveplate in the laser beam propagation. Two sample thicknesses were considered: 10 and 34 mm. The laser-induced damage measurement has been performed using a one-on-one procedure. Damage sites are detected thanks to a He-Ne probe laser.
3.1.1 A 10 mm thin target
Firstly, we measure the damage density of a thin fused silica sample (10 mm thick) irradiated with a Gaussian laser beam. We evaluate the damage probability (
$P(F)$
 ) as the ratio between the number of damage sites observed on the sample rear surface and the number of laser shots. The measured damage density,
${\delta}_{\mathrm{m}}$
 (F), is computed with the following formula:

where
${S}_{\mathrm{g}}$
 is the 1/e surface of the Gaussian laser beam in the focal plane[
Reference Bouyer, Courchinoux, Donval, Roquin and Lamaignère
18
]. This quantity,
${\delta}_{\mathrm{m}}$
 (F), does not model the real fluence-dependent damage density, as the measurements are performed with a Gaussian laser beam that is spatially heterogeneous. The damage density is computed with
$D(F)={\delta}_{\mathrm{m}}(F)\cdot \beta$
 , where
$\beta$
 is extracted by fitting the measured damage density,
${\delta}_{\mathrm{m}}(F)$
 , with a power law
${\delta}_{\mathrm{m}}(F)=\eta {F}^{\beta }$
 [
Reference Bouyer, Courchinoux, Donval, Roquin and Lamaignère
18
].
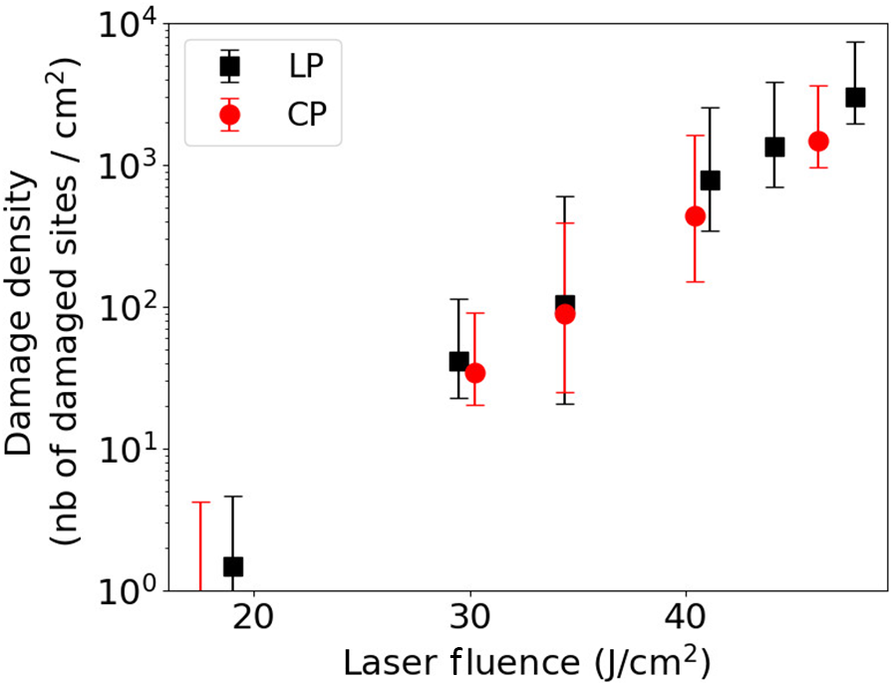
Figure 5 illustrates the damage density as a function of the laser beam fluence for linearly (black square) and circularly (red circle) polarized laser beams. No difference in damage density is observable between the two laser beam polarizations. These polarization-independent damage densities are similar to those measured on the front surface of the fused silica sample in Ref. [Reference Nuter, Kandy, Gallais, Grosjean, Lamaignère, Wagner and Natoli9], which were performed in a Kerr-free experimental setup. Thus, for this laser intensity range (lower than 5 GW/cm
${}^2$
 ) and this target thickness, the Kerr effect is negligible and does not contribute to damage to optical components.
Laser-induced damage density on a 10 mm fused silica sample rear surface as a function of the laser fluence for linear (LP, black square) and circular (CP, red circle) beam polarizations. The laser fluence is measured on the front surface sample. The laser beam spatial shape is Gaussian.

Figure 5 Long description
A scatter plot on a semi-logarithmic scale.
Axes:
* The horizontal X-axis is labeled Laser fluence in Joules per centimeter-squared (J / cm super 2), with linear increments from 20 to 40.
* The vertical Y-axis is labeled Damage density (nb of damaged sites / cm super 2) on a logarithmic scale ranging from 10 super 0 to 10 super 4.
Legend:
* Black squares represent L P.
* Red circles represent C P.
Data Trends:
* Both L P and C P datasets show a positive exponential correlation between laser fluence and damage density.
* At approximately 18 J / cm super 2, damage density is near 10 super 0.
* By 30 J / cm super 2, values for both datasets rise to approximately 4 times 10 super 1.
* At the highest measured fluence near 48 J / cm super 2, the L P damage density reaches approximately 3 times 10 super 3.
* Vertical error bars are present for all data points, indicating increasing absolute variance at higher fluence levels.
3.1.2 A 34 mm thick target
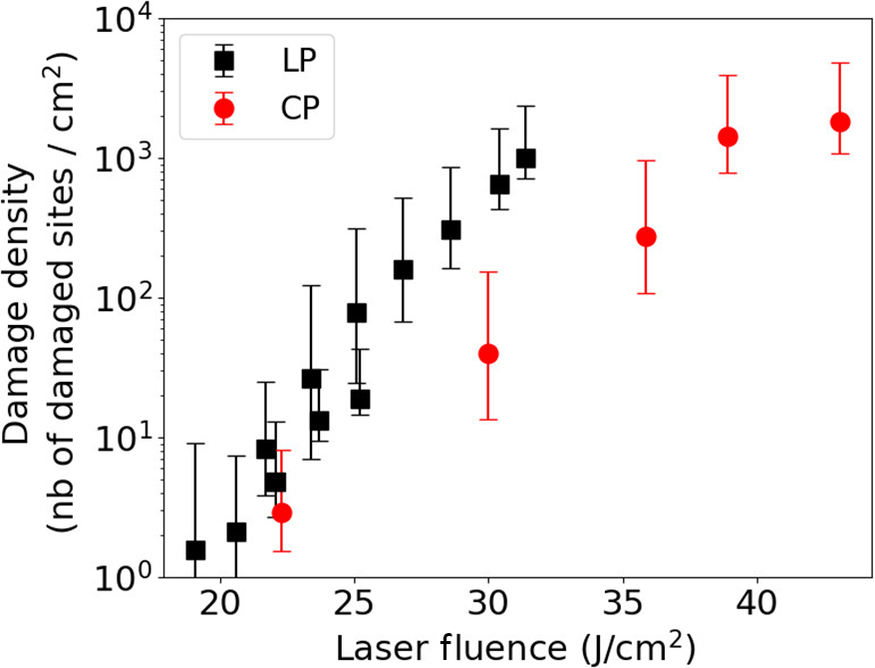
We now consider a thicker optical component: the sample thickness is increased from 10 to 34 mm. Because the Kerr-induced nonlinear gain depends on the component thickness (Equation (9)), we expect an impact of the laser polarization on damage density due to the nonlinear gain. Figure 6 displays the damage density as a function of the laser beam fluence for linearly (black square) and circularly (red circle) polarized laser beams.
Laser-induced damage density on a 34 mm fused silica sample rear surface as a function of the laser fluence for linear (LP, black square) and circular (CP, red circle) laser beam polarizations. The laser fluence is measured on the front surface sample. The laser beam spatial shape is Gaussian.

Figure 6 Long description
The X-axis represents Laser fluence in Joules per centimeter-squared (J / cm super 2), ranging from 20 to 45. The Y-axis represents Damage density (nb of damaged sites / cm super 2) on a logarithmic scale from 10 super 0 to 10 super 4.
Two data series are plotted with error bars:
* L P (Linear Polarization): Represented by black squares. This series shows a steep, nearly linear increase on the log scale, starting at approximately 1.5 at 19 J / cm super 2 and rising to 10 super 3 at 32 J / cm super 2.
* C P (Circular Polarization): Represented by red circles. This series follows a similar upward trend but is shifted to the right, indicating a higher threshold for damage. It starts at approximately 3 at 22.5 J / cm super 2, reaches 40 at 30 J / cm super 2, and levels off near 2 times 10 super 3 at 43 J / cm super 2.
The L P data points are more densely clustered at lower fluence levels (20 to 25 J / cm super 2) compared to the C P data points.
We observe that linear beam polarization produces a higher damage density than circular polarization. For a 30 J/cm
${}^2$
 laser fluence, the difference between the two damage density values reaches more than one order of magnitude. Because no difference was observed with a thinner sample, we affirm that this difference originates from the Kerr self-focusing process.
3.2 Spatially modulated laser beam
Noisy top hat laser beams model the beam spatial shape of high-energy laser facilities (NIF, LMJ). Their nonlinear propagation within dense media is usually described with the Bespalov–Talanov theory[
Reference Garnier
10
,
Reference Feigenbaum, DiNicola and Bude
19
]. The Kerr effect does not result in a self-focused laser beam, but rather in the creation of filamentary structures as already observed in Figure 2. We use the MELBA laser, presented in Section 2, to measure the damage densities generated on a fused silica sample rear surface. Thus, in addition to the CCD cameras used to measure the laser beam fluence, a macroscope located in front of the target captures the damage sites. Damage detection has a resolution of 6.45
$\mu \mathrm{m}$
 , which is the same as the fluence measurement resolution. Each damage site is attributed to its local fluence. By sorting the number of damage sites to different fluence bins, and knowing the fluence histogram for all tested sites, we can determine the damage density. This method is described in detail in Refs. [Reference Bouyer, Nuter, Cormier, Gleyze, Grosjean, Roquin, Natoli and Lamaignère11,Reference Bouyer, Parreault, Roquin, Natoli and Lamaignère20].
3.2.1 A 10 mm thin target
The MELBA laser irradiates a 10 mm fused silica sample in a collimated considered configuration. The laser pulse duration is 3 ns with a flat in time profile. For such a thin target, the Kerr effect is negligible when the laser beam is spatially Gaussian (Figure 5). Figure 7 displays the damage density as a function of the laser fluence for linearly (black squares) and circularly (red circles) polarized laser beams.
Laser-induced damage density on the 10 mm fused silica sample rear surface as a function of the laser fluence for linear (LP, black square) and circular (CP, red circle) laser beam polarizations. The laser fluence is measured on the front surface sample. The laser exhibits a noisy top hat spatial shape.

Figure 7 Long description
A line graph with a logarithmic y-axis and linear x-axis. The x-axis is labeled Laser Fluence in Joules per centimeter-squared J forward slash cm super 2, ranging from approximately 15 to 50. The y-axis is labeled Damage density nb of damaged sites forward slash cm super 2, with a logarithmic scale from 10 super 0 to 10 super 4.
At the top left, a legend identifies two data series:
* L P represented by black squares with black error bars.
* C P represented by red circles with red error bars.
Data trends:
* Both series show a steep exponential increase in damage density as laser fluence increases.
* At the lowest measured fluence near 18 J forward slash cm super 2, damage density is near 10 super 0.
* By 30 J forward slash cm super 2, density rises to approximately 4 times 10 super 1.
* At the highest measured fluence near 48 J forward slash cm super 2, the L P data reaches approximately 3 times 10 super 3.
* The L P black squares generally sit slightly higher than the C P red circles at equivalent fluence levels, though error bars for both series overlap significantly across the entire range.
We observe no difference in the damage density between the two beam polarizations. This is in agreement with the experimental measurements performed on the sample front surface[ Reference Nuter, Kandy, Gallais, Grosjean, Lamaignère, Wagner and Natoli 9 ] and with a Gaussian laser beam (Section 3.1.1). These experimental results confirm that Kerr effect is negligible for this laser intensity range and target thickness couple.
3.2.2 A 34 mm thick target
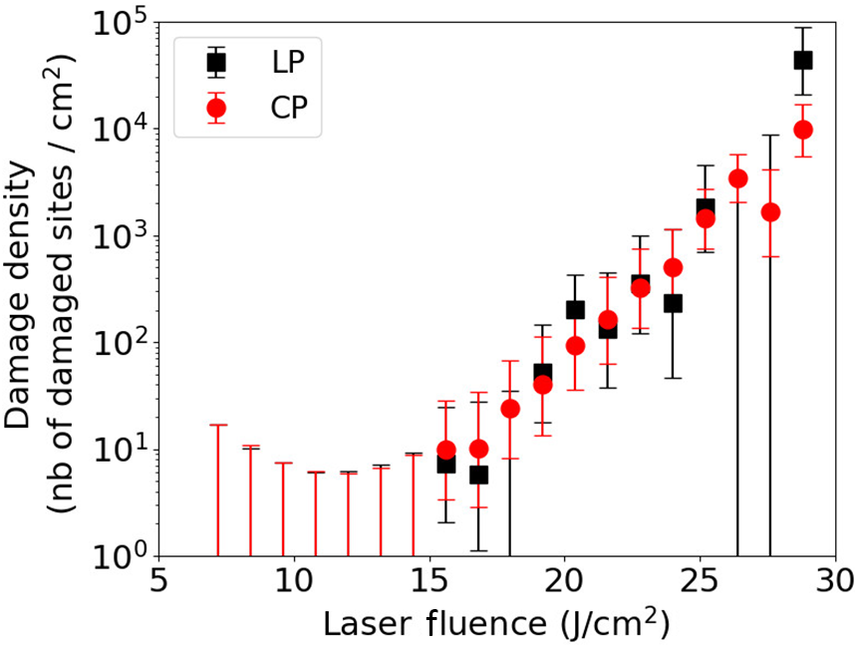
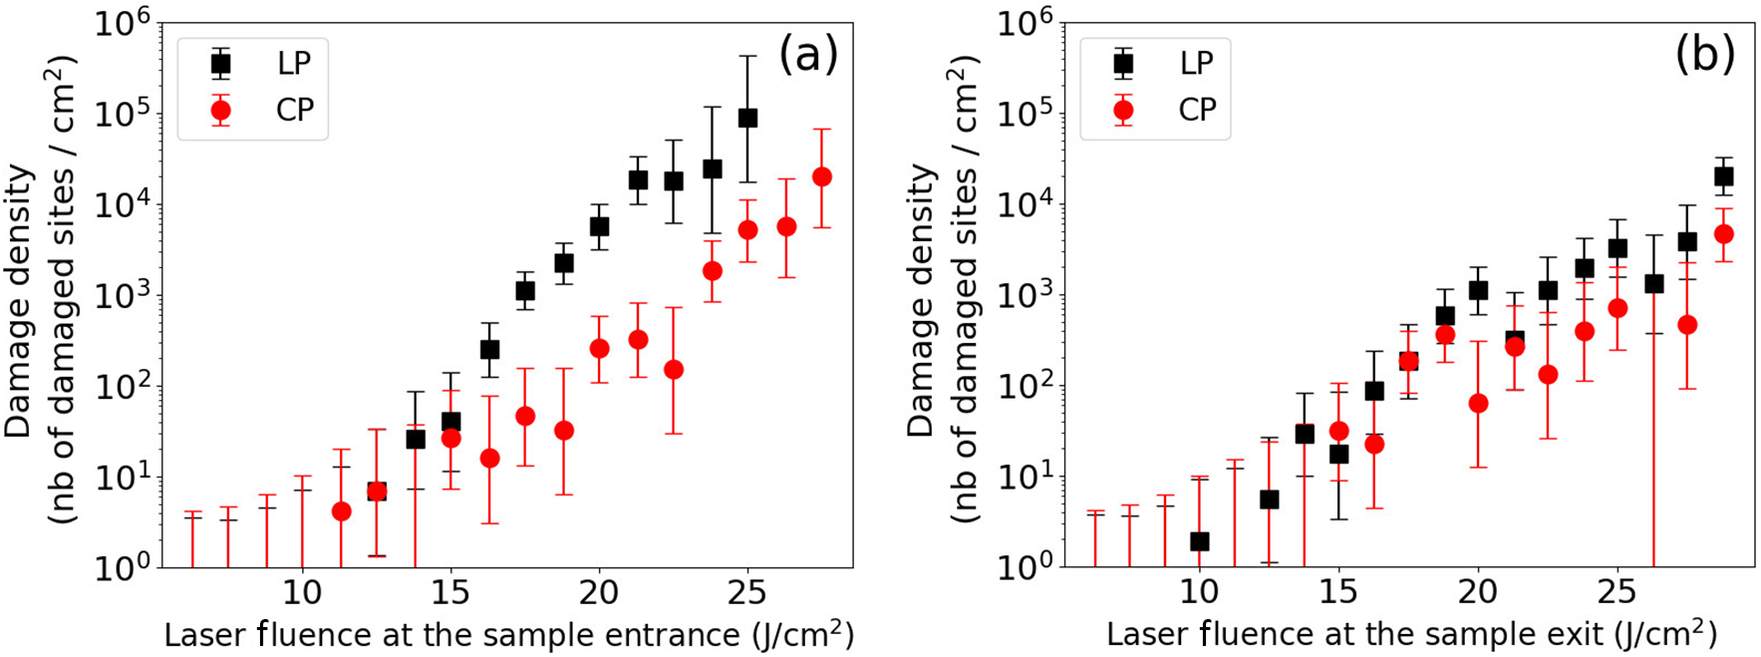
Then, the MELBA laser beam irradiates a 34 mm fused silica sample in a collimated considered configuration. As presented in Figure 1, we correlate the laser-induced damage sites observed on the sample rear surface with the laser fluence measured at the entrance of the sample (Figure 8(a)) and at the exit of the sample (Figure 8(b)).
Laser-induced damage density on the 34 mm fused silica sample rear surface as a function of the laser fluence for linear (LP, black square) and circular (CP, red circle) laser beam polarizations. The laser fluence is measured at the sample front surface (a) and at the sample rear surface (b). The laser exhibits a noisy top hat spatial shape.

Figure 8 Long description
A line graph with a logarithmic y-axis and linear x-axis. The x-axis is labeled Laser Fluence in J forward slash c m squared, ranging from 20 to 45. The y-axis is labeled Damage density (n b of damaged sites forward slash c m squared), ranging from 10 super 0 to 10 super 4.
There are two data series with error bars:
* L P (Linear Polarization) represented by black squares. This series starts at approximately 20 J forward slash c m squared with a density of 10 super 0 and shows a steep exponential increase, reaching nearly 10 super 3 by 32 J forward slash c m squared.
* C P (Circular Polarization) represented by red circles. This series starts at a higher fluence of approximately 22 J forward slash c m squared. It follows a similar upward trend but is shifted to the right, requiring higher fluence to achieve the same damage density as L P. For example, at 30 J forward slash c m squared, C P is near 10 super 1.5, while L P is already near 10 super 3. The C P series continues up to 43 J forward slash c m squared, reaching a density just above 10 super 3.
A legend in the top left corner identifies the black square as L P and the red circle as C P.
Figure 8(a) exhibits the sample rear surface damage density as a function of the laser fluence measured at the sample entrance. It shows that for a laser fluence higher than 16 J/cm
${}^2$
 , a linearly polarized laser beam produces a higher damage density than a circularly polarized one. The damage density difference reaches two orders of magnitude for a laser fluence close to 22 J/cm
${}^2$
 . Because the laser-induced damage sites are observed on the sample rear surface, we already know that they result from the combined actions of the Kerr effect, which increases the laser fluence during the laser beam propagation within the fused silica sample, and the electron plasma generated by the photo-ionization process.
In order to discriminate the action of nonlinear propagation of the laser beam from the action of the ionization processes, we draw in Figure 8(b) the same rear surface damage density as a function of the laser fluence measured at the sample exit, that is, at the location where damage appears. In this configuration, we observe that linearly and circularly polarized laser beams provide a similar level of damage density on the rear surface of the sample. This differs from the previous figure where two orders of magnitude were observed between the damage density produced with a linear and a circular laser beam for a fluence equal to 22 J/cm
${}^2$
 . At this fluence, almost no difference is observed in the damage density between the two polarizations in Figure 8(b), as already observed with a thin target. A very weak difference seems to be present. We attribute it to the difficulty to measure the laser fluence on the rear surface with a 4f setup system. The comparison between these experimental measurements, shown in Figures 8(a) and 8(b), clearly highlights the role played by the Kerr effect in the laser propagation. The intensity increase induced by the Kerr effect is more important for a linear beam polarization than for a circular one because of the higher value of the nonlinear refractive index.
4 Growth of the laser-induced damage
The previous sections have shown the influence of the laser polarization on the nonlinear gain and on the laser-induced damage initiation. We now look at the laser-induced damage growth that measures the damage diameter increased by successive laser beam irradiation. These experimental measurements have been performed with a 10 mm thin sample such that they are not impacted by the Kerr effect. The growth of laser-induced damage is described with the formula modeling the diameter of the damage after N laser shots:

where
${D}_0$
 is the damage initial diameter and
$\alpha$
 is the growth coefficient[
Reference Manes, Spaeth, Adams, Bowers, Bude, Carr, Conder, Cross, Demos, Nicola, Dixit, Feigenbaum, Finucane, Guss, Henesian, Honig, Kalantar, Kegelmeyer, Liao, MacGowan, Matthews, MacCandless, Mehta, Miller, Negres, Norton, Nostrand, Orth, Sacks, Shaw, Siegel, Stolz, Suratwala, Trenholme, Wegner, Whitman, Widmayer and Yang
4
].
To characterize the damage growth, it is first necessary to generate a matrix containing 30 laser-induced damage sites for which the diameter varies from 20 to 150
$\mu \mathrm{m}$
 . The spacing between each site is equal to 600
$\mu \mathrm{m}$
 in order that the damage growth of one site does not disturb the neighboring ones. The damage sites are initiated with four laser shots by using a phase mask[
Reference Grosjean, Cormier, Gleyze, Hallo, Lacombe, Roquin, Natoli and Lamaignére
21
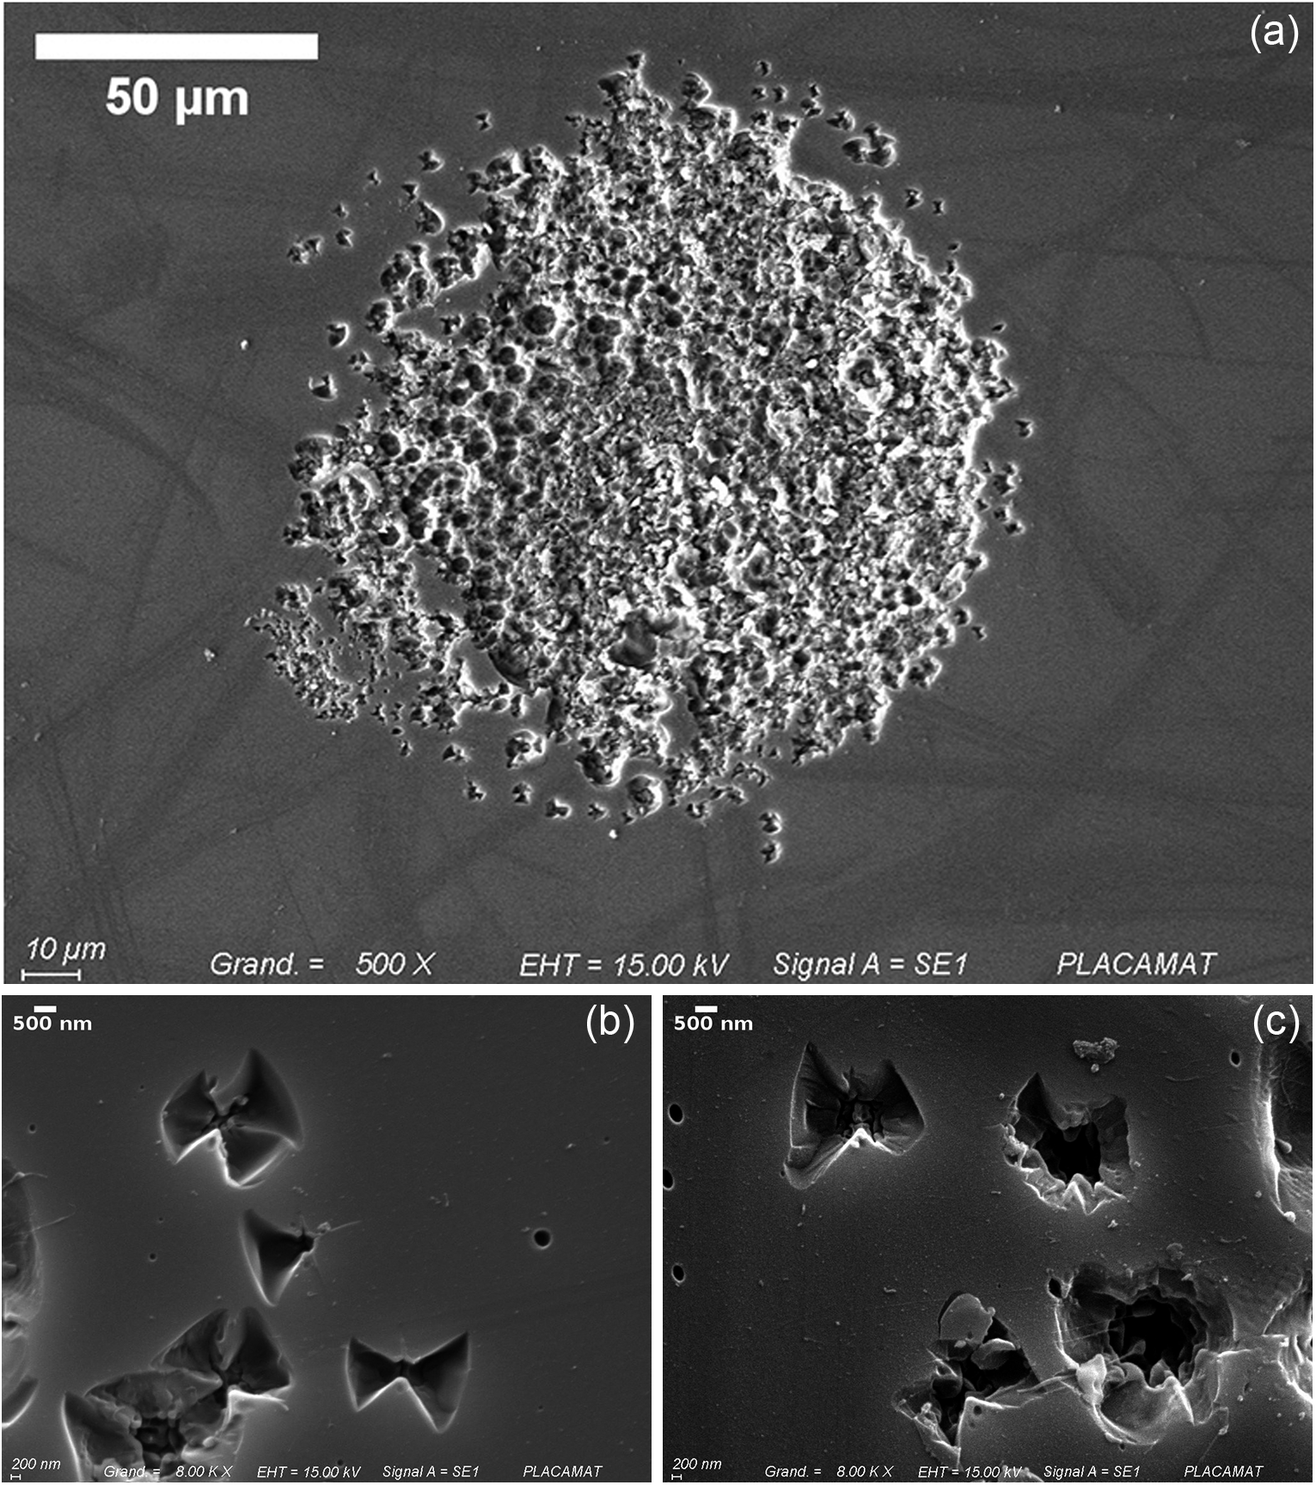
]. For this study, we have generated the damage site matrix by alternatively considering linear and circular laser beam polarizations. We have characterized the diameter of each damage site and have observed no impact of the laser beam polarization on the morphology and on the diameter of the damage. Figure 9 shows laser-induced damage sites captured with a scanning electron microscope. The morphology of damage sites and their density do not vary with the laser polarization.
(a) Photograph of a typical damage site used for damage growth study, generated here with linear polarization. Scanning electron microscope images of laser-induced damage sites generated with circularly (b) and linearly (c) polarized laser beams. Damage sites correspond to the first laser shot before damage growth, with fluence of more than 20 J/cm.

Figure 9 Long description
A scatter plot on a semi-logarithmic scale. The horizontal X-axis represents Laser Fluence in Joules per centimeter-squared, ranging from 5 to 30. The vertical Y-axis represents Damage density, defined as the number of damaged sites per centimeter-squared, ranging from 10 super 0 to 10 super 5.
A legend in the top-left quadrant identifies two data series:
- L P (Linear Polarization) represented by black squares.
- C P (Circular Polarization) represented by red circles.
Data trends:
- From 5 to 15 Joules per centimeter-squared, damage density remains low and relatively flat, near 10 super 1, with large vertical error bars extending toward the baseline.
- Starting at approximately 15 Joules per centimeter-squared, both series show a steep exponential increase.
- Between 15 and 25 Joules per centimeter-squared, the L P and C P data points are closely interleaved, following a similar upward trajectory.
- Above 25 Joules per centimeter-squared, the L P values (black squares) appear to rise more sharply than the C P values (red circles), reaching nearly 10 super 5 at a fluence of 29 Joules per centimeter-squared, while C P reaches approximately 10 super 4.
Then, we illuminated the damage matrix with successive laser shots in order to characterize the damage growth. After each laser shot, we measured the local laser fluence as shown by damage and its diameter in order to determine the damage size growth with Equation (13). Each site is irradiated by 200–300 laser shots. The number of laser shots varies with the site, because we stopped the site irradiation when the damage size was too large and could modify the neighboring environment. This is performed by using a spatial light modulator to locally set the laser beam fluence to zero[ Reference Grosjean, Cormier, Gleyze, Hallo, Lacombe, Roquin, Natoli and Lamaignére 21 ].
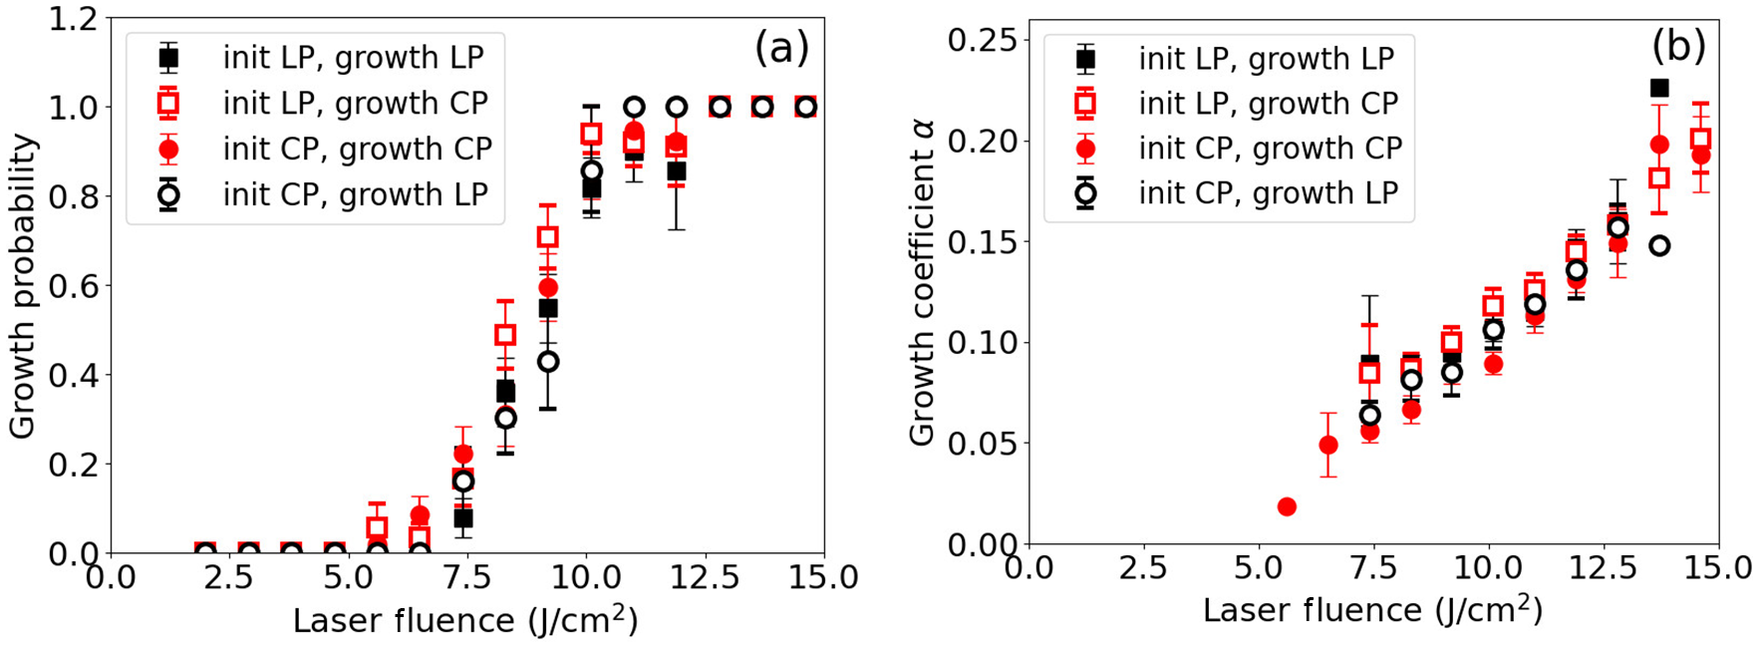
To study the influence of the laser beam polarization on the damage growth, we have considered four experimental configurations where the damage matrix is generated with linear or circular laser beam polarization (‘init LP’ and ‘init CP’), and the damage growth is performed with linear or circular polarization (‘growth LP’ and ‘growth CP’). For each experimental configuration, we have performed 10 growth sequences.
The averaged experimental measurements are presented in Figure 10. Figure 10(a) displays the growth probability as a function of the laser fluence for different configurations depending on the laser polarization chosen to initiate or to grow the laser damage site. We do not observe any difference among these four configurations. The growth probability follows a similar trend whatever laser beam polarization is chosen for the damage initiation and the damage growth. The associated growth coefficient (
$\alpha$
 ) is plotted in Figure 10(b). No difference is observed among these four configurations, demonstrating that laser polarization has no influence on the laser-induced damage growth. The latter is only driven by the laser fluence.
Growth probability (a) and growth coefficient (b) for four experimental setups: initiation and growth with linearly polarized laser beams (black square), initiation and growth with circularly polarized laser beams (red circle), initiation with a linearly polarized laser beam and growth with a circularly polarized laser beam (empty square) and initiation with a circularly polarized laser beam and growth with a linearly polarized laser beam (empty circle).

Figure 10 Long description
A two-panel scatter plot with logarithmic y-axes.
Common Axes: The x-axis represents Laser Fluence at the sample entrance in Joules per centimeter-squared, ranging from 5 to 30.
Panel a: The y-axis is Damage density (number of damaged sites per centimeter-squared) ranging from 10 super 0 to 10 super 6.
- Black squares (L P) show a steep exponential increase starting at 15 Joules per centimeter-squared, reaching nearly 10 super 5 at 25 Joules per centimeter-squared.
- Red circles (C P) follow a similar but lower trajectory, reaching approximately 10 super 4 at 27 Joules per centimeter-squared.
Panel b: The y-axis is Growth probability ranging from 0.0 to 1.0.
- Black squares (initiation and growth with L P) and empty circles (initiation with C P, growth with L P) show a rapid increase in growth probability, reaching 1.0 near 20 Joules per centimeter-squared.
- Red circles (initiation and growth with C P) and empty squares (initiation with L P, growth with C P) show a much slower increase, only reaching a probability of 0.4 at 25 Joules per centimeter-squared.
All data points include vertical error bars indicating measurement uncertainty.
5 Multifilamentation
Whereas no filamentary structure occurred in our previous laser-induced damage measurements, we now present our study about the filament formation into a thick fused silica sample. Our aim is to determine the threshold intensity triggering the beam filamentation in both laser polarization configurations. For this study, we have irradiated a 34 mm thick fused silica sample with the MELBA laser. From a practical point of view, we have chosen laser fluence such that only a few filaments form in the bulk of each site. We have used a LEICA M420 macroscope to detect and characterize filaments in the sample volume. We have observed that each filament ends with a damage site on the sample rear surface. We have determined the transverse position of the filament, and we have measured on the front fused silica sample the associated local laser fluence. We assume that the flat in time MELBA profile does not change during the laser propagation within the sample, such that we compute the laser intensity by dividing the measured laser fluence with the 3 ns pulse duration.
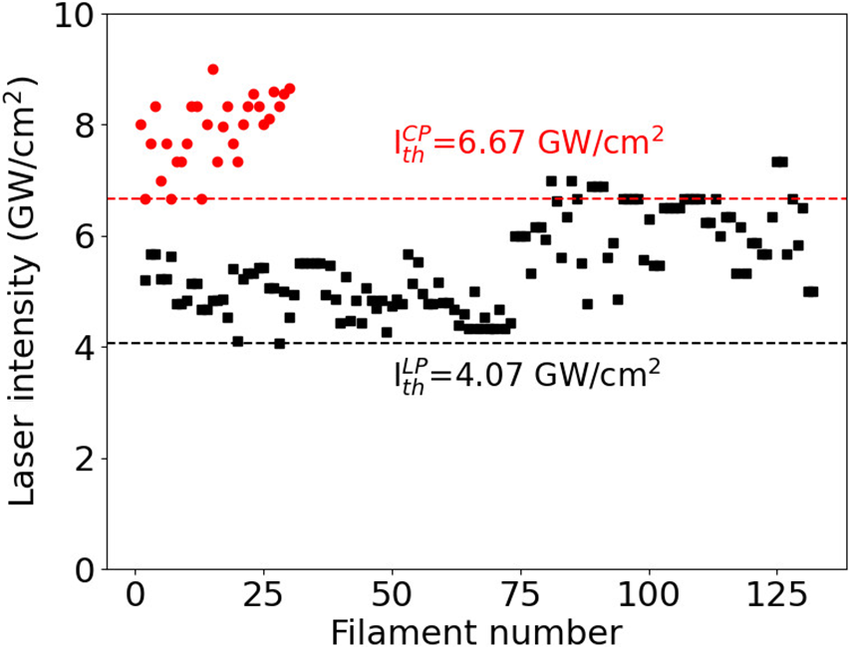
Figure 11 displays the laser intensity measured on the sample front surface associated with each observed filament for linear polarization (black square) and circular polarization (red circle). The filamentation threshold intensity is associated with the minimum value of the laser intensity: it varies with the laser polarization. For circular beam polarization, our measurements result in
${I}_{\mathrm{th}}^{\mathrm{CP}}=6.67$
 GW/cm2, whereas our measurements for a linear beam polarization provide
${I}_{\mathrm{th}}^{\mathrm{LP}}=4.07$
 GW/cm2. These results clearly show that the filamentation threshold is higher for a circular polarization than for a linear one. The filamentation threshold laser intensity ratio is equal to
$\frac{I_{\mathrm{th}}^{\mathrm{LP}}}{I_{\mathrm{th}}^{\mathrm{CP}}}$
 = 0.61.
Laser intensity associated with the filament generation for linear (LP, black square) and circular (CP, red circle) laser beam polarization. The dashed lines draw the minimum values of laser intensity triggering the filament generation.

Figure 11 Long description
A line graph labeled b in the top right corner. The horizontal X axis is titled Laser Fluence at the sample exit in Joules per centimeter-squared, with a linear scale from 10 to 25. The vertical Y axis is titled Damage density (nb of damaged sites forward slash centimeter-squared) with a logarithmic scale ranging from 10 super 0 to 10 super 6.
A legend in the top left identifies two data series. L P (linear polarization) is represented by black squares. C P (circular polarization) is represented by red circles. Both series include vertical error bars.
Data trends.
- Both L P and C P show a positive exponential correlation where damage density increases as laser fluence increases.
- The L P data points consistently sit higher than the C P data points across the entire range of fluence.
- At 10 Joules per centimeter-squared, L P starts near 10 super 0. By 25 Joules per centimeter-squared, L P reaches approximately 10 super 4, while C P is lower, near 10 super 3.
- The error bars for C P are generally larger than those for L P, particularly at higher fluence levels.
To analyze these measurements, we consider the analytical development performed by Feigenbaum et al. [ Reference Feigenbaum, DiNicola and Bude 19 ]. They have considered a perturbative method to solve the nonlinear Schrödinger equation, and to determine the nonlinear gain. They provide an analytical expression for the longitudinal position at which the filament is generated:

where
${I}_0$
 is the averaged input laser intensity at the sample entrance,
${I}_{\mathrm{fil}}$
 is the local laser intensity generating a filament,
$a$
 is the amplitude of the beam modulation and
$g(f)$
 is the nonlinear gain that depends on the material and laser beam parameters[
Reference Feigenbaum, DiNicola and Bude
19
]. We look for the minimum values of input laser intensity triggering filamentation in the sample volume. We thus consider the maximum nonlinear gain equal to
${g}_{\mathrm{max}}=\frac{2\pi {n}_2{I}_0}{\lambda_0}$
 . Thus, we write the following:

We want to determine the averaged input laser intensities
${I}_{0, \mathrm{th}}^{\mathrm{LP}}$
 and
${I}_{0, \mathrm{th}}^{\mathrm{CP}}$
 that lead to the same
$\frac{2\pi {L}_{\mathrm{fil}}}{\lambda_0}$
 values for linear and circular beam polarizations. As previously mentioned, we assume that the amplitude modulation of the laser beam does not vary with the laser polarization. We also know that the UV laser damage threshold in fused silica does not vary with the laser polarization[
Reference Nuter
8
], such that we assume that the filamentation intensity
${I}_{\mathrm{fil}}$
 is similar for both laser polarizations. By equalizing Equation (15) for linear and circular polarizations, we obtain the following:


We assume that the laser intensity locally triggering the filament formation is much higher than the input laser intensity (
${I}_{\mathrm{fil}}>>{I}_0$
 ) such that the second term in the third line of Equation (16) could be neglected. We thus obtain the following:

We obtain an excellent agreement between this theoretical value for the filamentation threshold and the measured one, presented in Figure 11, and equal to 0.61.
6 Conclusion
We measured the damage density generated on the rear surface of a fused silica sample irradiated with a UV nanosecond laser beam for which laser polarization varies from linear to circular. We have observed that for laser fluence in the some tens of J/cm2 region, typical of high-energy laser systems, and for target thickness equal to 10 mm, there is no difference in the damage density between the linear and circular polarization. The nonlinear propagation of the laser beam is insignificant, and laser-induced damage is only triggered by the photo-ionization processes. These measurements confirm that in the UV regime, the photo-ionization process in the fused silica sample does not vary with the laser polarization. However, for thicker targets (34 mm), we observe that damage density is much more important for linear beam polarization than for circular beam polarization. This results from the Kerr effect, which depends on the laser polarization, and for which the nonlinear refractive index is 3/2 higher for linear than for circular polarization. These measurements obtained with a small Gaussian beam and a large and noisy top hat laser beam confirm that polarization dependent damage density originates only from the Kerr effect, and that the photo-ionization process in a fused silica sample with a UV laser beam is independent of the laser polarization.
By considering a thick fused silica sample, we have carefully measured and analyzed the nonlinear gain acquired by the laser beam during its propagation. These measurements have shown a higher nonlinear gain for a linearly polarized laser beam than for a circularly polarized one. A detailed analysis of these measurements with the statistical approach highlights the difference in the nonlinear refractive index between circular and linear beam polarizations, and enables one to retrieve the theoretical ratio.
Then, we have presented measurements of the beam filamentation with both laser beam polarizations. We have correlated the filament generated in a 34 mm thick fused silica sample with the associated laser fluence measured at the entrance of the sample. We have observed that the filamentation threshold laser intensity ratio between linear and circular polarizations converges to the nonlinear refractive index ratio between linear and circular polarizations.
Finally, we have mixed linear and circular polarizations to look at the damage diameter growth, and have observed that the damage growth factor does not depend on laser polarization.
Laser damage mitigation induced by UV circular laser beam polarization only originates from the nonlinear refractive index decrease. There is no dependance of the photo-ionization rate on the laser beam polarization.




 Open access

