


Introduction
Glaciers, one of the notable components of the cryosphere, are recognized as the best terrestrial indicator of climatic variations, especially in high and remote mountain regions where no permanent climate stations exist, due to their particular sensitivity to climate changes and the clear visibility of glacier growth and shrinkage (Reference BevingtonBarry, 2006). In view of today’s rapid climate changes, incorporating the high thermal sensitivity of Earth’s mountain glaciers, detailed, repeated and up-to-date information on any glacierized region in the world is of growing interest (Reference Kääb, Paul, Maisch, Hoelzle and HaeberliKääb and others, 2002). Repeated glacier inventory work at time intervals comparable to characteristic dynamic response times of mountain glaciers (a few decades) helps in analyzing and assessing changes at a regional scale (e.g. Reference Haeberli, Cihlar and BarryHaeberli and others, 2000; Reference Kääb, Paul, Maisch, Hoelzle and HaeberliKääb and others, 2002). Multi-temporal satellite imagery and aerial photography play an important role for such glacier inventory and monitoring. For instance, the Landsat Thematic Mapper (TM)/Enhanced Thematic Mapper Plus (ETM+) sensors have proven to be a particularly efficient tool for mapping glacier extent and monitoring changes even for small alpine glaciers (e.g. Reference Kääb, Paul, Maisch, Hoelzle and HaeberliKääb and others, 2002; Reference PaulPaul and others, 2002). The Global Land Ice Measurements from Space (GLIMS) project was established with the goal of monitoring the world’s glacier changes using satellite imagery (Reference KargelKargel and others, 2005).
Glaciers in the Karlik Shan, eastern Tien Shan, are of considerable interest for several reasons. The glaciers play an important role in catching and condensing vapour from local and other regions, and in the mountainous precipitation increase. At local scales, glacier runoff constitutes a vital water source for agriculture irrigation and domestic or animal consumption. Melting of glaciers has an important impact on the lowland desertification and hydrology of mountain-fed rivers. There is also concern about glacier-related hazards, such as glacier lake outburst floods and mudflows in the upper valleys. A first Chinese glacier inventory (CGI) for the region was compiled based on topographic maps and 1971/72 aerial photographs, which are available in the GLIMS glacier database (Reference WangWang and others, 1986). The inventory includes some valuable information on glacier parameters such as glacier area, length, maximum and minimum elevations, equilibrium-line altitude (ELA), and orientations of the ablation and accumulation zones. However, much less is known about glacier changes in this region during recent decades. Accordingly, our objective is to provide an updated inventory of the glacier extent in the Karlik Shan, another key region of the Tien Shan, and to compare this new inventory with the previous inventory to quantify glacier changes. CGI, Landsat TM/ETM+ and Advanced Spaceborne Thermal Emission and Reflection Radiometer (ASTER) images were used to obtain the glacier distribution map in this region.
*Present address: School of Geographic and Oceanographic Sciences, Nanjing University, Nanjing 210093, China.
Study Area
Located in the far eastern part of the Tien Shan of Xinjiang, China, the Karlik Shan (42°50'–43°35'N, 93°41'–95°07'E) are surrounded by the vast barren sands of the Gobi Desert, where the Asia dust storms originate (Fig. 1). The mountain range extends from northwest to southeast. The highest peak is Tomort (43°04'24" N, 94°20'48" E) with an altitude 4886ma.s.l. It has an important function as water storage and water supply for the animal husbandry and irrigation of farmland in the extremely arid surroundings.
(a) Location map of the Karlik Shan with a false-color composite of bands 5, 4, 3 (as red, green, blue) of the Landsat ETM+ scene and extent of study area. (b) The topographic map extent and glaciers in the ETM+ image. The glaciers indicated by ellipses could not be identified in the ETM+ image and were determined from the 2002 ASTER image. (c) Sub-areas of the Karlik Shan and the outlines of glaciers from the CGI.
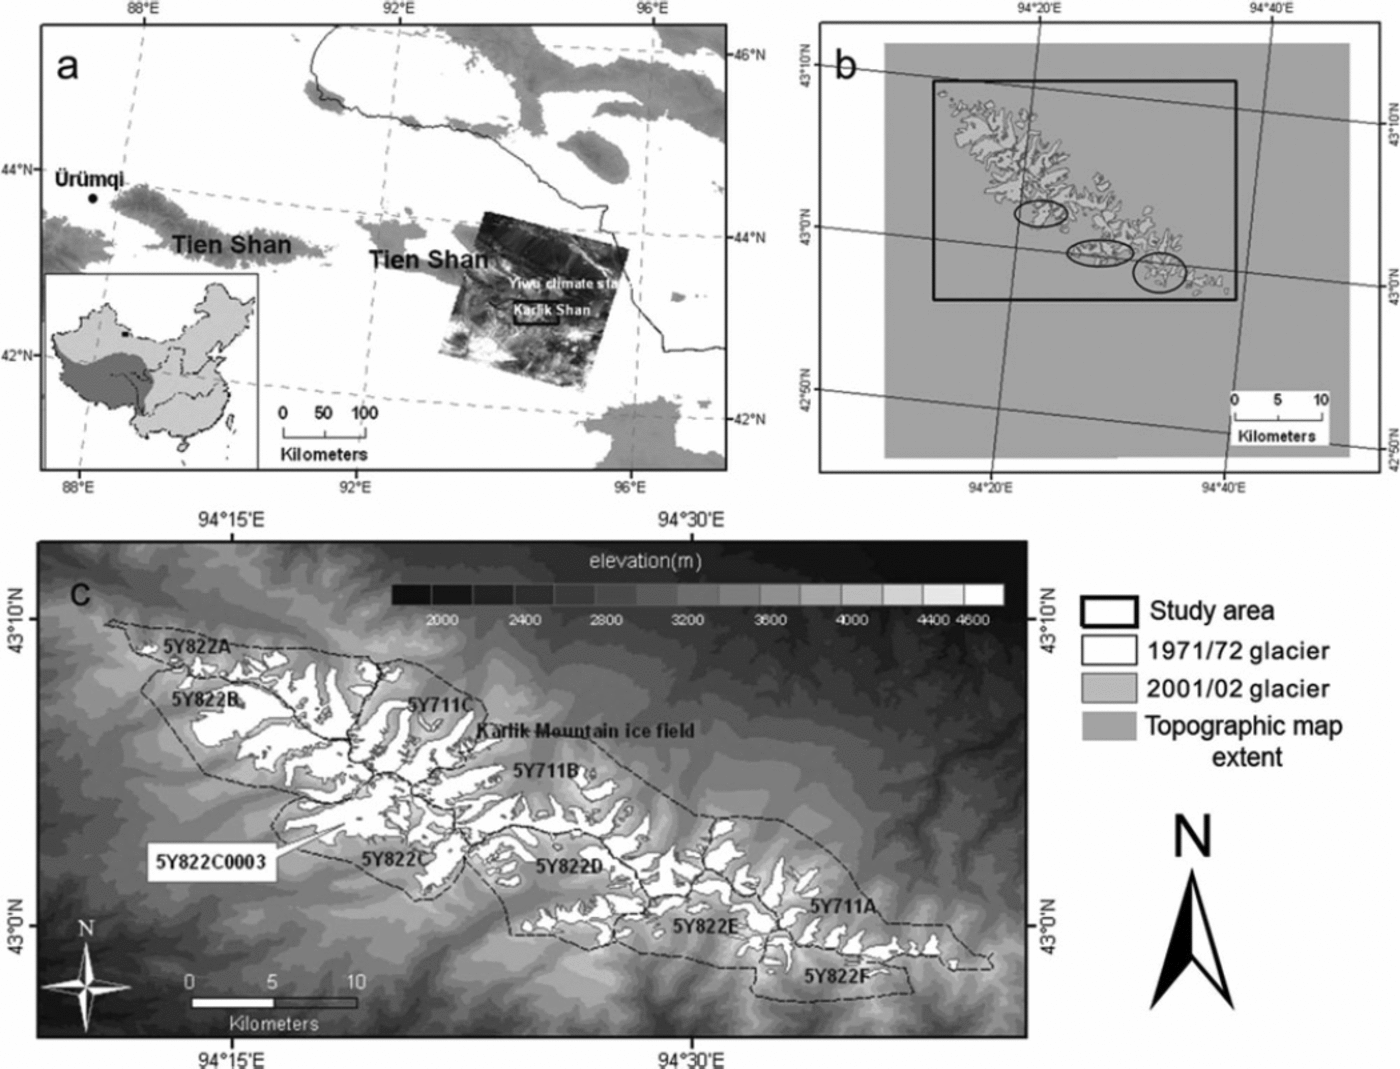
The mean annual air temperature is approximately –9°C at 600 hPa. Annual precipitation is <200mm and can reach 400–500mm at altitudes of >4000ma.s.l. About 70–80% of annual precipitation occurs in the summer (May–September). In August 2005 an ice core was drilled at the summit (4518ma.s.l.) of the flat-top Miaoergou glacier (5Y822C0003), showing that the borehole temperature was about –7°C at 10m depth and –8.3°C at the borehole bottom, and the mean annual accumulation rate was approximately 200mm w.e. (Reference Liu, Hou, Ren, Wang and GenLiu and others, 2006; Reference Li, Wang, Zhu and LiLi and others, 2007).
The CGI, based largely on 1971/72 aerial photography and topographic maps, recorded 122 glaciers in the Karlik Shan with an average mean glacier altitude of about 4119m and associated average maximum and minimum elevations of 4417m and 3843 m, respectively. It is important to note that the mean elevation here is area-weighted, representing the ‘elevation of the contour line that divides the surface area of the glacier into two equal parts’. Of the total number, 73 of the glaciers are situated on the northern slopes and 49 on the southern slopes. The ELA is situated about 3970–4050ma.s.l. More than 65% of the glaciers are <1 km2 and the longest/largest glacier is Hanatabudi glacier (5Y822C0002) which is about 6.5 km long and 6.59 km2 in area. Glaciers in the region are of the following types: valley, flat-top, hanging, cirque and cirque–hanging. Hanging and cirque–hanging type glaciers are dominant.
Data and Methods
Remotely sensed data used in this study are shown in Table 1. The CGI was compiled from topographic maps (1 : 50 000 scale) and snow-free aerial photographs taken in 1971/72. Several high-resolution satellite images have been used for mapping glacier extent in the study region, including Landsat TM (path 138, row 30, 15 August 1992) and ETM+ (path 138, row 30, 17 September 2001). The scenes have no clouds and little seasonal snow. It should be noted that we cannot identify some glacier outlines of the east Karlik (Fig. 1b) in the ETM+ image due to seasonal snow cover. The extent of these glaciers can be clearly derived from the ASTER visible imagery (20 October 2002) with free cloud and low snow.
Remotely sensed data used in this study

Notes: SRTM: Shuttle Radar Topography Mision; GLCF: Global Land Cover Facility; GLIMS: Global Land Ice Measurements from Space; USGS: US Geological Survey.
In high-mountain topography, exact orthorectification of satellite data requires a high-resolution digital elevation model (DEM) of appropriate accuracy for collection of ground control points (GCPs) (Reference OerlemansPaul, 2003). The Shuttle Radar Topography Mission (SRTM) DEM, which is available from the US Geological Survey (USGS), was extremely valuable as it can also be used as a source of GCPs (Reference KääbKääb, 2005). The DEM is generated from the records of the C-band antenna (wavelength 5.6 cm) flown on the space shuttle on 11–22 February 2000. The linear vertical absolute height error is <16m for 90% of the data (Reference Paul, Kääb and HaeberliRabus and others, 2003). The DEM has few holes in the study region due to the specific method of terrain elevation data acquisition by means of interferometric radar remote sensing (Reference Möller, Schneider and KilianMöller and others, 2007). The raw SRTM DEM was contoured with intervals of 10m and re-interpolated within ArcInfo TOPOGRID. The voids were filled by the interpolated values (maintaining the original DEM values where data were available in the raw image) (Reference Jarvis, Rubiano, Nelson, Farrow and MulliganJarvis and others, 2004).
We used the SRTM DEM for orthorectification of the TM, ETM+ and ASTER images. The accuracy of orthorectification is within one image pixel. The orthoimages were geometrically rectified and georeferenced using 15–20 GCPs identified in the corresponding topographic maps and satellite images, evenly distributed around the Karlik Shan. The obtained horizontal root-mean-square error (RMSE) of the set of control points for the different images ranged between 11.5 and 23.5m and was considered precise enough for our purposes.
The glacier outlines of the CGI were interpreted from aerial photographs by stereophotogrammetry and were transferred to 1 : 50 000 scale topographic maps (Reference WangWang and others, 1986). However, the data only existed as analogue maps and tables. To enable a direct comparison and the quantification of changes, it was necessary to digitize the CGI. All glacier boundaries were digitized from the scanned maps and compared with the tabulated values.
The extent of each glacier from the satellite images was manually digitized using a false-color composite image of TM/ETM+ bands 5, 4, 3 (red, green, blue), which show clouds in white, glaciers (i.e. snow and ice) in blue–green, lakes in blue, bare rock in pink–purple and vegetation in yellow–green, as recommended by Reference Paul, Kääb, Maisch, Kellenberger and HaeberliPaul and others (2003, Reference Paul, Huggel and Kääb2007). A similar method was applied to ASTER data, using bands 3, 2, 1. Although semi-automated techniques to map glacier outlines have been developed recently (e.g. Reference PaulPaul and others, 2002, Reference Paul, Huggel, Kääb, Kellenberger and Maisch2004), manual on-screen digitizing can be more accurate but less time-efficient, especially where only small numbers of glaciers are being studied, as in this case (Reference Stokes, Popovnin, Aleynikov, Gurney and ShahgedanovaStokes and others, 2007). There may be misinterpretation resulting from seasonal snow cover, debris cover and glacier–lake contacts. Lakes were readily identifiable on the satellite imagery because their spectral signature is in marked contrast to the glacier ice or debris cover that surrounds them. The distinct linear and dendritic pattern associated with slopes and valley floors in the high mountains covered with seasonal snow can be distinguished
from glaciers. Debris cover is an issue due to its spectral similarity to the surrounding terrain (Reference PaulPaul and others, 2002). The glaciers in the study region show little debris cover. For the identification of debris-covered parts of the glaciers, the surface shape and roughness of the SRTM DEM as well as aerial photographs from 1971/72 and topographic maps were used.
Accuracy and Error Analysis
There are several uncertainties in the area assessment as our study integrates various data sources at different spatial and temporal resolutions. Sources of uncertainty in this study come from errors embedded in the various data sources used (remote-sensing derived data, topographic maps and aerial photography), glacier delineation algorithms, resolution manipulation and misidentification of ice bodies.
According to the CGI, the uncertainty of glacier area on topographic maps and aerial photography was estimated to be <5% (Reference Williams, Hall and BensonWang and others, 1986). Therefore the total uncertainty of glacier area in 1971/72 on the Karlik Shan can be estimated by the following formula for error propagation (Reference BevingtonBevington, 1969; Reference Jin, Xin, Che, Wu and MoolJin and others, 2005):

where Sn is glacier area and n is the number of glaciers. The whole glacierized area estimate in 1971/72 is ±1km2.
The uncertainty of glacier extent from TM, ETM+ and ASTER images is associated with the spatial resolution of the dataset, errors in imagery registration and the accuracy of glacier position as shown on the map (Reference Williams, Hall and BensonWilliams and others, 1991; Reference Hall, Williams and BayrHall and others, 1992, Reference Hall, Benson and Field1995; Reference Silverio and JaquetSilverio and Jaquet, 2005; Reference Ye, Kang, Chen and WangYe and others, 2006). The terminus change uncertainty U is estimated from (Reference Hall, Bayr, Schöner, Bindschadler and ChienHall and others 2003; Reference Silverio and JaquetSilverio and Jaquet, 2005):

where a and b are the image resolutions of images a and b, respectively, and σ is the error of image registration. According to Reference Hall, Bayr, Schöner, Bindschadler and ChienHall and others (2003) and Reference Ye, Kang, Chen and WangYe and others (2006), the measurement uncertainty of glacier area (U Area) can be obtained by

where U is the terminus uncertainty and V is the image pixel resolution. However, the area uncertainty (<0.0056km2) due to imagery registration and pixel resolution is minimal and can be ignored in the total uncertainty. We estimate the accuracy of the glacier outlines in 1992 and 2001/02 derived from manual digitizing to be one pixel, as cited in most accuracy studies (Reference CongaltonCongalton, 1991; Reference Zhang and GoodchildZhang and Good-child, 2002; Reference Hall, Bayr, Schöner, Bindschadler and ChienHall and others, 2003). The uncertainties of glacier area in 1992 and 2001/02 were determined by calculating the area of a buffer around each glacier having a width equal to twice the digitizing errors (Reference Granshaw and FountainGranshaw and Fountain, 2006; Reference Rabus, Eineder, Roth and BamlerRacoviteanu and others, 2008). The overall errors are 1.1% and 0.6% of the total area, respectively.
Other errors in satellite-imagery data processing result from atmospheric and topographic effects and data smoothing during resampling (Reference Rabus, Eineder, Roth and BamlerRacoviteanu and others, 2008). Atmospheric effects are negligible. Topographic effects are caused by differential solar illumination of the Earth’s surface in the complex terrain of the Karlik Shan. They are minimized using the method of manual interpretation from the orthoimages and DEM.
Results and Discussion
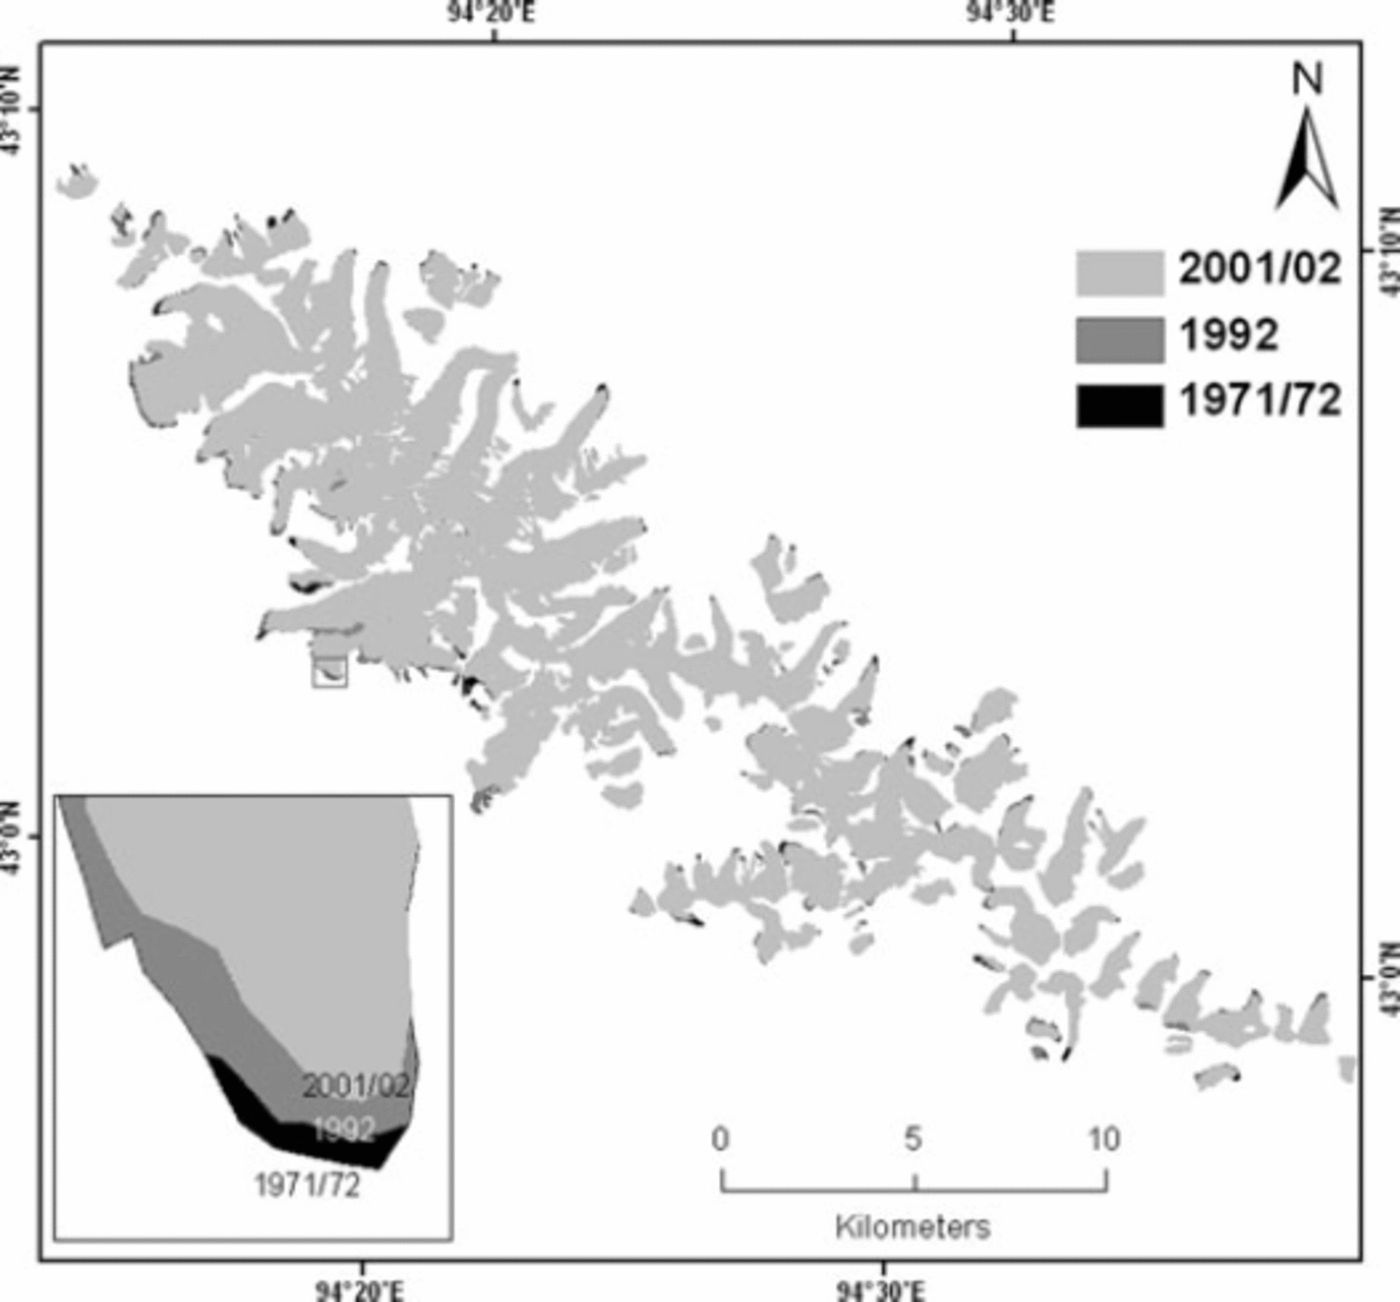
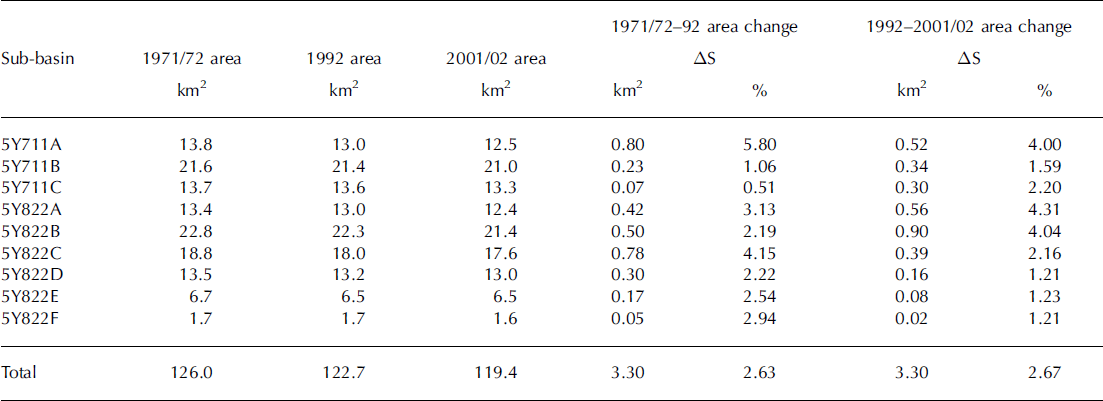
Analysis shows that glaciers in the Karlik Shan study area retreated during the period 1971/72–2001/02 (Table 2; Fig. 2). The glacier area in 1971/72 was 126±1km2. The total glacier area shrunk to 122.7±1.4km2 in 1992, and to 119.4±0.7km2 (94.7% of the 1971/72 total glacier area) by 2001/02 (Table 2). During 1971/72–92, the largest decrease (5.8%) is in the northwestern part of the Karlik Shan (5Y711A). The smallest change (0.5%) occurred in the 5Y711C region. Although the percent of glacier surface loss in some sub-basins (5Y711A, 5Y822C, D and E) during 1992–2001/02 was smaller than during 1971/72–92, the rate of glacier shrinkage is significantly larger since the 1990s. For all the glaciers in the study area, the rate of area shrinkage is 0.13% a –1 during 1971/72–92, while it is 0.27% a–1 during 1992–2001/02, suggesting an accelerated reduction since the 1990s. A survey of the glacier terminus was carried out on the flat-top Miaoergou glacier (5Y822C0003) (Fig. 2, inset). There is no change of glacier terminus from 1973 to 1981(Reference Williams, Hall and BensonWang and others, 1986). The glacier terminus retreated at a rate of about 2.7 ma–1 during 1981–2005. The accelerated retreat in recent years observed in this study is consistent with the finding that glacial retreat amplitude appears to be accelerating since the 1990s in High Mountain Asia (Reference Yao, Wang, Liu, Pu, Shen and LuYao and others, 2004).
Glacier area changes in the Karlik Shan between 1971/72 and 2001/02. Inset: changes in the terminus of glacier 5Y822C0003.
Summary of glacier area change during 1971/72–2001/02
As has been found by other investigators, the smaller the glaciers, the higher the rates of surface loss (Reference Kaser and OsmastonKaser and Osmaston, 2002; Reference PaulPaul and others, 2002; Reference Ye, Ding, Liu and LiuYe and others, 2003; Reference Jin, Xin, Che, Wu and MoolJin and others, 2005; Reference Mark and SeltzerMark and Seltzer, 2005; Reference Chueca, Julián and Lόpez-MorenoChueca and others, 2007). On average, small glaciers (<0.5 km2) lost more of their surface area from 1971/72 to 2001/02 (Fig. 3). This finding highlights the marked sensitivity of small glaciers to changes in climatic factors.
Decrease in area of each class of glacier (categorized by area) in the Karlik Shan during 1971/72–92 (black bars) and during 1971/72–2001/02 (grey bars).

Exposure of the studied glaciers can influence the observed shrinkage trends. This effect was quantified by grouping the values of extent into two sets: north-flank glaciers (including 5Y711A, B and C, and 5Y822A), which have exposures ranging from west through north to east; and south-flank glaciers (including 5Y822B, C, D, E and F), which have exposures ranging from northeast through south to east. The south-flank glaciers decreased by 1.8 km2 (2.8% of the 1971/72 glacier area) during 1971/72–92 and 1.55 km2 during 1992–2001/02, and thus decreased by 3.35 km2 (5.34% of the total 1971/72 glacier area) during 1971/72–2001/02. The north-flank glaciers decreased by 2.43% during 1971/72–92 and 2.2% during 1992–2001/02, and thus decreased by 5.18% during 1971/72–2001/02, less than the decrease of the south-flank glaciers.
A correlation analysis was performed to measure the strength of the association between some of the variables that control glacial evolution at the detailed scale. The variables studied for each glacier were: the maximum, minimum and median altitude, initial size (1971/72), and percent area change (1971/72–2001/02). There is a significant negative relationship between percent area change and the deviation between the maximum elevation of the glacier and its median elevation (r = –0.26, p < 0.01). This shows that glaciers with median elevations closer (in altitude) to their maximum elevations are losing more area. A significant negative relationship between the percent area loss and the maximum elevation of the glacier (at the head) (r = –0.25, p<0.01) indicates that glaciers located on lower summits are also losing more area. We found a significant negative relationship (r = –0.3, p<0.01) between the change in area and the altitudinal range of a glacier, calculated as maximum minus minimum elevation. This suggests that glaciers with a smaller altitudinal range are losing more of their area. There is a non-linear relationship between glacier initial size and percent area loss (Fig. 4). Variability in the percent area lost by small glaciers is high, ranging from 0 to 100% (Fig. 4). The wide range in the magnitude of glacier-area changes for small glaciers (<0.5 km2) may be partly explained by factors such as differences in the maximum elevation of glaciers relative to their ELAs, the elevation of the mountain on which the glacier is located and the altitudinal range of the glaciers. These statistical results confirm the important role of glacial initial size and altitudinal range in the subsequent shrinkage process (Reference Kaser and OsmastonKaser and Osmaston, 2002; Reference Ye, Ding, Liu and LiuYe and others, 2003; Reference Mark and SeltzerMark and Seltzer, 2005). In this case, small glaciers with narrow altitudinal range are losing more of their area, suggesting the marked sensitivity of the small glaciers to changes in the main climatic factors, which always exhibit a strong vertical gradient and thus control the accumulation and ablation processes. A change in local climate may raise the ELA of those small glaciers above their maximum elevation, putting the whole area of the glacier in the ablation zone.
Relationship between percent area loss and glacier size during the periods 1971/72–2001/02 and 1971/72–92 for Karlik Shan glaciers. Curve fit using a logarithmic function (r 2 = 0.32, p < 0.01).

Rates of glacier loss were significantly higher in other regions of the Tien Shan in the same period: Akshiirak, central Tien Shan (0.3% a–1 from 1977 to 2003) (Reference Aizen, Kuzmichenok, Surazakov and AizenAizen and others, 2007); Ala Archa (0.4% a–1 from 1977 to 2003) (Reference Aizen, Kuzmichenok, Surazakov and AizenAizen and others, 2007); the Ak-shirak range (0.5% a–1 from 1977 to 2001) (Reference Khromova, Dyurgerov and BarryKhromova and others, 2003); Zailiyskiy and Kungey Alatau (0.7% a–1 from 1955 to 1999) (Reference BolchBolch, 2007), northern Tien Shan; and the drainage of the Ürümqi river (0.5% a–1 from 1964 to 1992) (Reference Chen, Liu and JinChen and others, 1996).
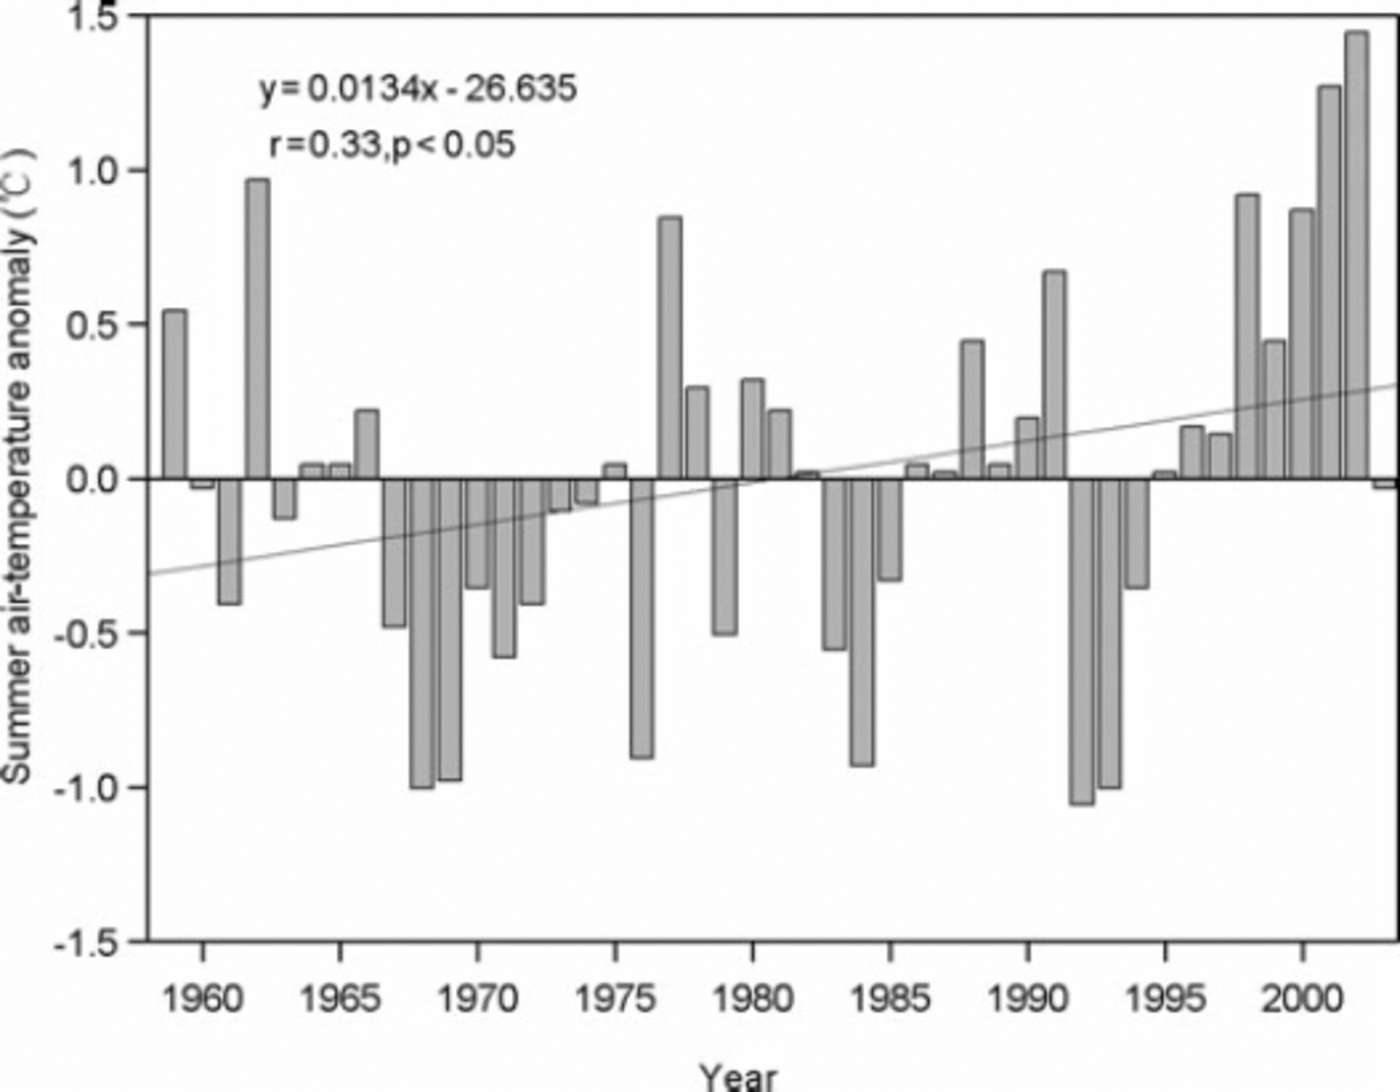
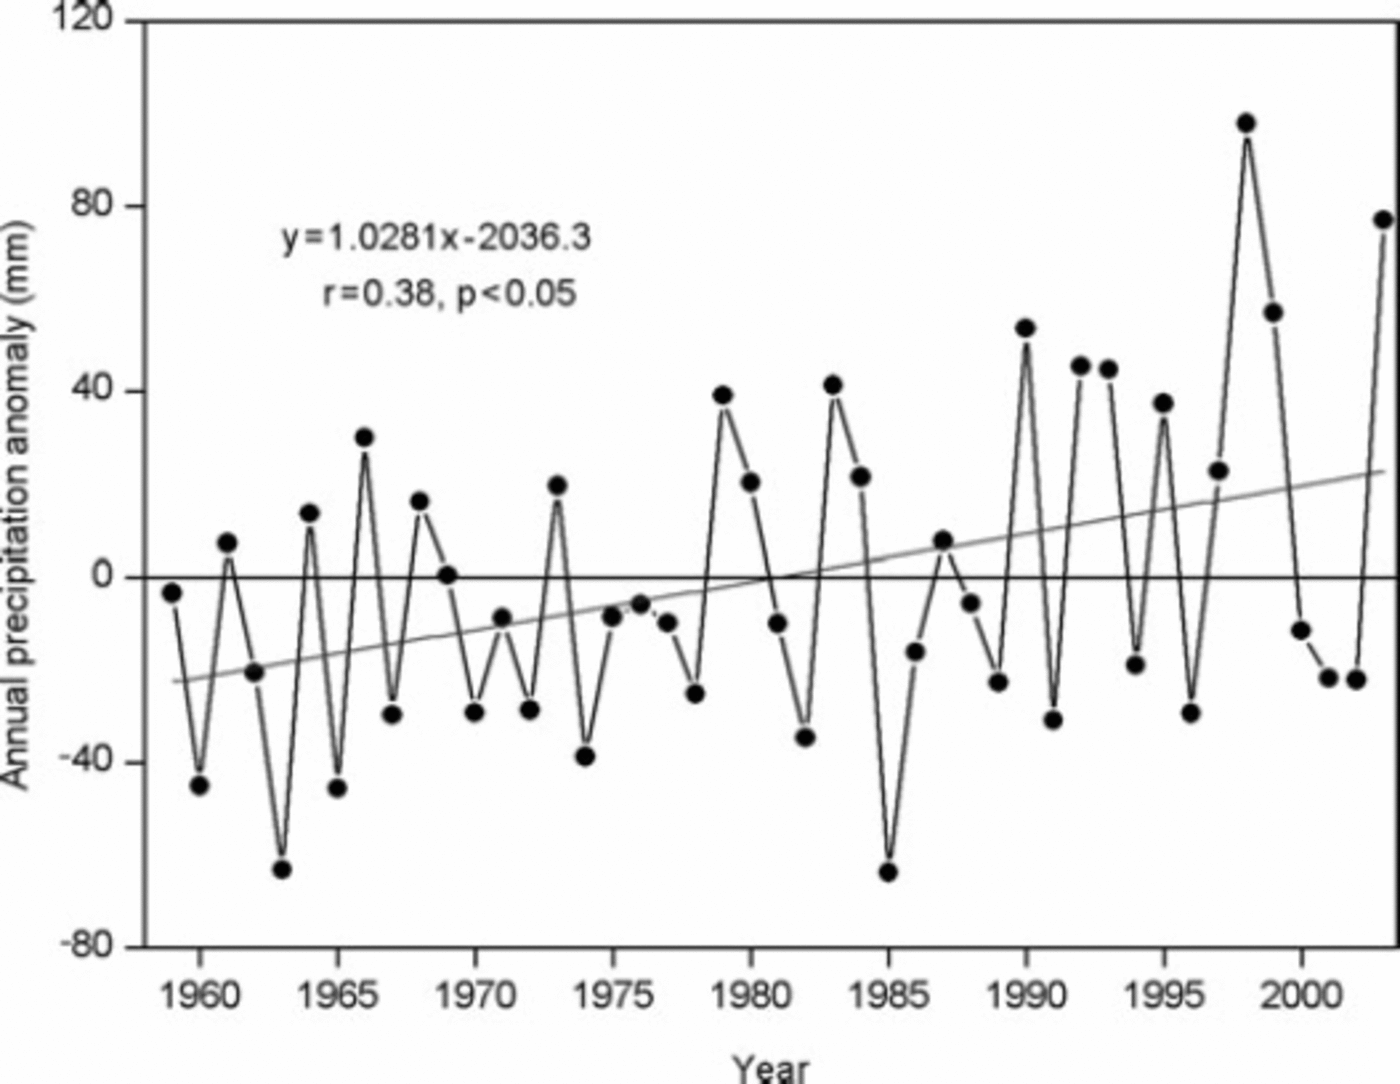
From the end of the 19th century to the 1970s, the climate in northwest China was warm and dry, and then changed to warm and wet (Reference Racoviteanu, Arnaud, Williams and OrdoñezShi and others, 2007). Precipitation and air temperature have increased continuously during recent decades (Reference ShiShi and others, 2007) and this was also recorded from Yiwu climate station (43°16' N, 94°42' E), with an elevation of 1728ma.s.l. (Fig. 5), close to the Karlik Shan. The climate data were available from the station during 1959–2003. The evolution of the temperature values maintains a persistent positive tendency from the end of the 1950s until 2003 (statistically significant: r = 0.33, p<0.05). Although precipitation has large interannual variability, it has a positive tendency during 1959–2003 (statistically significant: r = 0.38, p<0.05) (Fig. 6). Negative anomalies or near to average values of temperature are observed from the mid-1960s to 1985, and positive anomalies clearly dominate during 1985–2003, particularly since the mid-1990s. The average rates of summer temperature and annual precipitation increase are 0.38 ±0.06˚C (10 a)–1 and 10.3 ±3.9mm( 10a)–1, respectively. It can be concluded that the summer temperature during the period 1971–2002 in the Karlik Shan may have increased by about 1.1°C and annual precipitation increased by about 32 mm, 30% of the longterm (1971–2002) annual mean precipitation.
Variation of summer air-temperature (May–September) deviation from the average of the climate norm period 1961–90 from Yiwu climate station (1790ma.s.l.) during the period 1959–2003. The linear fit is statistically significant (r = 0.33, p<0.05).
Variation of annual precipitation deviation from the average of the climate norm period 1961–90 from Yiwu climate station (1790ma.s.l.) during the period 1959–2003. The linear fit is statistically significant (r = 0.38, p<0.05).
An estimate of the worldwide glacier sensitivity based on an energy-balance model of 12 glaciers around the world shows that the area-weighted glacier mass balance will decrease by 0.40ma–1w.e. for a uniform 1 K warming (Reference Möller, Schneider and KilianOerlemans and Fortuin, 1992). Reference Oerlemans and FortuinOerlemans and others (1998) discussed the effect of increased precipitation on the same glaciers by calculating the changes in annual balances when air-temperature was increased by 1°C and precipitation simultaneously by 10%. Reference Braithwaite and ZhangBraithwaite and Zhang (2000) assessed the sensitivity of the mass balance of five Swiss glaciers to air-temperature changes using a degree-day model. If annual precipitation also increased by 20% it would partly offset the effect of the 1°C higher temperatures but could not compensate for it. Glaciers in High Mountain Asia are more vulnerable than those of the other regions (Reference Fujita and Y.Fujita and Ageta, 2000). The sensitivity of ELA to a change in the two variables in High Mountain Asia is a rise of 120–160m for a 1°C summer temperature rise or a 40–100% decrease in annual precipitation (Reference KangKang, 1996). To keep the original ELA under a rise of summer air temperature by 1°C, precipitation increase needs to be more than 44% for the glaciers in the eastern Tien Shan (Reference KangKang, 1996). Under the combined effects of rises in air temperature and precipitation in the study region from 1971 to 2002, a rise of the glacier equilibrium line in the study region thus seems inevitable. Although precipitation in most parts of the Tibetan Plateau and surrounding regions is increasing, probably adding more snow to the accumulation zone of glaciers, the key cause of general glacial retreat is climatic warming (Reference Yao, Wang, Liu, Pu, Shen and LuYao and others, 2004). The reason is that along with precipitation increasing, temperatures are rising (Reference Liu and B.Liu and Chen, 2000; Reference Yao, Liu, Wang and ShiYao and others, 2000). Increased melt due to rising temperature outweighs any increased snowfall on glaciers (Reference Ye, Ding, Liu and LiuYao and others, 2004). Therefore glaciers in this region might lose mass as increases in annual precipitation do not compensate for ablation rate increases caused by the dramatic summer air-temperature rise during the study period.
Conclusions
The total glacier area in the Karlik Shan decreased by about 5.3% during the period 1971/72–2001/02. Small low-lying glaciers (<0.5 km2) with a large proportion of their area in the ablation zone shrank at higher rates than did larger glaciers. Furthermore, glacier shrinkage has accelerated since the 1990s. These changes have been interpreted primarily as a result of the air-temperature trend observed in this region since the 1960s.
Acknowledgements
We thank two anonymous reviewers and the scientific editor J.G. Cogley for constructive comments on the manuscript. This work was supported by the Chinese Academy of Sciences (100 Talents Project and KZCX3SW344), the National Natural Science Foundation of China (40825017) and the National Key Technology R&D Program (2006BAB18B01).



