Introduction
Many geological repository concepts for radioactive waste envision disposing of metallic waste-containing canisters in deep tunnels, using compacted bentonite as backfilling material (e.g. Nagra 2002; ANDRA 2005; SKB 2011; Posiva 2012). This smectite-rich material possesses favorable properties, such as large swelling capacity and retention capacity for radionuclides. In some cases (e.g. Swiss, Spanish, or French concepts) low-alloy steel waste-containing canisters will be used. Upon repository closure, the surrounding bentonite will be gradually saturated by the ingress of natural porewater from the surrounding host rock, and at the same time will experience elevated temperatures (up to 130°C) originating from the radioactive decay of the waste. Steel canister corrosion will be initiated, eventually leading to the release of mobile dissolved Fe species reacting with the bentonite clay (Wersin et al. Reference Wersin, Johnson and Schwyn2004; Bradbury et al. Reference Bradbury, Berner, Curti, Hummel, Kosakowski and Thoenen2014).
A constantly growing set of studies is focused on the effects of corroding Fe on bentonite or on other clay materials (Wersin et al. Reference Wersin, Birgersson, Olsson, Karnland and Snellman2008; Bradbury et al. Reference Bradbury, Berner, Curti, Hummel, Kosakowski and Thoenen2014; Kaufhold et al. Reference Kaufhold, Hassel, Sanders and Dohrmann2015). Most studies have been dedicated to small-scale laboratory systems, often designed to enhance Fe–clay interactions. Several corrosion-related processes affecting the barrier function of the bentonite backfill have been recognized, including (1) local cementation of bentonite via precipitation of Fe(II)/(III) (oxyhydr)oxides (Carlson et al. Reference Carlson, Karnland, Oversby, Rance, Smart, Snellman, Vahanen and Werme2007), (2) smectite dissolution via pH increase (Marty et al. Reference Marty, Fritz, Clement and Michau2010), (3) destabilization of the dioctahedral smectite structure (Lantenois et al. Reference Lantenois, Lanson, Muller, Bauer, Jullien and Plançon2005) or (4) transformation of smectite to a non-swelling Fe phyllosilicate such as berthierine, cronstedtite, or odinite, by incorporation of diffusing Fe into the structure (Mosser-Ruck et al. Reference Mosser-Ruck, Cathelineau, Guillaume, Charpentier, Rousset, Barres and Michau2010; Kaufhold et al. Reference Kaufhold, Hassel, Sanders and Dohrmann2015), and (5) sorption of Fe on smectite, possibly followed by reduction of smectite structural Fe (Gehin et al. Reference Gehin, Greneche, Tournassat, Brendle, Rancourt and Charlet2007; Soltermann et al. Reference Soltermann, Fernandes, Baeyens, Dahn, Miehe-Brendle, Wehrli and Bradbury2013; Latta et al. Reference Latta, Neumann, Premaratne and Scherer2017) leading to changes of clay properties such as cation-exchange capacity (CEC) or hydration (Stucki Reference Stucki, Bergaya, Theng and Lagaly2006). In turn, the properties of bentonite also seem to have an influence on the corrosion process (Kaufhold et al. Reference Kaufhold, Hassel, Sanders and Dohrmann2015).
Comparatively few studies of steel–bentonite interaction were conducted under more realistic repository settings, i.e. low liquid/solid and Fe/clay ratios, larger scale, and longer times (e.g. in situ Long-Term Test of Buffer Material (LOT, Karnland et al. Reference Karnland, Olsson, Dueck, Birgersson, Nilsson and Hernan-Hakansson2009), Alternative Buffer Material (Eng and Svensson Reference Eng and Svensson2007), Full-scale Engineered Barrier Experiment (FEBEX) Mockup (Martín et al. Reference Martín, Barcala and García-Gutiérrez2006), and FEBEX in situ test at the Grimsel Test Site (GTS) in Switzerland (Fuentes-Cantillana et al. Reference Fuentes-Cantillana, García-Siñeriz, Franco, Obis, Pérez, Jullien, Alberdi, Barcala, Campos, Cuevas, Fernández, Gamero, García, Gómez, Hernández, Illera, Martín, Melón, Missana, Ortuno, Pardillo, Rivas, Turrero, Villar, Mingarro, Pelayo, Caballero, Cuadros, Huertas, Huertas, Jiménez de Cisneros, Linares, Bazargan-Sabet, Ghoreychi, Jockwer, Wieczorek, Kickmaier, Marschall, Martínez, Carretero, Dai, Delgado, Juncosa, Molinero, Ruiz, Samper, Vázquez, Alonso, Carrera, Gens, García-Molina, Guimera, Guimaraes, Lloret, Martínez, Olivella, Pintado, Sánchez, Elorza, Borregón, Canamon, Rodriguez Pons-Esparver, Fariña, Farias and Huertas2000)). Such experiments were conducted over timescales varying from years to decades. According to the experiments dismantled and studied so far, much less smectite alteration has been noted under such conditions (compared to controlled small-scale experiments), but magnetite, Fe (oxyhydr)oxides, and siderite were observed as corrosion products (Papillon et al. Reference Papillon, Jullien and Bataillon2003; Carlson et al. Reference Carlson, Karnland, Oversby, Rance, Smart, Snellman, Vahanen and Werme2007; Martin et al. Reference Martin, Bataillon and Schlegel2008; Gaudin et al. Reference Gaudin, Gaboreau, Tinseau, Bartier, Petit, Grauby, Foct and Beaufort2009; Schlegel et al. Reference Schlegel, Bataillon, Blanc, Pret and Foy2010; Wersin et al. Reference Wersin, Jenni and Mäder2015). Despite the numerous investigations, the overall mechanisms of interaction between corroding steel and bentonite are still to be defined (Kaufhold et al. Reference Kaufhold, Hassel, Sanders and Dohrmann2015). Uncertainties in predicting the stability of the bentonite backfill in contact with reactive metallic Fe components, therefore, persist, in particular regarding the mineralogical and hydraulic properties of the contact area between steel and clay (Perronnet et al. Reference Perronnet, Jullien, Villieras, Raynal, Bonnin and Bruno2008).
The present study focused on the contact area between a corroding Fe source and compacted bentonite in the long-term (18 years) FEBEX in situ test at the GTS. This test was originally designed to demonstrate the feasibility of an engineered barrier system in granitic rock (Huertas et al. Reference Huertas, Farinia, Farias, Garcia-Sineriz, Villar, Fernandez, Martin, Elorza, Gens, Sanchez, Lloret, Samper and Martinez2006). It did not aim specifically at studying the details of steel corrosion and iron–bentonite interaction. Nevertheless, post-mortem analysis enabled valuable insight into these processes as indicated already after the first partial dismantling carried out in 2002 (see below). Therefore, after the final dismantling carried out in 2015, a strong focus of the investigation was on corrosion-related effects on the bentonite (Kober et al. Reference Kober, Giroud, Uyama, Hitomi, Hayagane, Kadota, Saito, Okamoto, Aoshima, Osawa, Hadi, Grenèche, Wersin, Svensson, Lundgren, Kaufhold, Dohrmann, Ufer, Torres, Turrero, Sánchez, Garralón, Gómez, Campos, Leal Olloqui, Scott and Madina2017). The primary objective of the present study was the characterization of colored interaction zones observed in the bentonite block, newly formed Fe phases, and the effect of corrosion on the bentonite chemistry. The secondary objective was the development and optimization of analytical methods for characterizing the steel–clay contact areas, which could be applied later to the samples from further ongoing long-term in situ tests. An extended methodology combining spatially resolved (SEM-EDX and μ-Raman spectroscopy) and bulk-type methods (XRF, XRD, and 57Fe Mössbauer spectrometry) was employed.
EXPERIMENTAL METHODS
The FEBEX in situ test
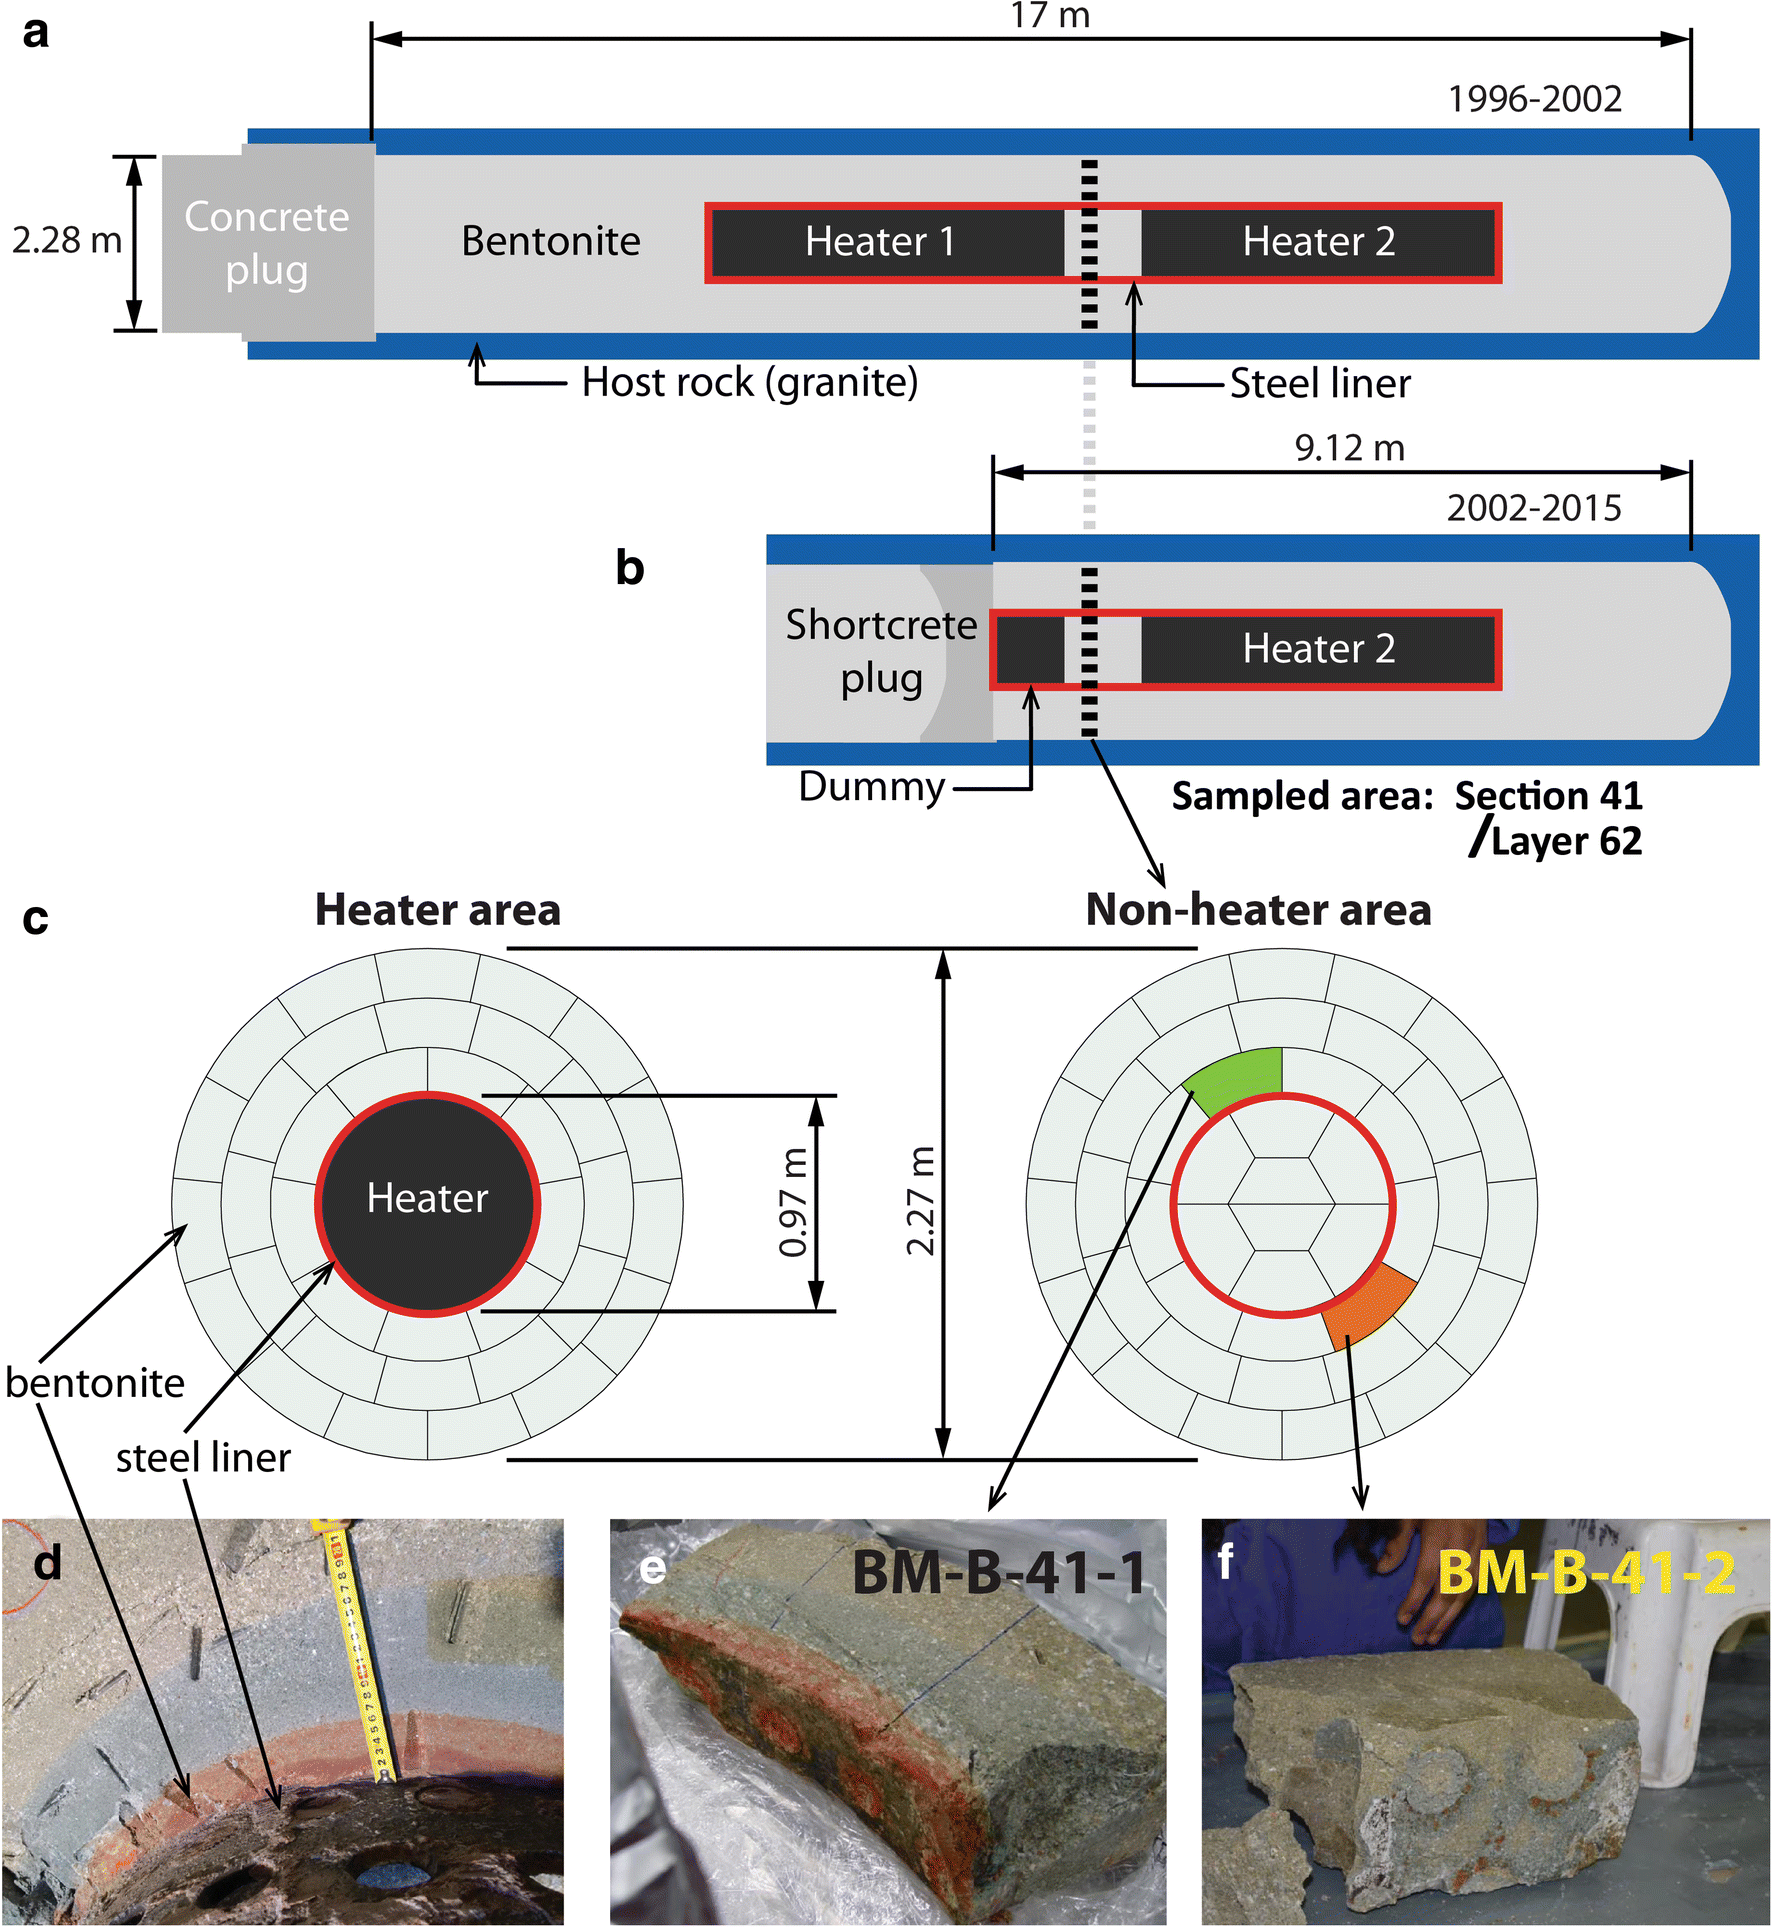
The FEBEX in situ test was designed by the Spanish Radioactive Waste Management Organization (ENRESA) to demonstrate the feasibility of constructing horizontal engineered barrier systems, to explore potential design issues, and to understand better the thermo-hydro-mechanical (THM) and thermo-hydro-geochemical (THG) processes in the near field under a realistic repository setting with variable humidity and redox conditions and temperatures of 100°C. The test involved a carbon steel (15Mo3 after DIN 17155, composition: 99.04 wt.% Fe, 0.16 wt.% C, 0.30 wt.% Si, and 0.60 wt.% Mo) liner surrounded by a clay barrier, and enclosing two heaters (Fig. 1a). In total, 300 tons of bentonite were homogenized for construction of the FEBEX in situ test, and compacted to blocks of 20 kg. The project was initiated in 1994 and construction finished in 1996. Construction of the experiment took 3.5 months. Heating was started in 1997 (after a pre-operational stage of 4 months between closure of the plug and heating), and a partial dismantling was performed in 2002. The first heater was turned off and removed, replaced by a dummy cell, blocks of bentonite were collected, and the experiment was closed again. The second dismantling started in 2015 and continued until 2016. Portions of the steel pieces retrieved (liner, heater, dummy cell, extensometers, fissurometers, drilling rods, cable ducts, etc.) showed clear corrosion features. The impact of corrosion could also be observed in some zones of the bentonite surrounding those corroded objects, appearing as concentric and colored (red, orange, blue) halos (e.g. Fig. 1b). A complete description of the experiment has been published (Fuentes-Cantillana and García-Siñeriz Reference Fuentes-Cantillana and García-Siñeriz1998; Fuentes-Cantillana et al. Reference Fuentes-Cantillana, García-Siñeriz, Obis, Pérez, Alberdi, Barcala, Campos, Cuevas, Fernández, Gamero, García, Gómez, Hernández, Illera, Martín, Melón, Mingarro, Ortuno, Pardillo, Pelayo, Rivas, Rodríguez, Turrero, Villar, Caballero, Jiménez de Cisneros, Linares, Martínez, Samper, Delgado, Juncosa, Molinero, Alonso, Carrera, Gens, García-Molina, Guimera, Guimaraes, Lloret, Martínez, Elorza, Borregón, Fariña and Farias1998, Reference Fuentes-Cantillana, García-Siñeriz, Franco, Obis, Pérez, Jullien, Alberdi, Barcala, Campos, Cuevas, Fernández, Gamero, García, Gómez, Hernández, Illera, Martín, Melón, Missana, Ortuno, Pardillo, Rivas, Turrero, Villar, Mingarro, Pelayo, Caballero, Cuadros, Huertas, Huertas, Jiménez de Cisneros, Linares, Bazargan-Sabet, Ghoreychi, Jockwer, Wieczorek, Kickmaier, Marschall, Martínez, Carretero, Dai, Delgado, Juncosa, Molinero, Ruiz, Samper, Vázquez, Alonso, Carrera, Gens, García-Molina, Guimera, Guimaraes, Lloret, Martínez, Olivella, Pintado, Sánchez, Elorza, Borregón, Canamon, Rodriguez Pons-Esparver, Fariña, Farias and Huertas2000; Lanyon and Gaus Reference Lanyon and Gaus2017).
Overall layout of FEBEX in situ test (a) before (1996–2002) and (b) after (2002–2015) partial dismantling. (c) Cross-sections of the heater and non-heater areas, indicating the location of the sampled blocks. (d) Corrosion-impacted bentonite block still in place at the contact with the steel liner. (e–f) Studied blocks BM-B-41-2 and BM-B-42-2

On-site and in-lab sampling activities
The present study focused on two blocks originating from the same section of the experiment, which was located between the two heaters during the first sequence of the experiment and, later after the partial dismantling, between the second heater and the dummy cell replacing the first heater (Fig. 1a). Temperatures in the range 30 to 60°C were likely reached in this location of the experiment (Fuentes-Cantillana and García-Siñeriz Reference Fuentes-Cantillana and García-Siñeriz1998). A final water content of 26 wt.% was determined in this area of the experiment (Villar et al. Reference Villar, Iglesias, Abós, Martínez, de la Rosa and Manchón2016), showing a notable increase compared to the initial state (13 wt.% upon construction, Fuentes-Cantillana and García-Siñeriz Reference Fuentes-Cantillana and García-Siñeriz1998). Dismantling proceeded layer by layer, and the presence of a colored corrosion halo was observed as soon as the bentonite layer separating the dummy cell and the second heater was reached (Fig. 1b). This halo was asymmetric, and preferentially located on the upper left part of the liner, while the opposite side of the liner appeared almost unchanged by corrosion. In fact, a plastic sheet was placed between the granite and the lower right part of this section of the bentonite barrier during construction of the FEBEX experiment. This sheet was inadvertently left behind and further hindered direct water ingress, and thus Fe diffusion to this area of the experiment (Villar et al. Reference Villar, Iglesias, Abós, Martínez, de la Rosa and Manchón2016). Two bentonite blocks of ~22 kg each (~480 mm × 125 mm × 220 mm length × width × height) were extracted from the bentonite backfill, one from the strongly impacted area (block BM-B-41-1, Fig. 1d) and the other from the much less impacted area (block BM-B-41-2, Fig. 1c). These blocks were only partially exposed to the ambient atmosphere (one side was exposed and covered by a plastic sheet to limit drying and oxidation) for a few hours before they could be extracted, vacuum-packed, and transported to the laboratory. Using a band saw (bi-metal M51, WESA-Sägen H. Weber AG, Menziken, Switzerland), 20 mm thick slabs were extracted from the middle part of each sample block and used for the present study (e.g. Fig. 1e).
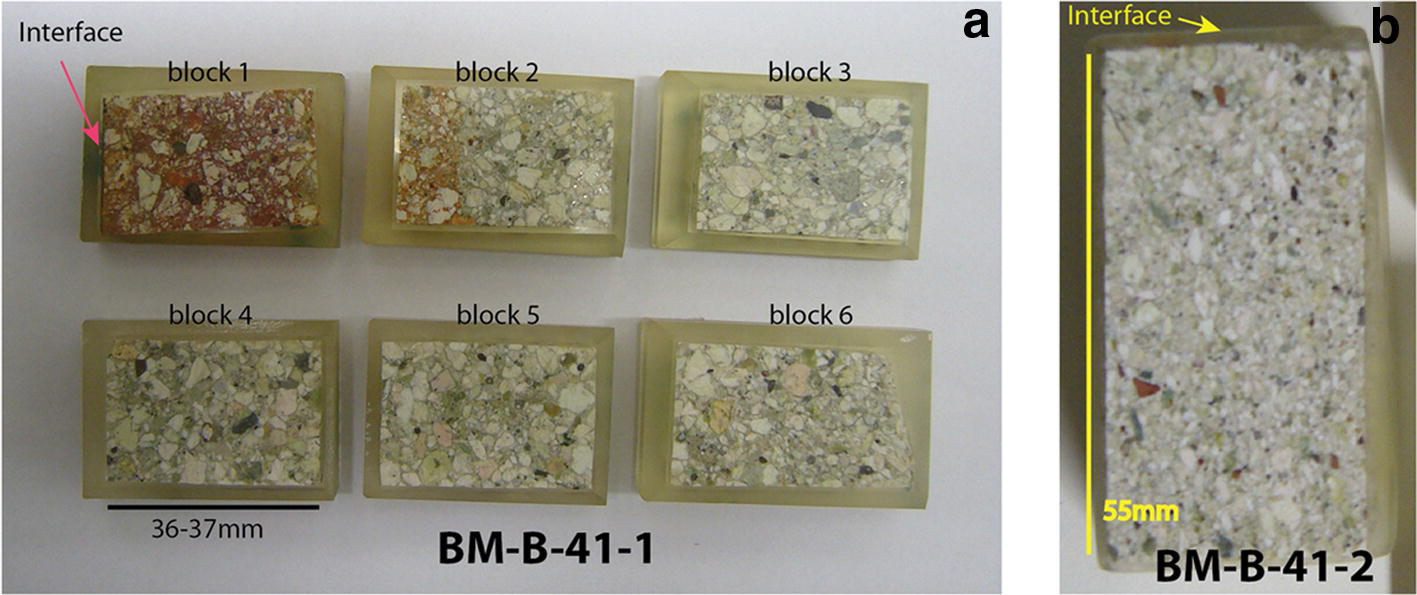
Two different sampling routines were further applied. First, six contiguous slabs (36–37 mm long, 20 mm wide) were cut from the BM-B-41-1 block and vacuum-embedded with epoxy resin (Araldite® XW396/XW397, Astorit AG, Einsiedeln, Switzerland), then they were polished using diamond grinding papers (using Apex DGD 70, 45, 30, and 15 μm, and finally using a 6 μm diamond suspension; Buehler, Lake Bluff, Illinois, USA) and petroleum (odorless petrol; Univar AG, Birmensdorf, Switzerland). The polished surfaces formed a profile perpendicular to the interface and cross–cutting the entire block (Fig. 2a). They were analyzed using SEM-EDX to obtain electron backscattering images and chemical maps, and to establish chemical profiles of the major elements perpendicular to the interface. Raman spectroscopy was also employed to identify some of the accessory phases present in the matrix, focusing on Fe-bearing species. One shorter polished section was prepared from the significantly less impacted block BM-B-41-2 (Fig. 2b).
(a) Six contiguous polished surfaces of a cross section of block BM-B-41-1 and (b) one polished section of block BM-B-41-2

A large portion of one slab of block BM-B-41-1 was powdered in a glovebag with a 95:5 N2:H2 atmosphere (Coy Laboratory Product Inc., Grass Lake, Michigan, USA). Once the “crust sample” (the actual contact with the liner) was scraped off (few hundreds of micrometers thick), 5–6 mm thick layers parallel to the interface were progressively cut off the slab (using a ceramic knife) and stored in individual tubes. Thirty different samples (~20 g each) were separated (i.e. up to 18 cm deep in the block). Samples were named after the color of the zone they were extracted from (B: blue, O: orange, R: red, G: green) and the order of sampling. The outermost layer was also powdered. Chemical analysis (XRF) was performed on all powdered samples, and selected samples were characterized by transmission 57Fe Mössbauer spectrometry and XRD (12 samples, including the raw bentonite).
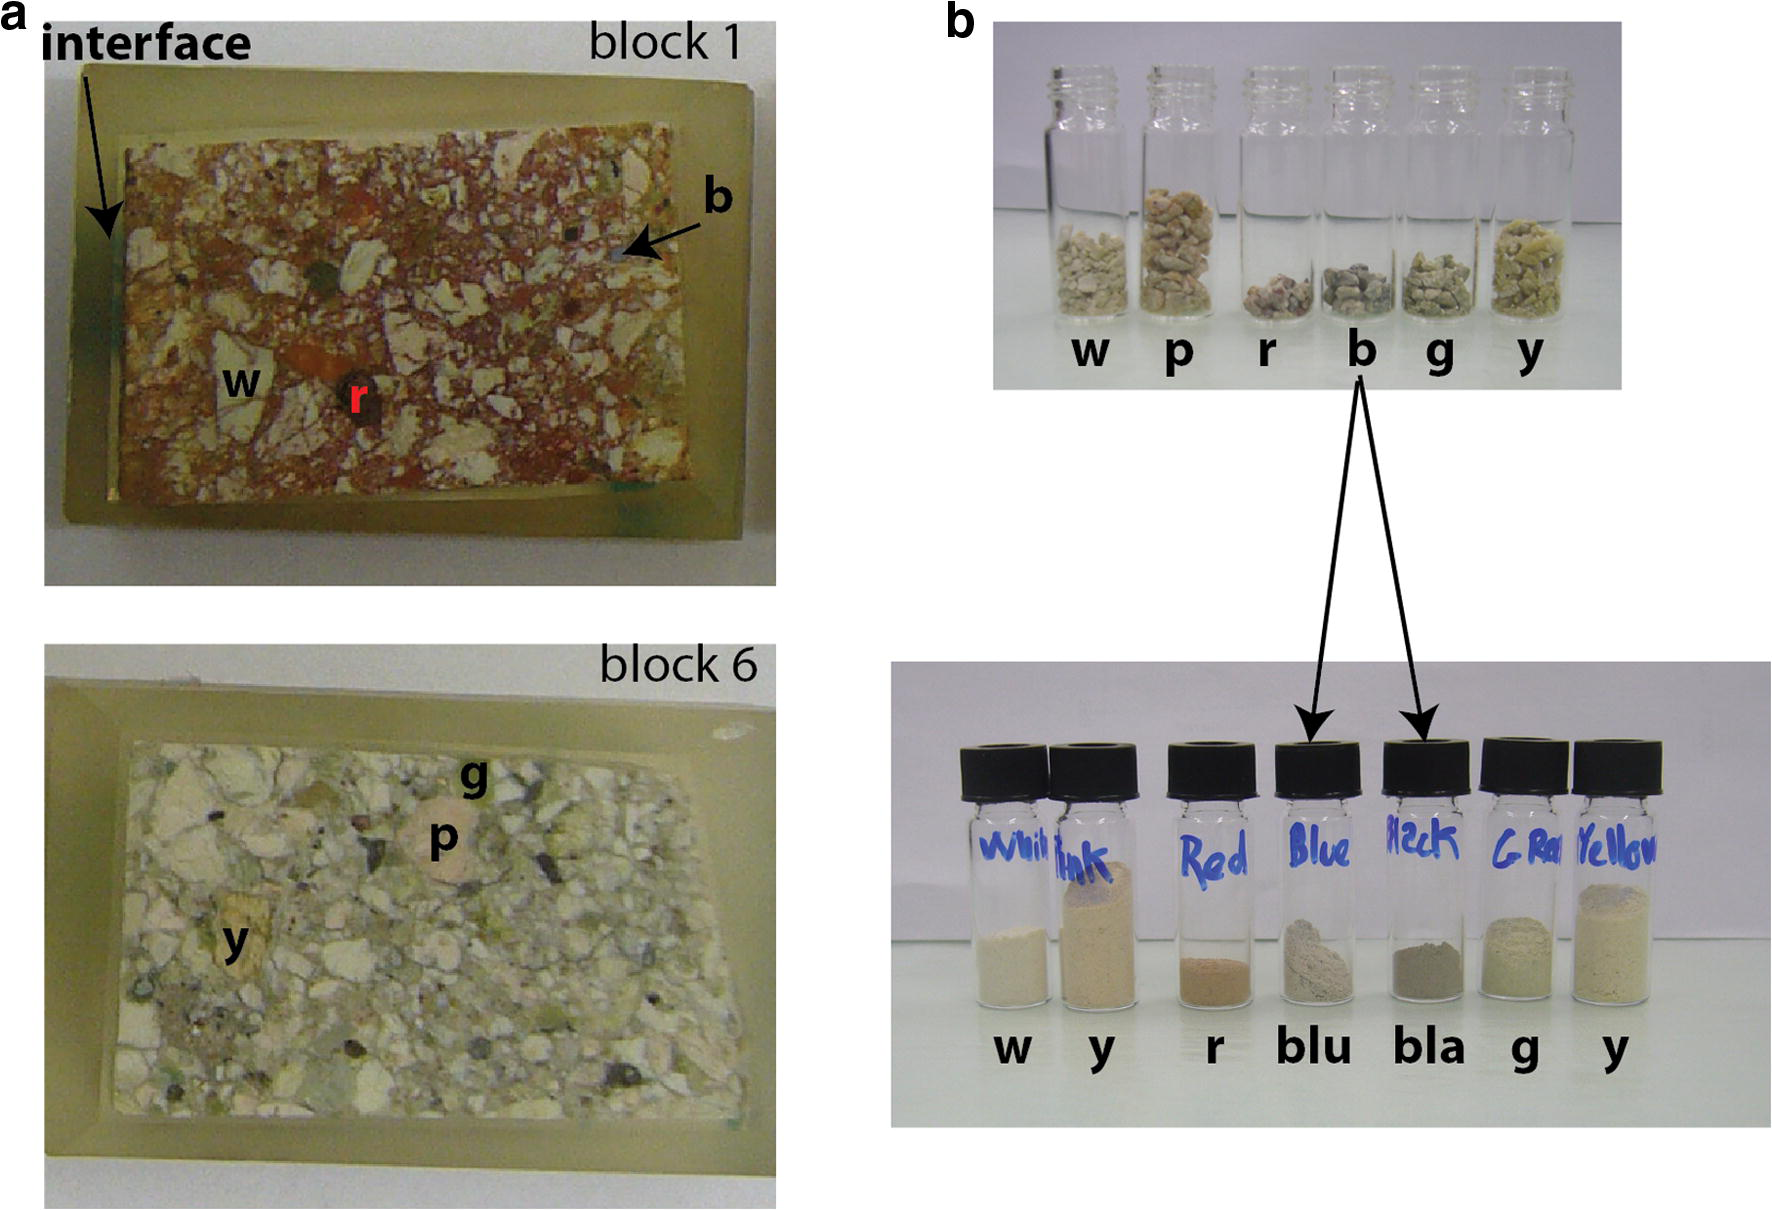
A portion of the raw bentonite block was also crushed gently by hand in ambient atmosphere and various colored aggregates were separated (Fig. 3). They were further crushed by hand in an agate mortar and analyzed using XRD to determine the mineralogical composition.
(a) Two polished sections from block BM-B-41-1 and (b) color aggregates that were collected in the raw material and powdered. Letters indicate the color of the sample (w: white, p: pink, r: red, blu: blue, bla: black, g: green, y: yellow)

Analytical methods
SEM-EDX analyses
The uncoated sample surface was examined in a SEM (EVO-50 XVP, Carl Zeiss AG, Oberkochen, Germany) equipped with an EDAX® Sapphire light-element detector (AMETEK, Berwyn, Pennsylvania, USA) in low vacuum mode (10–20 Pa) with a beam acceleration of 20 kV, a sample current of 500 pA, and a working distance of 8.5 mm. The beam current was adjusted to yield a dead time of 8–15% for EDX analysis. EDX element maps with a resolution of 128 × 100 pixels were acquired using a dwell time of 200 μs/pixel. Mappings were conducted with a magnification of 80, which results in pixel size of ~11 μm2 and maps of ~1.5 mm × 1.1 mm. Contiguous mappings were collected in series in order to obtain large-scale mosaic-like elemental mappings. Mapped elements generally included C, O, Na, Mg, Al, Si, P, S, Cl, K, Ca, Ti, and Fe. The total grid dimension was usually 26–27 mappings along the x axis and eight mappings along the y axis (total dimensions of ~34 mm × 9 mm). Given the parameters of analysis (resolution, dwell time), the acquisition time per block was ~12 h. Output data from the operating software (Smartsem® by ZEISS for the SEM part and Genesis® by AMETEK for the EDX) were collected and treated with a Matlab (MathWorks, Natick, Massachusetts, USA) homemade algorithm in order to establish chemical profiles, large scale elemental mappings, and backscatter images.
In the present study, the main data obtained from the SEM-EDX survey are presented as “Al-normalized” chemical profiles of the major elements (Si, Fe, Mg, Ca, Na, K, and S). Such a diagram represents the atomic ratio of a given element over Al as a function of the distance to the interface. The main assumption underlying this “Al-normalization” procedure is that, amongst the probed elements, Al is the least likely to change in terms of amounts and spatial localization (Ackermann Reference Ackermann1980; Luoma Reference Luoma, Furness and Rainbow1990). As it is the least likely element to be dissolved and transported elsewhere under the conditions of the experiment, it can, thus, be used as a proxy for tracking the local variations of all the other probed elements relative to the original bentonite. The so-called “Al-normalized” values were computed directly from the quantification results (Lábár and Török Reference Lábár and Török1992; Trincavelli et al. Reference Trincavelli, Limandri and Bonetto2014). For a given element, each point of the profile represents the average ratio of the content in this element over the Al content of a given column of the analysis grid. The error bars account for twice the standard deviation. In the case of Fe, mapped sectors containing large (0.1–1 mm) goethite grains from the original bentonite matrix were not included in the profile (detailed further below). Raw EDX data were corrected using individual Standard Element Coefficients (SEC) factors for each element. These factors were determined from the EDX analysis of six different raw bentonites of very similar composition for which reference XRF data were also available (Svensson et al. Reference Svensson, Dueck, Nilsson, Olsson, Sandén, Lydmark, Jägerwall, Pedersen and Hansen2011).
μ-Raman spectroscopy
Raman spectroscopy was performed with a Jobin Yvon LabRAMHR800 instrument (HORIBA Scientific, Kyoto, Japan), consisting of a BX41 confocal microscope (Olympus, Shinjuku, Japan) coupled to an 800 mm focal length spectrograph. A non-attenuated He–Ne laser (20 mW, polarized 500:1) with an excitation wavelength of 632.817 nm (red) was focused on the sample surface and the Raman signal was collected in reflection mode. The sampled volume was a few μm3 using a 100 × objective lens. Spectra were measured in Raman shift intervals of 150 to 1400 cm−1 in five steps of 250 cm−1. Acquisition time for each step was 2 × 15 s, i.e. 2.5 min in total. Acquisition time was doubled for some analyses in the clay matrix. The spectra were recorded with Labspec V4.14 software (HORIBA Scientific). Identification of the species was done using the spectra library included in the HORIBA Edition of the KnowItAll® (Bio-Rad Laboratories AG, Cressier, Switzerland). The spectra presented in this report indicate the name(s) of identified species and corresponding reference number(s) in the library, which actually combines several entries for inorganics, minerals, and gemstones from Minlab v3 or RRUFF (Lafuente et al. Reference Lafuente, Drowns, Yang, Stone, Armbruster and Danisi2015).
XRF analyses
Glass pellets were made by fusing a 1:10 mixture of sample powder and Li-tetraborate at 1150°C (Merck, New Jersey, USA). XRF analyses of major elements were performed on a PW 2400 spectrometer (Koninklijke Philips N.V., Amsterdam, Netherlands) and corrected with the internal Philips software X40 on the basis of a set of international rock standards. Loss on ignition (LOI) was determined by mass difference before and after fusing. Water content was determined during the same process (105°C for 2 h).
57Fe Mössbauer spectrometry
The Mössbauer spectra were recorded at room temperature (RT, 300 K) and at 77 K using a constant acceleration spectrometer (driving unit supplied by WissEl GmbH, Germany) and a 57Co source dispersed in a Rh matrix. Velocity calibrations were carried out using an α-Fe foil at RT. The values of the hyperfine parameters were refined using a least-squares fitting procedure (MOSFIT homemade unpublished program, Le Mans Université, France) with a discrete number of independent quadrupolar doublets and magnetic sextets composed of Lorentzian lines. The values of isomer shift (I.S.) are reported relative to that of the α-Fe spectrum obtained at RT. The proportions of each Fe species are proportional to the relative spectral area. This is because the f-Lamb-Mössbauer factors which correspond to the fraction of gamma rays emitted and absorbed without recoil are assumed to be identical for the different phases present in the samples and for the different Fe species present in the same phase (Mössbauer Reference Mössbauer1958; Tzara Reference Tzara1961; Gütlich et al. Reference Gütlich, Bill and Trautwein2011).
All observed quadrupolar doublets stand for paramagnetic high-spin octahedral Fe (further referred to as “para-Fe”), while all magnetic sextets stand for magnetically ordered species (in octahedral coordination as well, further referred to as “mag-Fe”). In addition, it is important to emphasize that the quadrupolar component may in part be attributed to superparamagnetic species originating from very fast relaxation phenomena: it is, thus, necessary to compare Mössbauer spectra recorded versus different temperatures and/or in the presence of an external magnetic field. Goethite and hematite in particular display hyperfine structures which are strongly dependent on the crystalline grain size, the distance between adjacent grains, and temperature (Vandenberghe and De Grave Reference Vandenberghe, De Grave, Yoshida and Langouche2013). In the present study, this temperature dependency was used to discriminate between “large” grains (or aggregates) of goethite or hematite (>~ 50 nm, magnetically ordered at room temperature and 77 K), “medium-sized” grains (~5–50 nm, paramagnetic at room temperature, but magnetically ordered at 77 K, i.e. superparamagnetic), and “small” grains (<~ 5 nm, paramagnetic at both temperatures, thus much more difficult to discriminate from other species such as the clay structural Fe(III)). In addition, the extent of the hyperfine magnetic field (B hf) and of quadrupolar splitting (Q.S.) enable discriminating goethite from hematite (the latter generally exhibits a stronger B hf and a higher Q.S.).
XRD analyses
Studies of samples from block BM-B-41-1 were conducted using an Anton Paar domed sample holder for air-sensitive materials equipped with a polycarbonate dome (Anton Paar GmbH, Graz, Austria). The powdered samples were loaded on the sample holder in the anaerobic chamber, the surface was flattened with a glass slide and the dome was closed before the samples were removed from the chamber. The raw bentonites were also analyzed without the dome. The samples were analyzed with a X’Pert PRO X-ray diffractometer (PANalytical, Almelo, Netherlands) and recorded using CuKα radiation with a wavelength of 1.54 Å and an X-ray tube operated at 40 mA and 40 kV. The samples were scanned from 5 to 60°2θ using a step size of 0.0167°2θ and a time of 10 s per step, with automated divergence slits. Samples were spun during the measurement, at a rate of one revolution every 8 s. Raw material and colored fractions isolated from raw material (Fig. 3) were analyzed without the dome.
Results
Polished blocks
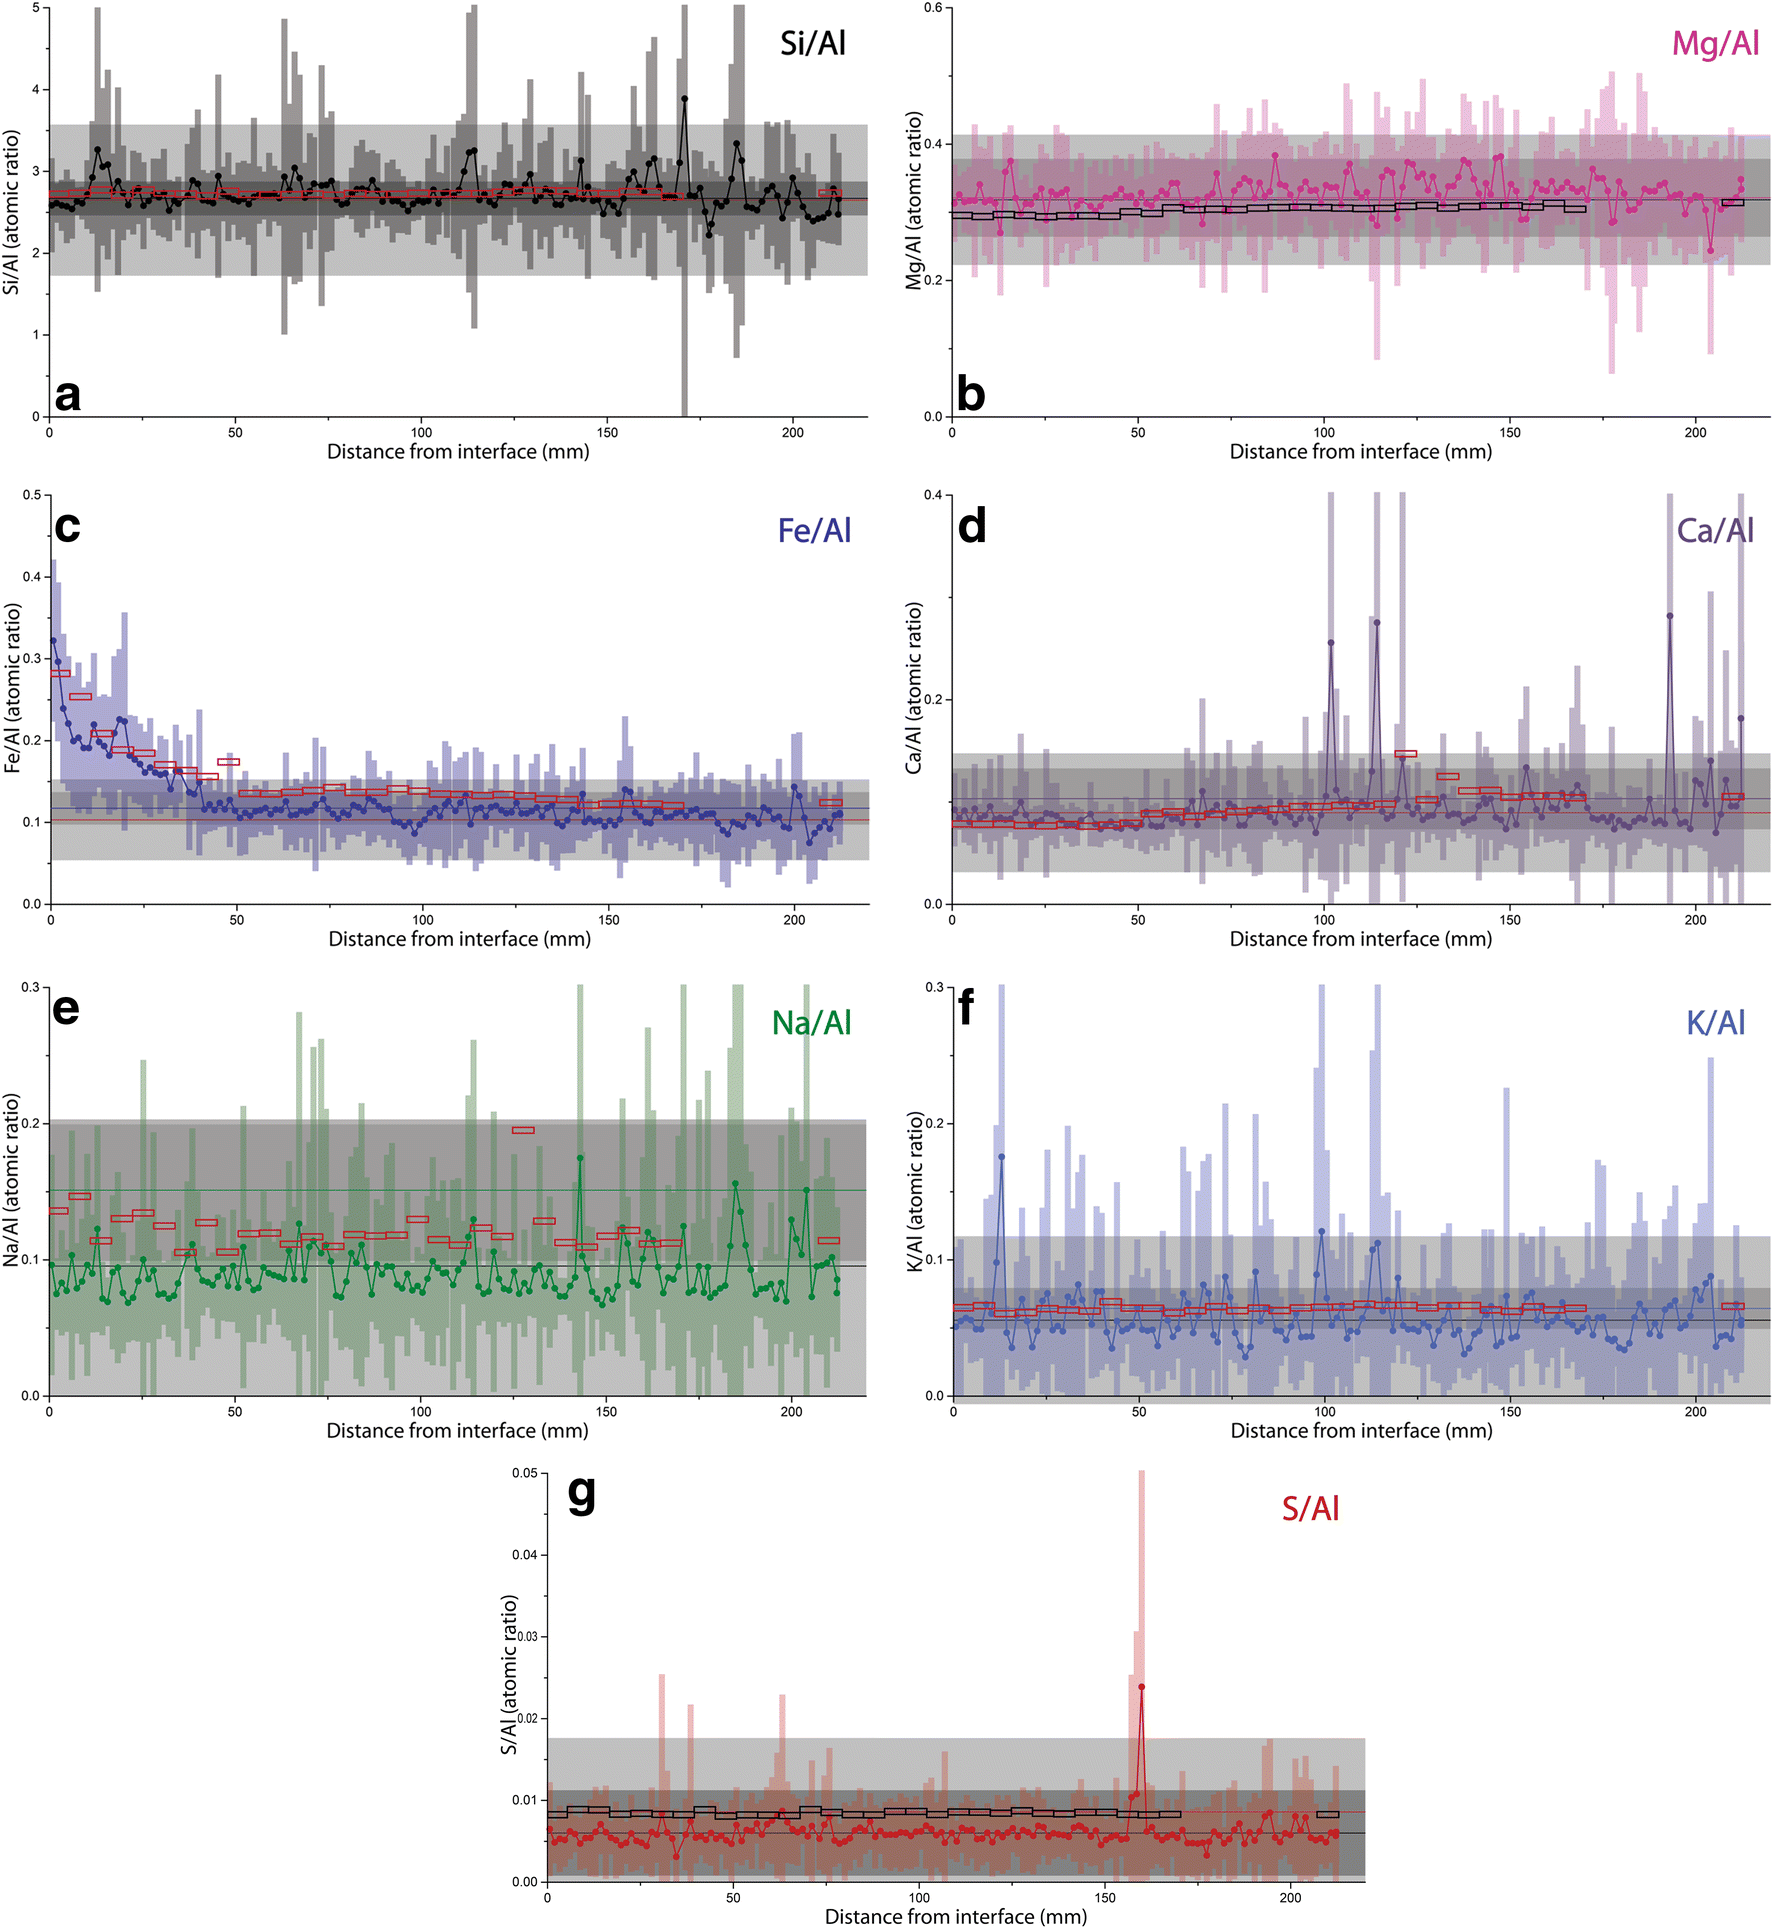
The SEM-EDX investigation enabled the establishment of a chemical mapping of the major elements (including Si, Al, Fe, Mg, Ca, Na, K, S, and Ti) on a large portion of the polished section (a total surface of 22 cm2 for block BM-B-41-1 and 4 cm2 for block BM-B-41-2). Results are presented as “Al-normalized” chemical profiles of the major elements perpendicular to the steel-bentonite interface (Figs. 4 and S1). Reference values inferred from inter-laboratory XRF analysis of the raw material are displayed on the diagram (reference data from Kober and Van Meir Reference Kober, Giroud, Uyama, Hitomi, Hayagane, Kadota, Saito, Okamoto, Aoshima, Osawa, Hadi, Grenèche, Wersin, Svensson, Lundgren, Kaufhold, Dohrmann, Ufer, Torres, Turrero, Sánchez, Garralón, Gómez, Campos, Leal Olloqui, Scott and Madina2017). A “bulk” value is also indicated that corresponds to the average SEM-EDX measured value in the outermost 4 cm of the studied block.
“Al-normalized” chemical profiles of Si, Fe, Mg, Ca, Na, K, and S in block BM-B-41-1 from section 62. Empty rectangles represent XRF values on powdered samples. Horizontal lines of same color as data set represent average reference value measured in raw material, dark gray areas account for 2× the standard deviation on several measurements done in different laboratories (reference data from Kober and Van Meir Reference Kober, Giroud, Uyama, Hitomi, Hayagane, Kadota, Saito, Okamoto, Aoshima, Osawa, Hadi, Grenèche, Wersin, Svensson, Lundgren, Kaufhold, Dohrmann, Ufer, Torres, Turrero, Sánchez, Garralón, Gómez, Campos, Leal Olloqui, Scott and Madina2017). Horizontal lines of contrasting color represent average “bulk” value in the outermost area of the block (between distance of 180 and 220 mm), light gray areas account for 2× the standard deviation

Chemical profiles of major elements in block BM-B-41-1
The data show no net changes in Si/Al throughout the entire profile relative to the original material. Localized peaks in Si content can be attributed to the presence of large grains of Si-rich phases in the bentonite matrix (e.g. quartz, cristobalite, tridymite, Opal CT). EDX and XRF data are very consistent with each other.
In addition, EDX data indicate no net changes in Mg/Al and Ca/Al relative to the original material. However, fluctuations in Mg and Ca content are less pronounced in the vicinity of the interface (at distance <100 mm, Fig. 4c,d) than in the rest of the block. The XRF data on powdered samples indicate a slight decrease in Mg and Ca towards the interface, but this is within analytical uncertainty.
Regarding K and S contents, data indicate no changes relative to the raw material. A slight decrease was observed by EDX but this remains within the uncertainty of the reference data. The small and constant difference between XRF and EDX data can be attributed to an underestimated SEC factor for these two elements and their lower contents close to or below the quantification limit of EDX. The very small S content (<0.1 wt.%) indicates that the pyrite content in the FEBEX bentonite is also very low. The S peak visible at a distance of ~160 mm is due to the presence of a large gypsum (or anhydrite) grain.
The drop in Na content toward the heater is more pronounced and was observed throughout the entire profile. As found for the K and S contents, the SEC factor may be slightly underestimated, given the difference between EDX and XRF data.
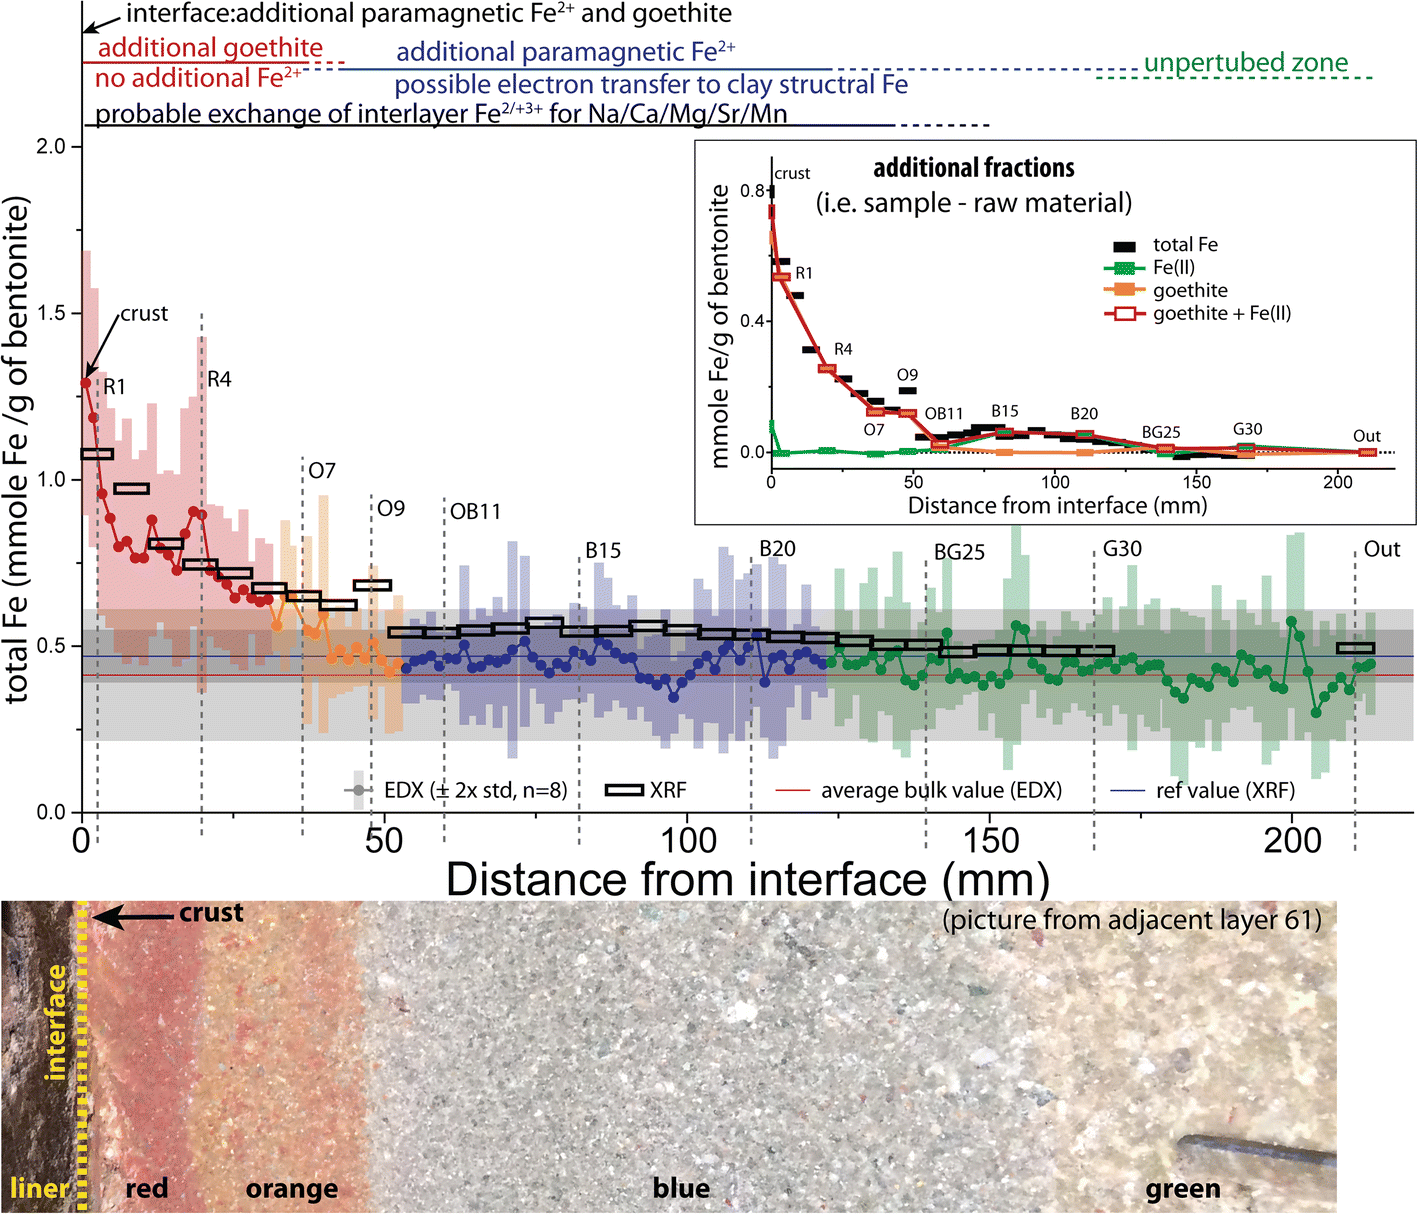
The most obvious changes were observed in the Fe/Al ratios. Data clearly indicate a progressive increase of Fe content moving from ~140 mm from the interface to the interface itself. A very slight decrease in Fe content was observed at a greater distance but it fell within the uncertainty of the reference data. The data, thus, indicated no changes in that area.
Comparison between blocks BM-B-41-1 and BM-B-41-2
Chemical profiles of all the major elements in the visually significantly less impacted block BM-B-41-2 showed no change relative to the original material (Fig. S1). All profiles showed no consistent deviation trend from the reference value.
Accessory Fe phases in the bulk of FEBEX bentonite
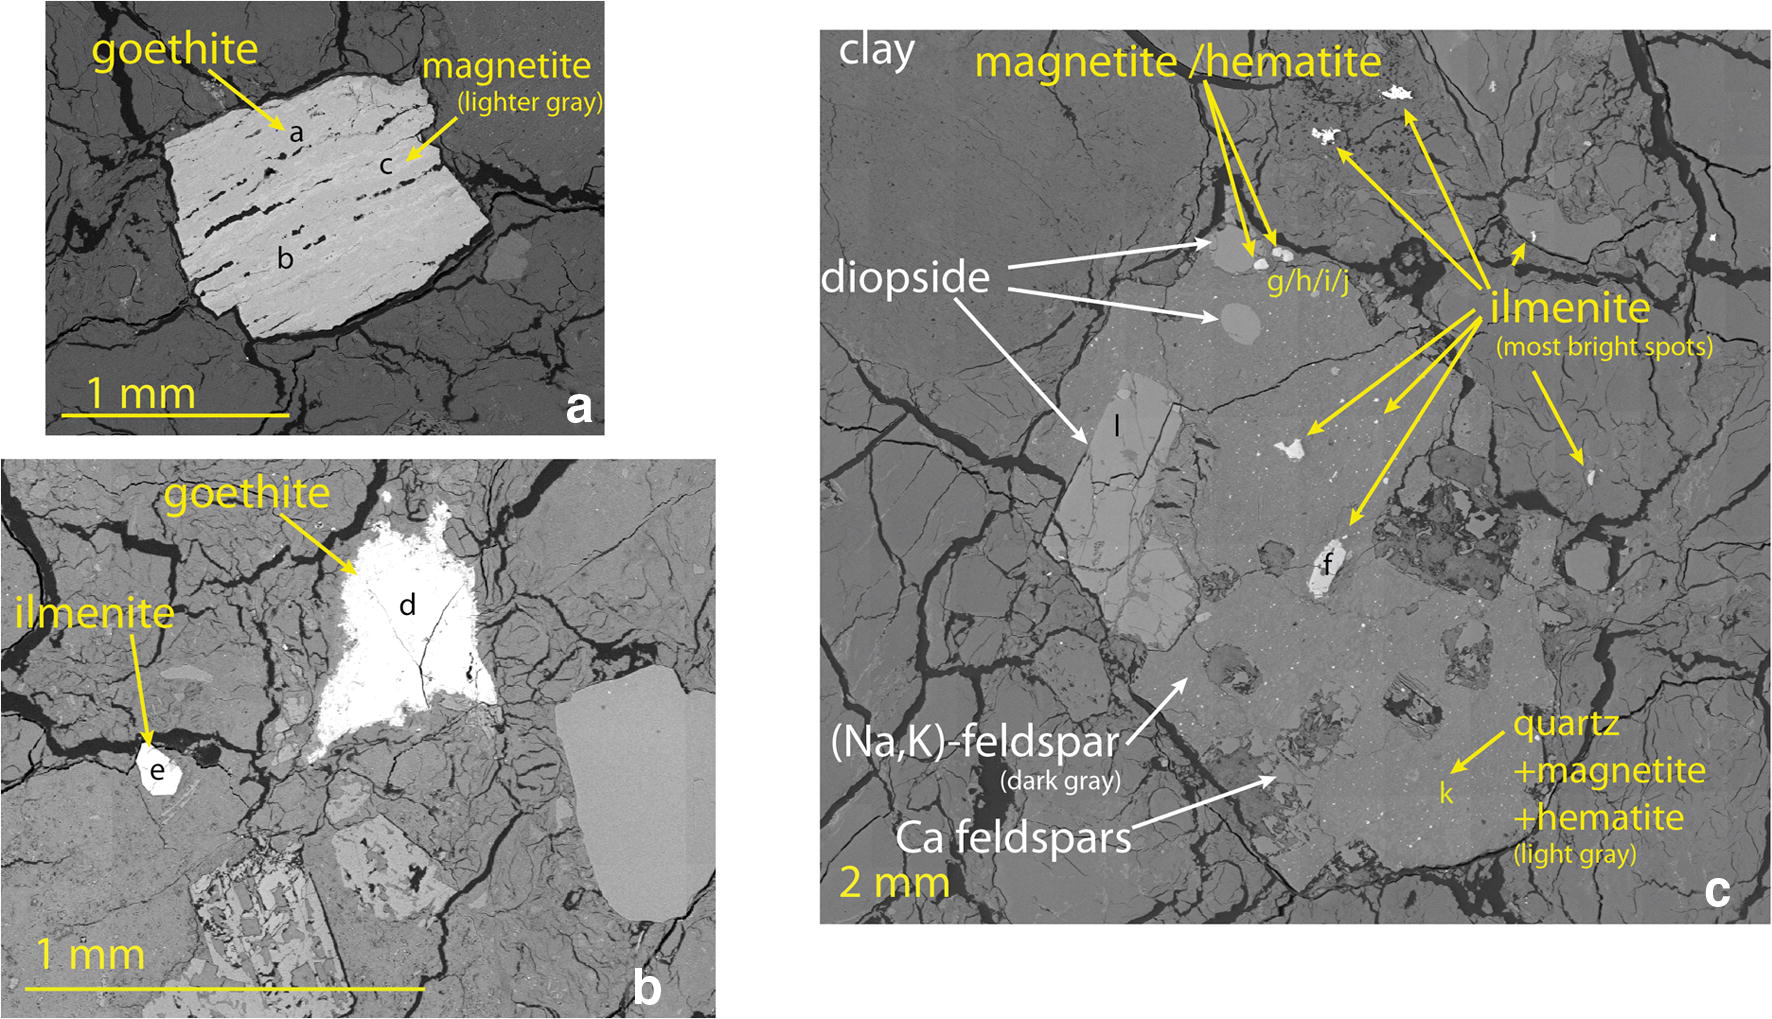
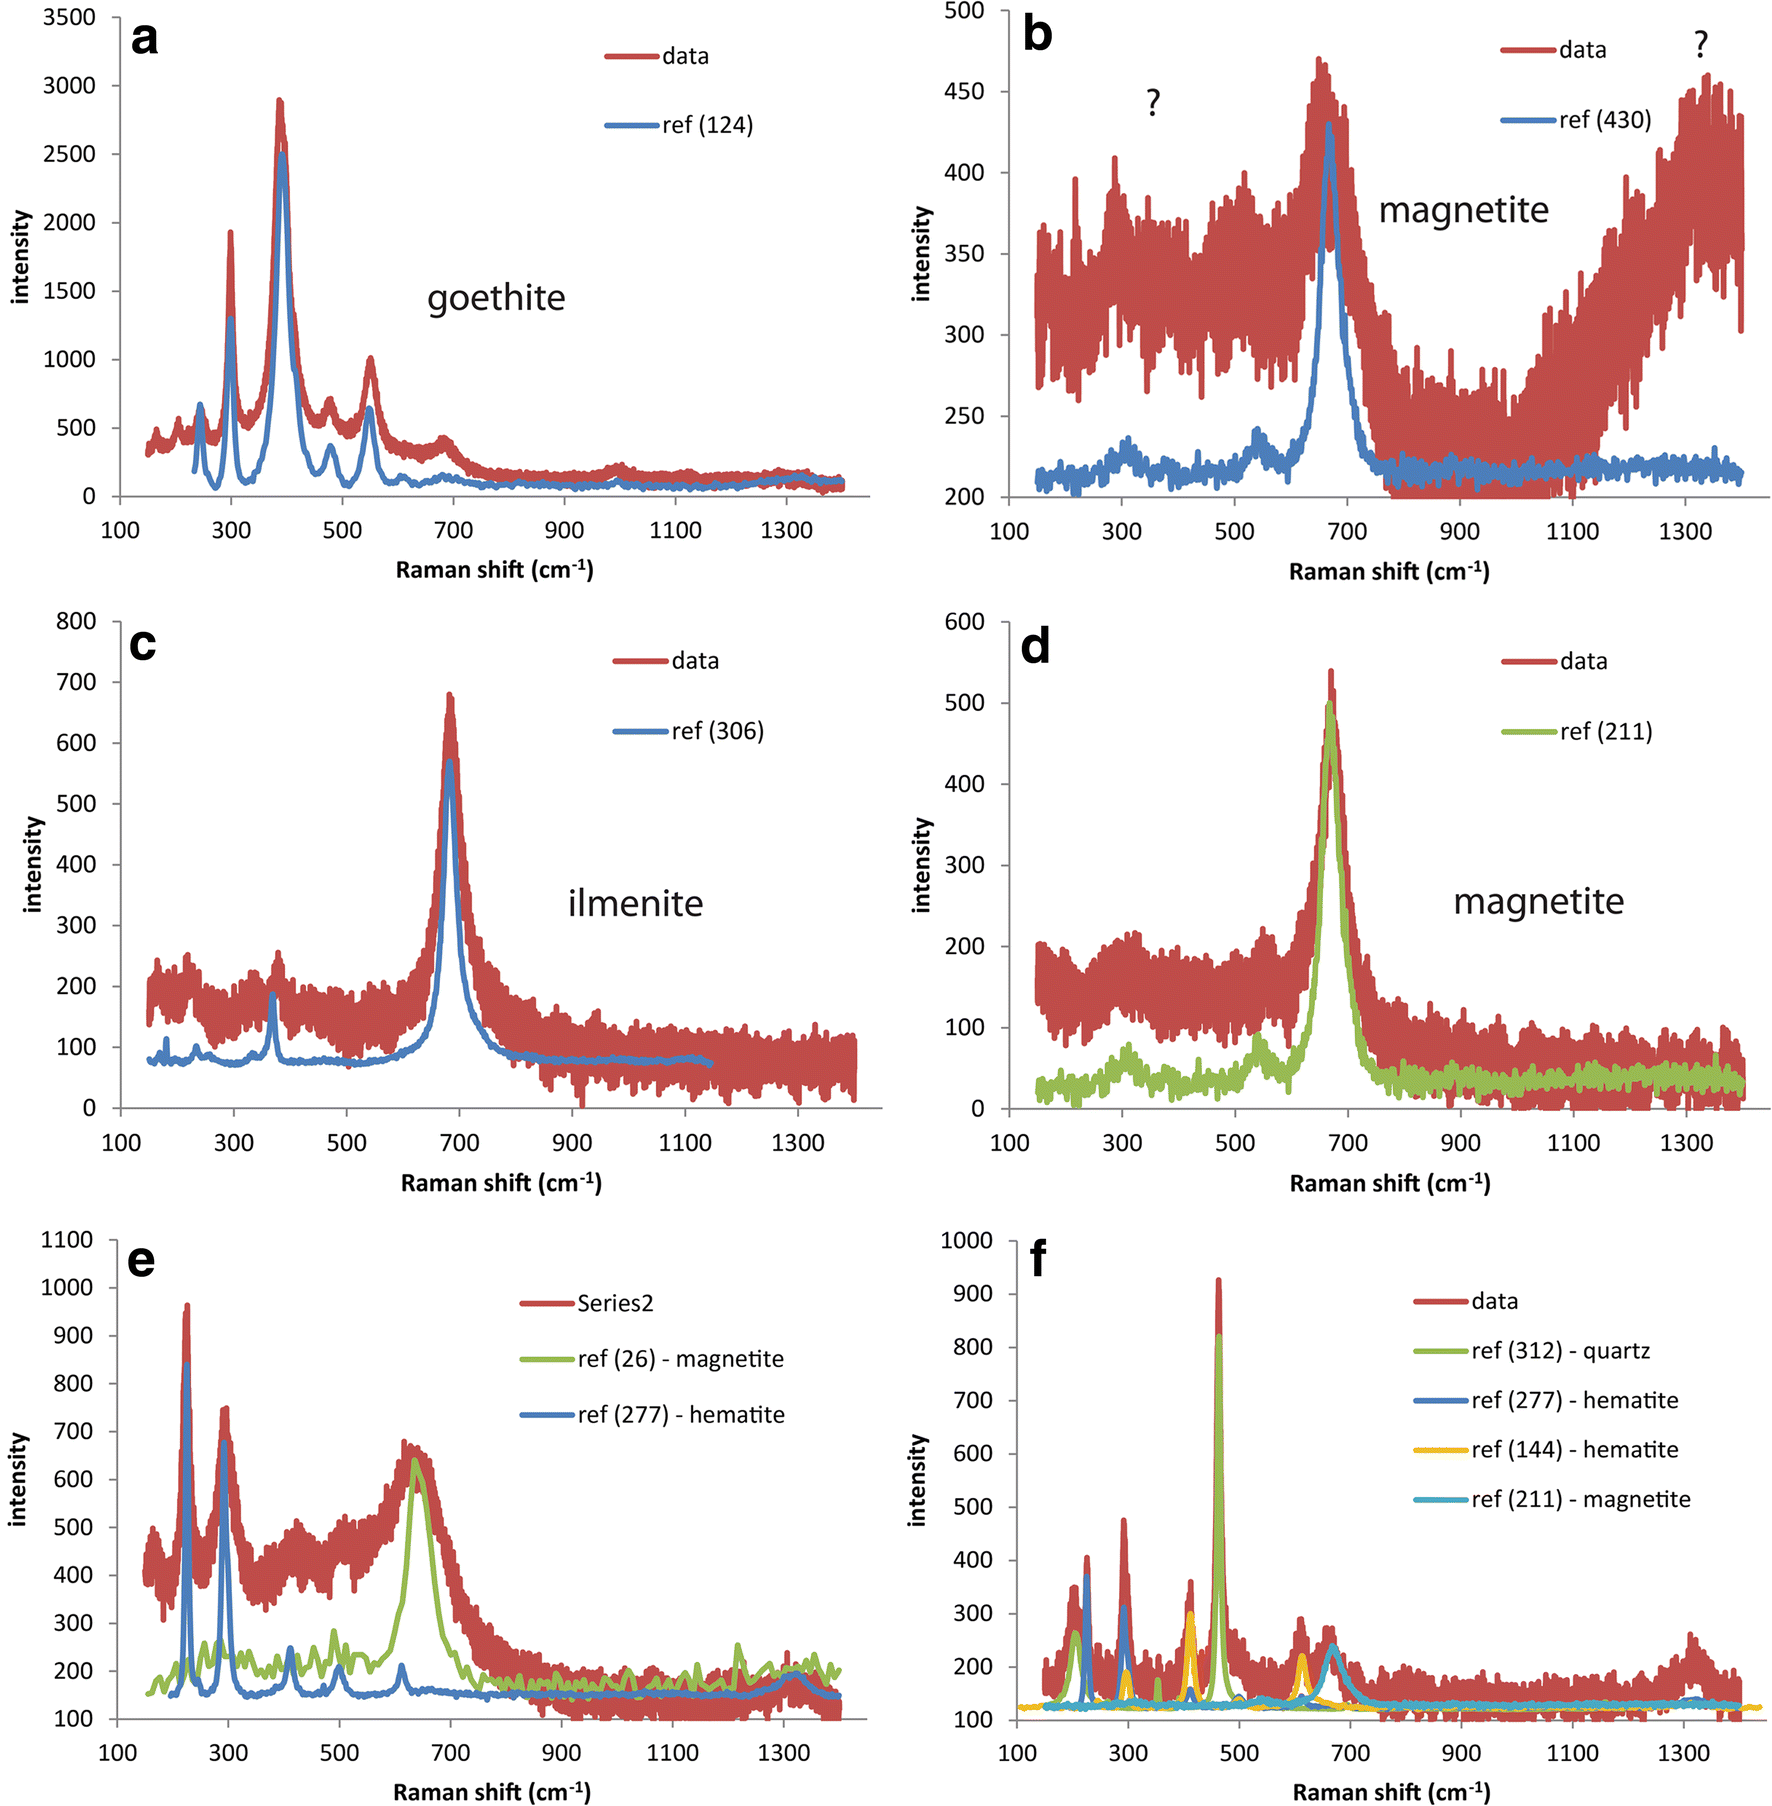
According to a previous characterization on raw FEBEX material (Villar et al. Reference Villar, Fernández, Rivas, Lloret, Daucausse, Montarges-Pelletier, Devineau, Villieras, Hynková, Cechova, Montenegro, Samper, Zheng, Robinet, Muurinen, Weber, Börgesson, Sandén and Verstricht2006), at least 80% of Fe should be associated with clay minerals. Still, a great variety of accessory Fe bearing species can be found. The identification of these species is, however, rare in the literature. Better knowledge is important in order to establish a profile of the “background Fe” present in the bentonite and to understand the changes in Fe content in the vicinity of the interface with the liner. Raman spectroscopy was attempted primarily to identify Fe accessory minerals present in the FEBEX material, occurring as micrometer to millimeter size crystals and which were easy to spot from microscope images. Raman spectroscopy is more difficult to apply for the clay matrix because of high fluorescence levels. Mixing with epoxy resin further complicates such analysis, as the background signal becomes even higher. Various original Fe-rich phases were scattered in the FEBEX matrix. Only a fraction could be discriminated easily and identified by Raman spectroscopy (e.g. Fig. 5).
SEM pictures of some ferruginous minerals found in the FEBEX matrix. Letters indicate spots where Raman spectroscopy was performed (some spectra are shown in Fig. 6)

The main accessory Fe-bearing phase encountered in the FEBEX bentonite is goethite (Fig. 5a,b and Fig. 7a). It can be found as very large grains (from a few micrometers to more than 1 mm, e.g. Fig. 5a,b and Fig. 7a). The eight mapped sectors where the four largest grains were found were not taken into account when establishing the chemical profile of Fe (over a total of 1256 mappings). Magnetite was found commonly in the core of the larger grains (Fig. 5a,c). The second easily identifiable Fe phase is ilmenite which was found in smaller (from a few micrometers to >1 mm) grains.
A notable quantity of accessory Fe species appears to be present as submicronic grains enclosed in other accessory minerals, making them more difficult to discriminate on chemical mappings and SEM images. For instance, large grains of Na-K feldspars intermingled with quartz (Fig. 5c) were found containing medium (few μm) to large (100 μm) grains of either ilmenite or Fe oxides. These Fe oxides (referred to as “hemato-magnetite” in Fig. 5c) display a core of magnetite (Fig. 6g) and a shell of low crystalline hematite-magnetite mixture (Fig. 6j). The quartz grain studied (Fig. 5c) also contains a significant quantity of Fe occurring as magnetite and various forms of more crystalline hematite (Fig. 6k).
Raman spectra collected at spots indicated in Fig. 5

Fe accumulation at the interface
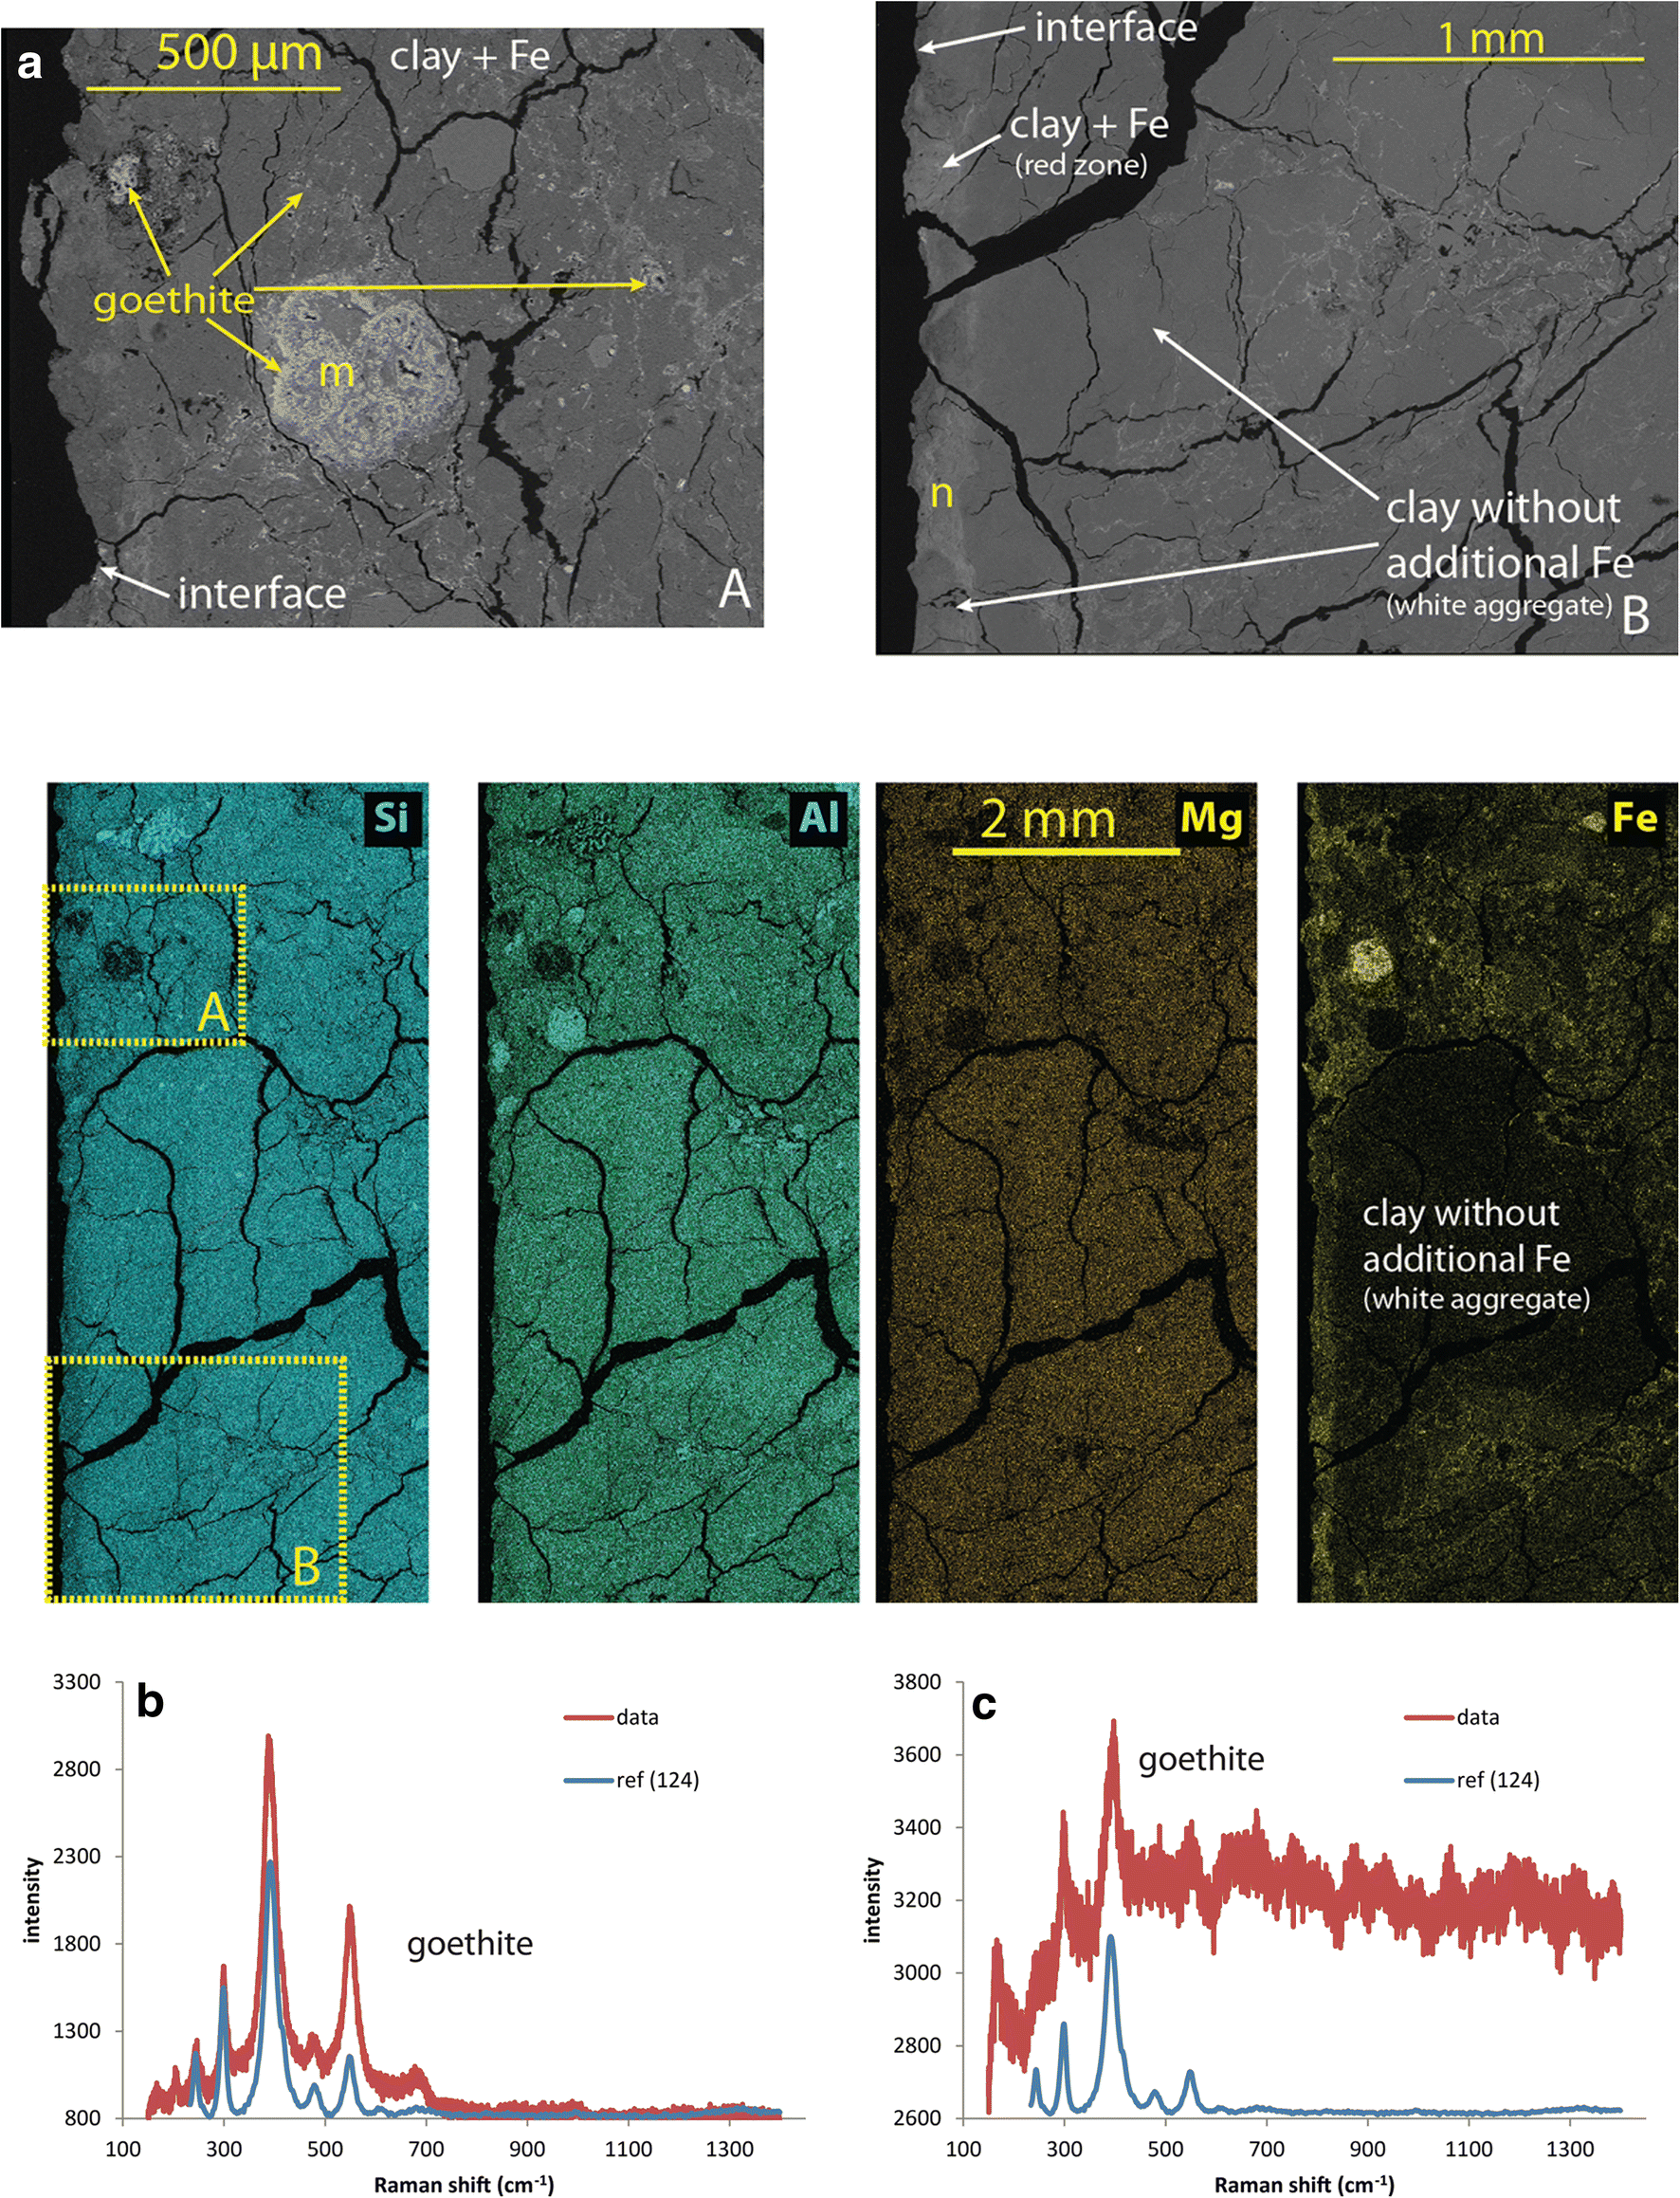
The largest goethite crystals observed in the vicinity of the interface with the liner (e.g. Fig. 7a, the rim of the block is seen at the left side of the picture) can be inferred to be part of the original accessory phases, based on their large size and on texture (the mapped sector containing these grains was omitted when establishing the chemical profile of Fe displayed in Fig. 4 and Fig. S1). Other bright spots (or lines) were observed only in the red zone and, especially, close to the interface. These features point to areas where additional Fe species from the corroding liner tend to accumulate. The few clear Raman spectra collected in this zone indicate that the main Fe-bearing species is goethite (Fig. 7n). Data also show a clear contrast between the Fe-enriched clayey part of the bentonite and zones where no net Fe accumulation was observed (Fig. 7b). A clear contrast can also be observed by eye as the Fe-enriched clay appears red, while the other zone free of additional Fe appears as unaffected white spots (see block 1 of sample BM-B-41-1 in Figs. 2 and 3). The strong red coloration of the bentonite correlates well with the area of goethite accumulation. The white zones are in fact mainly composed of smectite and amorphous silica (further presented in next section).
(Upper) SEM pictures collected close to the interface between the FEBEX bentonite block and the steel liner. Letters indicate spots where Raman spectroscopy was performed (spectra shown in the bottom). (Middle) EDX mappings for the major elements in the same area. Positions of the two electronic pictures are indicated on the Si map. (Lower) Raman spectra collected at spots indicated in SEM picture

Powdered samples
XRD analysis of colored fractions collected from raw material
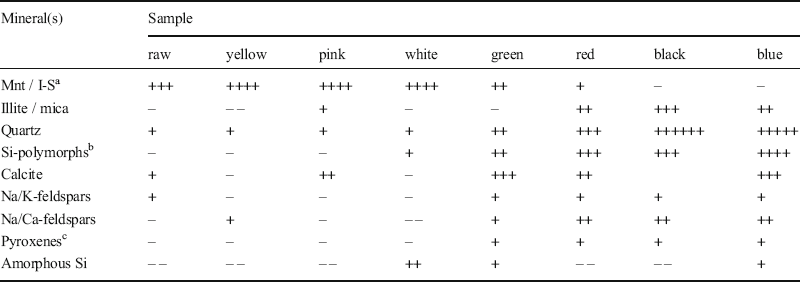
Data collected on seven different colored aggregates isolated from raw FEBEX bentonite (Fig. 3) were compared to the bulk raw material (Fig. S2). Some notable features are outlined. A list of identified species and their relative contribution, compared to the raw material, is also reported (Table 1).
Minerals identified in the different samples extracted from the pristine FEBEX material (total raw material and colored aggregates) using XRD

a montmorillonite or interstratified illite-smectite
b include cristobalite, tridymite, and opal CT
c include ideal pyroxene, pigeonite, and diopside
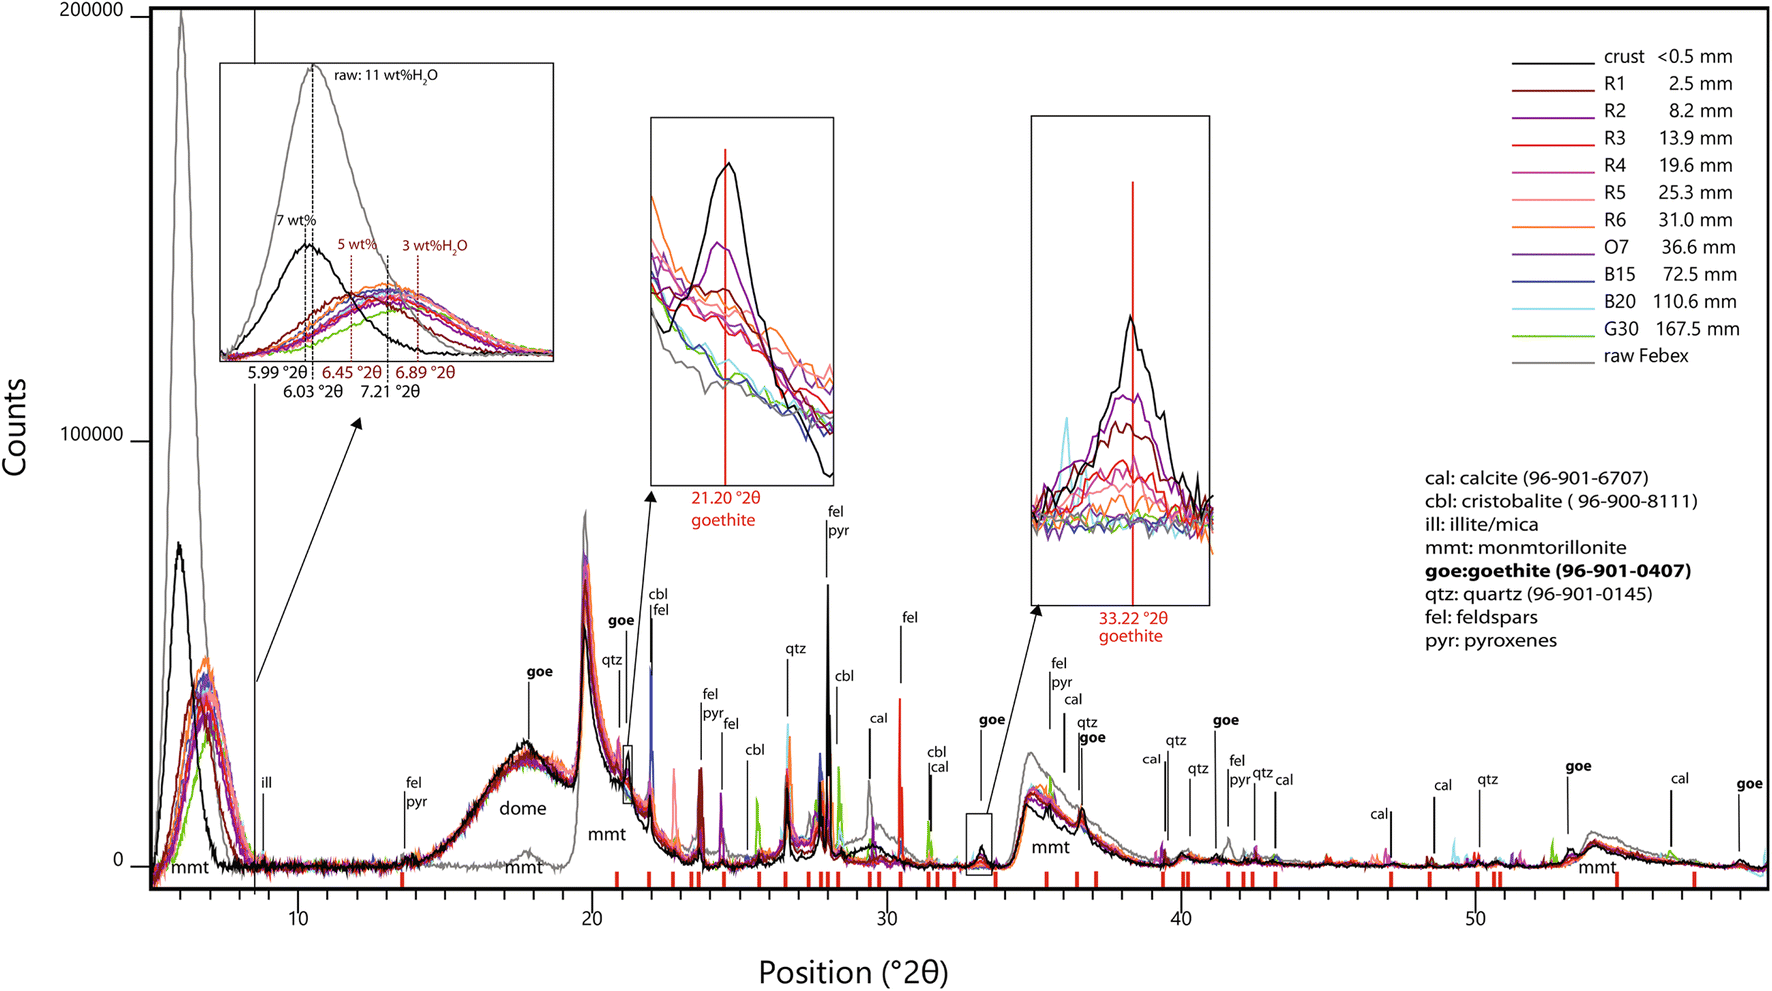
The line near 6–7°2θ corresponds to the 001 basal reflection of the smectite(s) present in FEBEX bentonite. In standard conditions, i.e. 30–50% RH, 25°C, sodic montmorillonites display a basal spacing of ~12 Å while calcic ones display a basal spacing of ~15 Å because of the presence of one supplementary water layer in the interlayer (Fernandez et al. Reference Fernandez, Baeyens, Bradbury and Rivas2004; Ayari et al. Reference Ayari, Srasra and Trabelsi-Ayadi2007). Mg exchanged montmorillonites display a slightly smaller (14.7 Å) basal spacing than that of Ca. These values are, however, valid in wet conditions and would, in fact, be lower in drier conditions (as the thickness of the water layer decreases).
Raw FEBEX bentonite displays an average basal spacing of 14.6 Å. This is consistent with the exchangeable population in the pristine material (Villar et al. Reference Villar, Fernández, Rivas, Lloret, Daucausse, Montarges-Pelletier, Devineau, Villieras, Hynková, Cechova, Montenegro, Samper, Zheng, Robinet, Muurinen, Weber, Börgesson, Sandén and Verstricht2006), dominated by Ca (37–43 meqg−1) and Mg (31–32 meq g−1), and containing less Na (24–27 meq g−1) and K (2–3 meq g−1).The various colored aggregates clearly display a different mineralogical composition. Light colored aggregates are richer in smectite than the bulk raw material (yellow > pink > white), while the dark colored aggregates are in fact much lower in smectite (green > red > black > blue). A small shift was observed between the positions of the 001 line, accounting for a basal spacing varying between 14.4 Å in dark colored aggregates and 15.0 Å in light colored ones. This may be explained by the slight variation in the composition and/or structure of the clay interlayer. Villar et al. (Reference Villar, Fernández, Rivas, Lloret, Daucausse, Montarges-Pelletier, Devineau, Villieras, Hynková, Cechova, Montenegro, Samper, Zheng, Robinet, Muurinen, Weber, Börgesson, Sandén and Verstricht2006) previously observed that the majority of the bulk material (>90%) consists of illite-smectite mixed layers (10–15% of illite). No attempt to decipher the presence of interstratification was made in the present work. The present data, however, show that the main clay mineral is montmorillonite. The lower clay content of dark colored aggregates in fact correlates well with their greater content of quartz (green < red < blue < black) and silica polymorphs (cristobalite, tridymite, Opal CT; red ~ black << blue). This content is also consistent with the fact that these aggregates are notably harder than the light colored ones.
Another significant difference was seen regarding the accessory minerals, indicated by the reflections at slightly higher angles (8.77–8.88°2θ). These reflections are due to the basal reflections of certain clay minerals that display smaller d spacings (9.9–10.1 Å) than those of smectites due to the absence of interlayer water. This is explained by the presence of micas, or more probably illite, as a better match with reference patterns is often found for illite. The presence of a range of micas (biotite, sericite, muscovite) was noted in a previous characterization of the FEBEX bentonite (Villar et al. Reference Villar, Fernández, Rivas, Lloret, Daucausse, Montarges-Pelletier, Devineau, Villieras, Hynková, Cechova, Montenegro, Samper, Zheng, Robinet, Muurinen, Weber, Börgesson, Sandén and Verstricht2006). The present results indicate that such phases (mica and/or discrete illite aggregates) are more likely to be found in the dark colored aggregates (red ≈ blue << black), which are in fact poor in smectites.
The sample made of white aggregates stands out from the sample sets. On the one hand, a larger amount of clay than the bulk raw material was observed, as was the case with the other light colored samples. On the other hand, this sample also contained larger amounts of silica polymorphs (cristobalite, tridymite, opal CT) than the dark colored samples. In addition, the higher counts observed in the 20–23°2θ region accounted for the presence of amorphous silica.
Domed XRD analysis of samples from block BM-B-41-1
Data collected on 11 domed powdered samples from block BM-B-41-1 were compared and the diffractogram of the undomed raw material is displayed as a reference (Fig. 8). It must be emphasized that the raw material was analyzed undomed and as received (i.e. in standard conditions). The powdered samples from block BM-B-41-1 were analyzed after anaerobic preparation including freeze-drying followed by crushing and storing in rather dry conditions. These samples were analyzed under the dome, thus in slightly drier conditions compared to the undomed sample.
Diffractograms of a series of powdered samples from block BM-B-41-1 (domed) and of the raw material (undomed)

Reacted bentonite samples (excluding the crust) exhibited smaller basal spacing than the raw material, ranging from 12.2 (G30) to 13.7 (R2) Å, with most samples displaying a similar value of 12.8 Å. The crust sample displayed a larger value of 14.8 Å, which was closer to the original value. This trend is consistent with the slight variation in the water content of the samples determined upon preparation for XRF measurements (drying at 105°C), ranging from 3 wt.% in G30 to 5 wt.% in R2, with most of the samples containing ~4 wt.%. The crust sample contained a slightly larger amount of water (7 wt.%). The raw sample was more hydrated (11 wt.%). Besides, the general observed drop in overall signal intensity was due to the presence of the dome. On the one hand, these results show no clear differences in basal spacing between the various samples retrieved from the FEBEX experiment (i.e. same spacing throughout the entire profile). On the other hand, a slight general decrease of the basal spacing was observed at the end of the experiment (compared to the raw material).
Besides slight changes in basal spacing and features related to the dome (the mount located around 17–18°2θ and the general drop in intensity), a number of differences were seen between the various samples above positions of 20°2θ. A series of reflections was observed randomly in the retrieved samples, and were for a majority observed in the raw sample as well (indicated by red marks on the x axis Fig. 8). These reflections can be attributed to single reflections from original accessory minerals (due to preferential orientation): calcite, silica polymorphs (quartz, cristobalite, tridymite, opal CT), illite, micas, pyroxenes, or feldspars.
A group of seven reflections was not observed in the raw material but only in a group of samples from the red area and from the crust. The positions of the reflections correspond to goethite, which proves that goethite accumulated in bentonite at distances within 40 mm of the interface. The goethite amount decreases progressively with increasing distance from the interface.
57Fe Mössbauer spectrometry (combined with XRF)
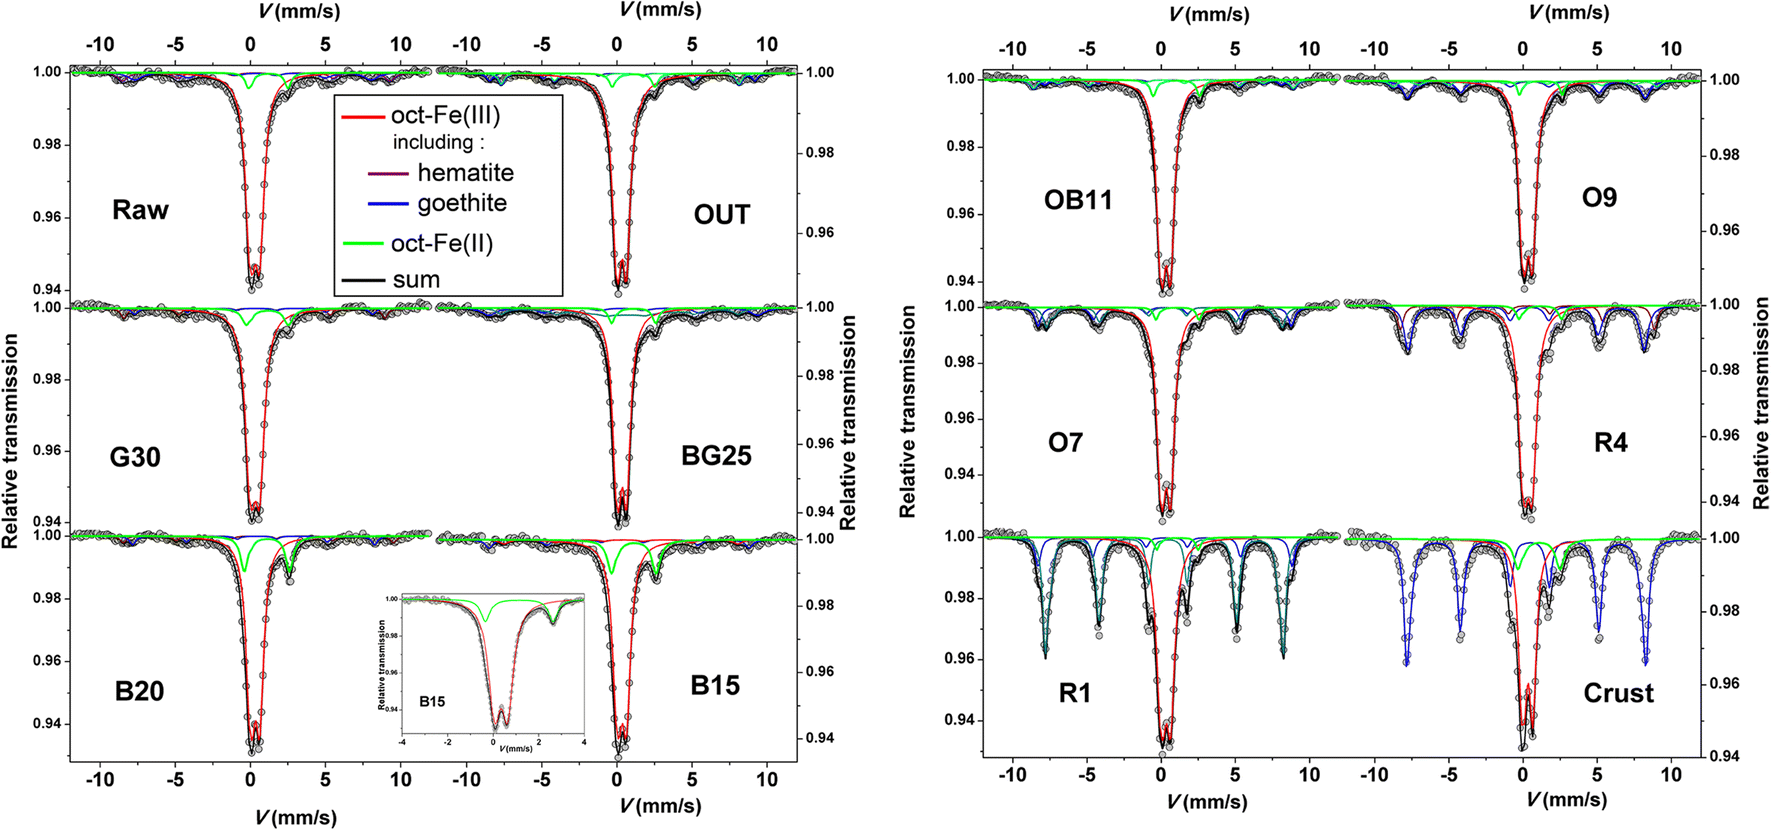
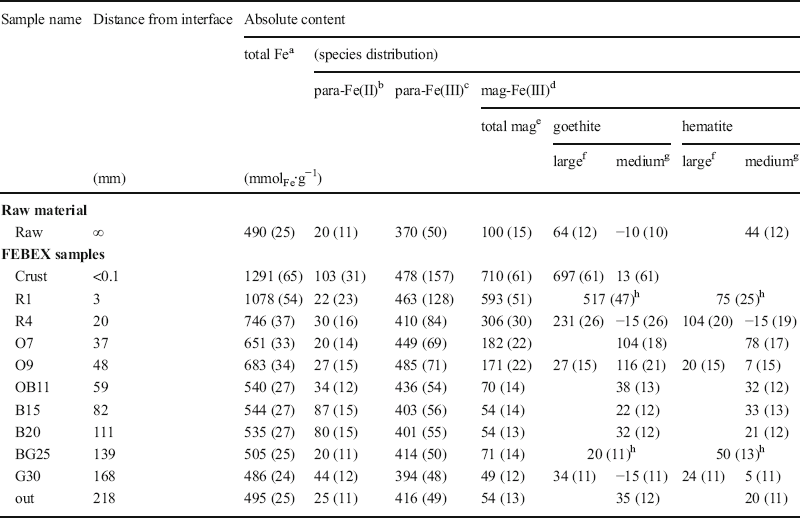
Relative areas of the Mössbauer contributions (Figs. 9 and S4, Tables S3 and S4) are proportional to their relative amounts (i.e. correspond to fractions of total Fe). The Mössbauer data are, thus, combined with XRF data (absolute content of Fe) to express these contributions in mmol of Fe per kilogram of dry sample (mmolFe∙kg−1, Table 2). The contents of total Fe, para-Fe(II), and of mag-Fe(III) (magnetically ordered at 77 K, i.e. composed of medium- to large-sized goethite or hematite) are reported. The content of para-Fe(III) corresponds to the difference between total Fe and the sum of para-Fe(II) and mag-Fe(III). It must be emphasized that para-Fe(II) was the only observed Fe(II) species in the studied samples, and that all Fe was found in octahedral coordination.

Fe distribution inferred by combining XRF (total Fe) and Mössbauer data (species distribution). Values in parentheses represent uncertainties

a Measured by XRF, except for “crust” sample for which EDX data is used
b Paramagnetic Fe(II) (= total Fe(II) content)
c Paramagnetic Fe(III) (= total Fe – paramagnetic Fe(II) – magnetically ordered Fe(III))
d Magnetically ordered Fe(III)
e Fe(III) in species magnetically ordered at 77 K (i.e. include medium- and large-sized species)
f Fe(III) in species magnetically ordered at 300 K
g Difference between contents at 77 K and at 300 K
h Room temperature data were not collected, no size distinction is done
Raw material
Data collected on the raw material indicated that ~20% of Fe (i.e. 100 mmolFe kg−1) is present in magnetically ordered goethite and superparamagnetic hematite (with a goethite:hematite ratio of 1:1, Table 2). Magnetite may be present, but in much lower amounts (<2% of total Fe). This is consistent with observations from SEM-EDX and Raman investigations indicating that the most abundant Fe accessory phase is large-grained goethite (i.e. magnetically ordered at 300 K), but that considerable amounts of smaller sized hematite grains (thus, magnetically ordered only at low temperature) are also present. The main pool of Fe (75%, i.e. 370 mmolFe∙kg−1) is paramagnetic octahedral Fe3+ and can be attributed to the main phase of the bentonite, i.e. smectite. A small portion (5%) of Fe is present as octahedral Fe2+. It can be attributed mainly to secondary clay minerals (illites and or micas), other silicates (pyroxenes), or ilmenite. Ilmenite would, thus, be at best the third most abundant accessory mineral (i.e. at most 20 mmolFe∙kg−1) after goethite and hematite.
FEBEX samples
Data collected on the three outermost samples (BG25, G30, and 'Out', at distances greater than 139 mm from the interface) are fairly similar, indicating a total Fe content similar to the raw material (Table 2). The data, however, indicated a smaller content of magnetically ordered and superparamagnetic species (50–70 mmolFe∙kg−1) compared to the raw material, consisting of goethite and hematite (with a goethite:hematite ratio varying between 2:1 and 1:2). The proportion of paramagnetic Fe was, thus, generally greater than in the raw sample. The content of para-Fe(II) was very similar to that of the raw material (20–25 mmolFe∙kg−1), except for sample BG25 which displayed a larger content (44 mmolFe∙kg−1). These slight differences between this series of three samples and the raw material are attributed to natural variability within this bentonite material (varying goethite-hematite distribution with regard to content and morphology).
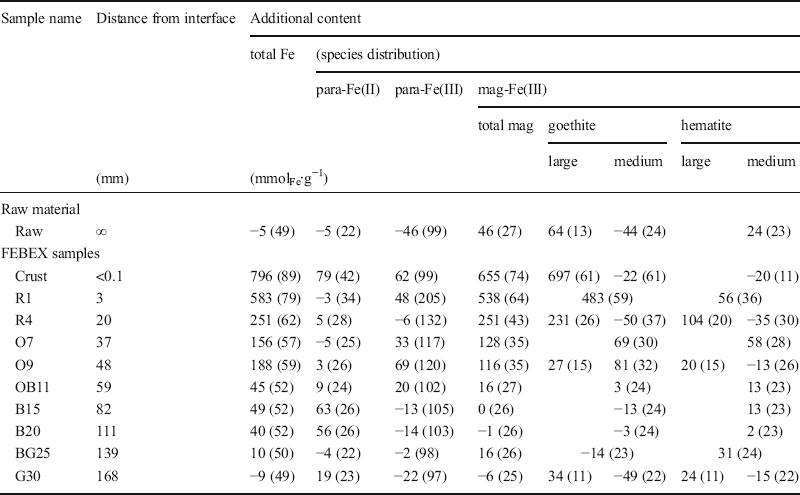
The raw sample was selected from a separate pristine block, and its composition may, thus, slightly vary from the BM-B-41-1 block. Because the block studied should contain a more homogeneous composition, and because the outermost sample (‘Out’ sample, at a distance of 218 mm from the interface) was assumed to have been located far enough from the interaction zone (no color change, and total Fe content very similar to that of the raw material), this sample was, thus, considered as the pristine reference sample to assess changes in Fe speciation resulting from the corroding heater. Mössbauer data on Fe speciation from this sample were employed to calculate the additional Fe amounts in the other ones (Table 3). These additional contents were considered as representing the pool of Fe originating from the corroded liner. Results indicated no change in samples G30 and BG25, regarding the outermost samples. The larger content of para-Fe(II) in sample G30 was attributed to a slightly larger content of Fe2+-bearing accessory minerals from the initial matrix (illites, micas and/or ilmenite). The green-gray samples (‘Out’, G30, and BG25) were, thus, not impacted by corrosion of the steel liner.
Additional Fe content relative to the pristine material, taking data from the outermost sample (218 mm) as a reference (using data of Table 2). Values in parentheses represent uncertainties

Data collected on the blue samples B20 (111 mm from the interface) and B15 (82 mm) were remarkably similar. The data indicated a content of magnetically ordered species very similar to the outermost samples, also with a goethite:hematite ratio of 1:1. The data also indicated an increase in the amount of para-Fe(II) of 60 mmolFe∙kg−1, which is consistent with the observed increase in total Fe of 40–50 mmolFe∙kg−1. In this case, the observed changes in Fe speciation and content (along with the blue color) are explained by the presence of additional Fe2+ from the corroding heater, which can be attributed to ferrous hydroxide, sorbed Fe2+, and/or sorbed Fe3+ following sorption of Fe2+ and reduction of clay structural Fe3+ (Gehin et al. Reference Gehin, Greneche, Tournassat, Brendle, Rancourt and Charlet2007; Soltermann et al. Reference Soltermann, Fernandes, Baeyens, Dahn, Miehe-Brendle, Wehrli and Bradbury2013; Latta et al. Reference Latta, Neumann, Premaratne and Scherer2017).
Data collected from sample OB11 (59 mm from the interface, at the transition between the orange and blue zones) indicated an increase in total Fe of 45 mmolFe∙kg−1 relative to the outermost samples, similar to that in previous samples B15 and B20. In this case, however, this increase correlated with the additional presence of 20 mmolFe∙kg−1 para-Fe(III) (Table 3) and 16 mmolFe∙kg−1 mag-Fe(III) (in this case mainly goethite), and to the additional presence of 9 mmolFe∙kg−1 para-Fe(II).
Samples O9, O7, R4, and R1 (originating from the orange and red area closer to the interface) differed even more from the three outermost samples, and displayed the same trend. The Mössbauer data indicated no net change in Fe2+ content (relative to the ‘Out’ reference sample), but a significantly higher content in magnetic oxides, mainly present as large-grained goethite, and to a lower extent as hematite and para Fe(III) (Table 3). In any case, the additional fraction of goethite is consistent with the additional content of total Fe inferred from XRF data. This is also consistent with XRD data indicating the notable presence of goethite in this series of samples (from the interface to sample O7, Fig. 8), and consistent with the orange-red coloration of the bentonite.
Finally, the crust sample displayed an even larger increase in total Fe content (220% increase). EDX data indicated an increase of at least 796 mmolFe∙kg−1. This increase may be even higher because the value inferred above was averaged over the first 1.4 mm away from the contact with the steel liner (i.e. the first mapped row in the profile), while the crust sample originates from the first few hundred micrometers away from the steel liner. Mössbauer data indicated a significantly larger content of magnetically ordered species (655 mmolFe∙kg−1, mainly large-sized goethite) and also a notably larger content of para Fe(II) (80 mmolFe∙kg−1 increase) and para-Fe(III) (62 mmolFe∙kg−1 increase) than the outermost samples. This is again consistent with XRD data indicating a significant amount of goethite in this sample. Most of the Fe (>70%) originates from the steel liner and consists mainly of large goethite grains (>25 nm). The small amounts of additional paramagnetic Fe3+ are also attributed to nano-goethite (<5 nm). The presence of other types of Fe3+-bearing phases, such as lepidocrocite or ferrihydrite, which exhibit magnetic ordering below 77 K, cannot, however, be ruled out. The minor occurrence of hydrous Fe silicates cannot be ruled out either. The small amounts of additional paramagnetic Fe2+ might reflect similar species as occur in the green and blue zones, or also siderite. The presence of magnetite cannot be excluded, but it would be restricted to nanometer-sized paramagnetic particles, and is, thus, less likely (Murad and Cashion Reference Murad and Cashion2004).
Sample OB11 reflects a transient position between the blue and orange-red zones. Its additional Fe is present both as Fe3+ (mainly goethite) and Fe2+.
Discussion
The study of Fe speciation in the original FEBEX matrix revealed that Fe is mainly (75%) present as clay octahedral Fe3+. The other important forms consist of magnetically ordered goethite (up to 13%) and superparamagnetic oxides (mainly hematite, <9%). A small portion (5%) of paramagnetic Fe2+ is present initially, presumably in illite, mica minerals, ilmenite, or pyroxenes. Smectite is the main component of the bentonite (at least 75%, interstratified I-S might in fact be present), and is more concentrated in the light colored parts of the matrix.
Post mortem analyses of the most-impacted block BM-B-41-1 indicate that the main change noted at the end of the FEBEX in situ test with regard to Fe is related to the diffusion of Fe into the bentonite from the steel liner.
The XRF profile of Fe as a function of distance from the interface with the liner gave clear evidence that a correlation exists between the coloration of the bentonite, the amount of additional Fe, and the nature of the Fe species (Fig. 10). Although Fe accumulation is more obvious in the red-orange zone (first 45 mm from the steel liner contact), the data show that Fe diffused deeper into the bentonite, i.e. throughout the entire blue area. This is also supported by the slight difference between the EDX data on a large portion of the profile and the average bulk value in the outermost and, thus, less perturbed zone (by Fe diffusion) of the block (represented by the red line in Fig. 10). The value inferred from the EDX data is slightly less than the average XRF reference value (Kober and Van Meir Reference Kober, Giroud, Uyama, Hitomi, Hayagane, Kadota, Saito, Okamoto, Aoshima, Osawa, Hadi, Grenèche, Wersin, Svensson, Lundgren, Kaufhold, Dohrmann, Ufer, Torres, Turrero, Sánchez, Garralón, Gómez, Campos, Leal Olloqui, Scott and Madina2017) but still falls within the error. The XRF data are in fact more consistent with the reference values, and the small differences observed between both Fe profiles indicate that the EDX data may underestimate slightly the true Fe content due to systematic errors in the EDX quantification.
Chemical profile of Fe perpendicular to the interface (here normalized by the Al atomic proportions) in block BM-B-41-1. Al normalized data were converted to mmol of Fe per gram of bentonite, using the weight content of Al in the original material (22.55 wt.% Kober and Van Meir Reference Kober, Giroud, Uyama, Hitomi, Hayagane, Kadota, Saito, Okamoto, Aoshima, Osawa, Hadi, Grenèche, Wersin, Svensson, Lundgren, Kaufhold, Dohrmann, Ufer, Torres, Turrero, Sánchez, Garralón, Gómez, Campos, Leal Olloqui, Scott and Madina2017) and a bulk dry density of 1.6 g∙cm−3. The colors account for the color of the sampled powder. The blue line represents the average reference value in raw material, and the dark gray rectangle accounts for twice the standard deviation (Kober and Van Meir Reference Kober, Giroud, Uyama, Hitomi, Hayagane, Kadota, Saito, Okamoto, Aoshima, Osawa, Hadi, Grenèche, Wersin, Svensson, Lundgren, Kaufhold, Dohrmann, Ufer, Torres, Turrero, Sánchez, Garralón, Gómez, Campos, Leal Olloqui, Scott and Madina2017). The horizontal red line represents the average value in the outermost zone of the block (at distances between 180 and 220 mm), and the light gray rectangle accounts for twice the standard deviation. Vertical gray lines indicate the series of samples analyzed by Mössbauer spectrometry and XRD. The picture shows a bentonite block at the contact with the liner in adjacent layer 61 (chosen for its better photographic resolution); the extents of the various colored halos vary slightly (by a few cm) from those in the block studied. The insert displays a chemical profile of “excess” portions (i.e. originating from the steel liner) of Fe(II), goethite, and total Fe as determined from XRF and Mössbauer data

Impact on bentonite chemistry
Although clay (smectite or illite-smectite) makes up >90% of the material, the granulometry of the FEBEX bentonite is quite heterogeneous, representing a large range from micrometer- to millimeter-sized aggregates of contrasting colors, scattered in a pale gray clay matrix. Dark-colored aggregates consist mostly of accessory minerals (silica polymorphs (quartz, cristobalite, opal CT), feldspar, pyroxene, olivine, oxides, carbonates, volcanic glass, etc.); while light-colored ones (white, yellow, and pink) consist mostly of smectite. Chemical mappings show that Fe has been accumulated in the clay matrix at the boundary with the accessory minerals, but only in a portion of the clay-rich aggregates. Fe did not diffuse into the white aggregates. These white aggregates contrast clearly with the other light-colored ones because of their notable amorphous silica content, as indicated by XRD data on the powdered sample (Fig. 8 and Table 1). These aggregates might in fact consist of clay aggregates coated by a layer of amorphous silica which would deter Fe2+ from diffusing in.
Although Fe is expected to diffuse into the bentonite as Fe2+ (Fe3+ being poorly soluble under the conditions of the experiment, i.e. pH of the bentonite medium >6), the data only indicate the presence of additional Fe2+ (in excess of the bentonite background level) in the crust (the first hundreds of micrometers) or much further away in the blue and green zone (at least at distances >48 mm). All the Fe accumulated in the red and orange zones is present mainly as goethite and hematite. The additional Fe found in the crust is also mainly as goethite. A small portion (<10%) of additional Fe found in the most enriched zone (crust and red zone) is paramagnetic and could not be identified unambiguously. In that case, additional Fe3+ may be present in another type of (oxyhydr)oxide (lepidocrocite or ferrihydrite) or in hydrous Fe silicates. The identity of paramagnetic Fe2+-bearing species in the crust sample is still difficult to determine, although it could be siderite, magnetite, ferrous hydroxide, green rust, sorbed Fe2+, or reduced structural Fe (in the reduced clay). In the blue zone, Mössbauer data clearly only indicate the presence of paramagnetic Fe2+ in excess of the bentonite background level, with no net changes in Fe3+ content. Two processes can explain such a change in Fe redox speciation. Either Fe2+ is sorbed without electron transfer or an associated redox reaction with structural Fe3+ occurs, where structural Fe3+ is reduced and sorbed Fe2+ is oxidized. This would in fact result in no apparent net change in the amount of paramagnetic Fe3+. Eventual release of the sorbed Fe3+ would likely be followed by direct in situ precipitation of nanometer-sized goethite, and would have no impact on the amount of paramagnetic Fe3+. The presence of green rust, magnetite, or other mixed valence compounds can be ruled out because of the absence of additional Fe3+. However, the presence of Fe2+ as a separate phase such as siderite or ferrous hydroxide cannot be ruled out. The exact conditions and time sequence of the accumulation of Fe in the block BM-B-41-1 have not yet been determined. The reason for this asymmetric Fe diffusion front is explained by a clear contrast in the water saturation of the bentonite (Villar et al. Reference Villar, Fernández, Romero, Dueck, Cuevas, Plötze, Kaufhold, Dohrmann, Iglesias, Sakaki, Zheng, Kawamoto and Kober2017).
A phenomenological description of the Fe diffusion mechanism
The proposed mechanism is based on the interplay between the Fe released by the corrosion process of steel (diffusing Fe), the Fe initially present in the bentonite material (background Fe), and the varying redox conditions.
The corrosion of steel in Fe-bentonite in situ experiments is believed to proceed in two steps. First, an aerobic step in which Fe3+ (and thus corrosion products) is generated at the surface of steel, and second, an anaerobic step (once O2 has been depleted from the system) where Fe2+ is generated (Kaufhold et al. Reference Kaufhold, Hassel, Sanders and Dohrmann2015). This pathway is also confirmed by the analysis of the corrosion layer of the steel liner in the FEBEX experiment. The formation of goethite, hematite, and akaganeite as well as magnetite and siderite was identified (Madina Reference Madina2016; Leal Olloqui and Scott Reference Leal Olloqui, Scott, Wersin and Kober2017). Furthermore, Uyama et al. (Reference Uyama, Hitomi, Hayagane, Kadota, Saito, Okamoto, Aoshima, Osawa, Wersin and Kober2017) observed goethite and hematite partly replacing the thin magnetite layer initially present on the steel surface. Similar observations on the corrosion layer have been made in other in situ tests (Svensson and Hansen Reference Svensson and Hansen2013; Wersin et al. Reference Wersin, Jenni and Mäder2015).
Fe2+ diffusion into bentonite is generally considered to occur during the anaerobic period and will mainly interact with the bentonite medium through ion exchange on basal surfaces (Xia et al. Reference Xia, Idemitsu, Arima, Inagaki, Ishidera, Kurosawa, Iijima and Sato2005; Wilson et al. Reference Wilson, Benbow, Sasamoto, Savage and Watson2015) and sorption to edge sites (Gehin et al. Reference Gehin, Greneche, Tournassat, Brendle, Rancourt and Charlet2007; Soltermann et al. Reference Soltermann, Fernandes, Baeyens, Dahn, Miehe-Brendle, Wehrli and Bradbury2013; Muurinen et al. Reference Muurinen, Tournassat, Hadi and Greneche2014; Latta et al. Reference Latta, Neumann, Premaratne and Scherer2017). A monophasic diffusion of Fe2+ could, therefore, be expected. In fact, a biphasic diffusion front is generally observed, as in Xia et al. (Reference Xia, Idemitsu, Arima, Inagaki, Ishidera, Kurosawa, Iijima and Sato2005) and in the present study. Here, a significant amount of additional Fe2+ is found at a greater distance from the interface, deeper in the bentonite, while Fe is mainly found as Fe3+ in the vicinity of the interface, up to several centimeters inside the bentonite.
One could argue that this large amount of Fe3+ would stem from a methodological artifact in the dismantling, subsampling, and analyzing approaches, i.e. that Fe2+ was present mainly in situ, but would have been oxidized prior to analysis. Partial oxidation of the sample studied cannot be ruled out. Nevertheless, the observed low reduction level of the additional Fe pool found close to the interface appears as a normal result of steel–bentonite interactions in such experimental settings. Similar observations were made in samples retrieved from analogous long-term experiments, such as the ABM2 experiment (Hadi et al. Reference Hadi, Wersin, Jenni and Greneche2017). Because of the different shape, size, position, and the shorter dismantling time in the ABM2 experiment, less oxidative perturbation than in the FEBEX experiment should be expected (e.g. larger amounts of air circulation due to the presence of the gap between the liner and the heater).
The presence of a several centimeters wide Fe3+-rich, orange-colored bentonite rim right around a steel piece, surrounded by a larger and blue colored bentonite rim (Fe poorer, but more reduced) further away, was observed at various locations, such as the tips of both vertical and horizontal extensometers installed in the deeper section 54 or the fissurometers in section 43 of the FEBEX experiment (Fig. S3). In fact, this pattern appears to be the typical result of aerobic followed by anaerobic corrosion of steel enclosed in initially aerobic bentonite.
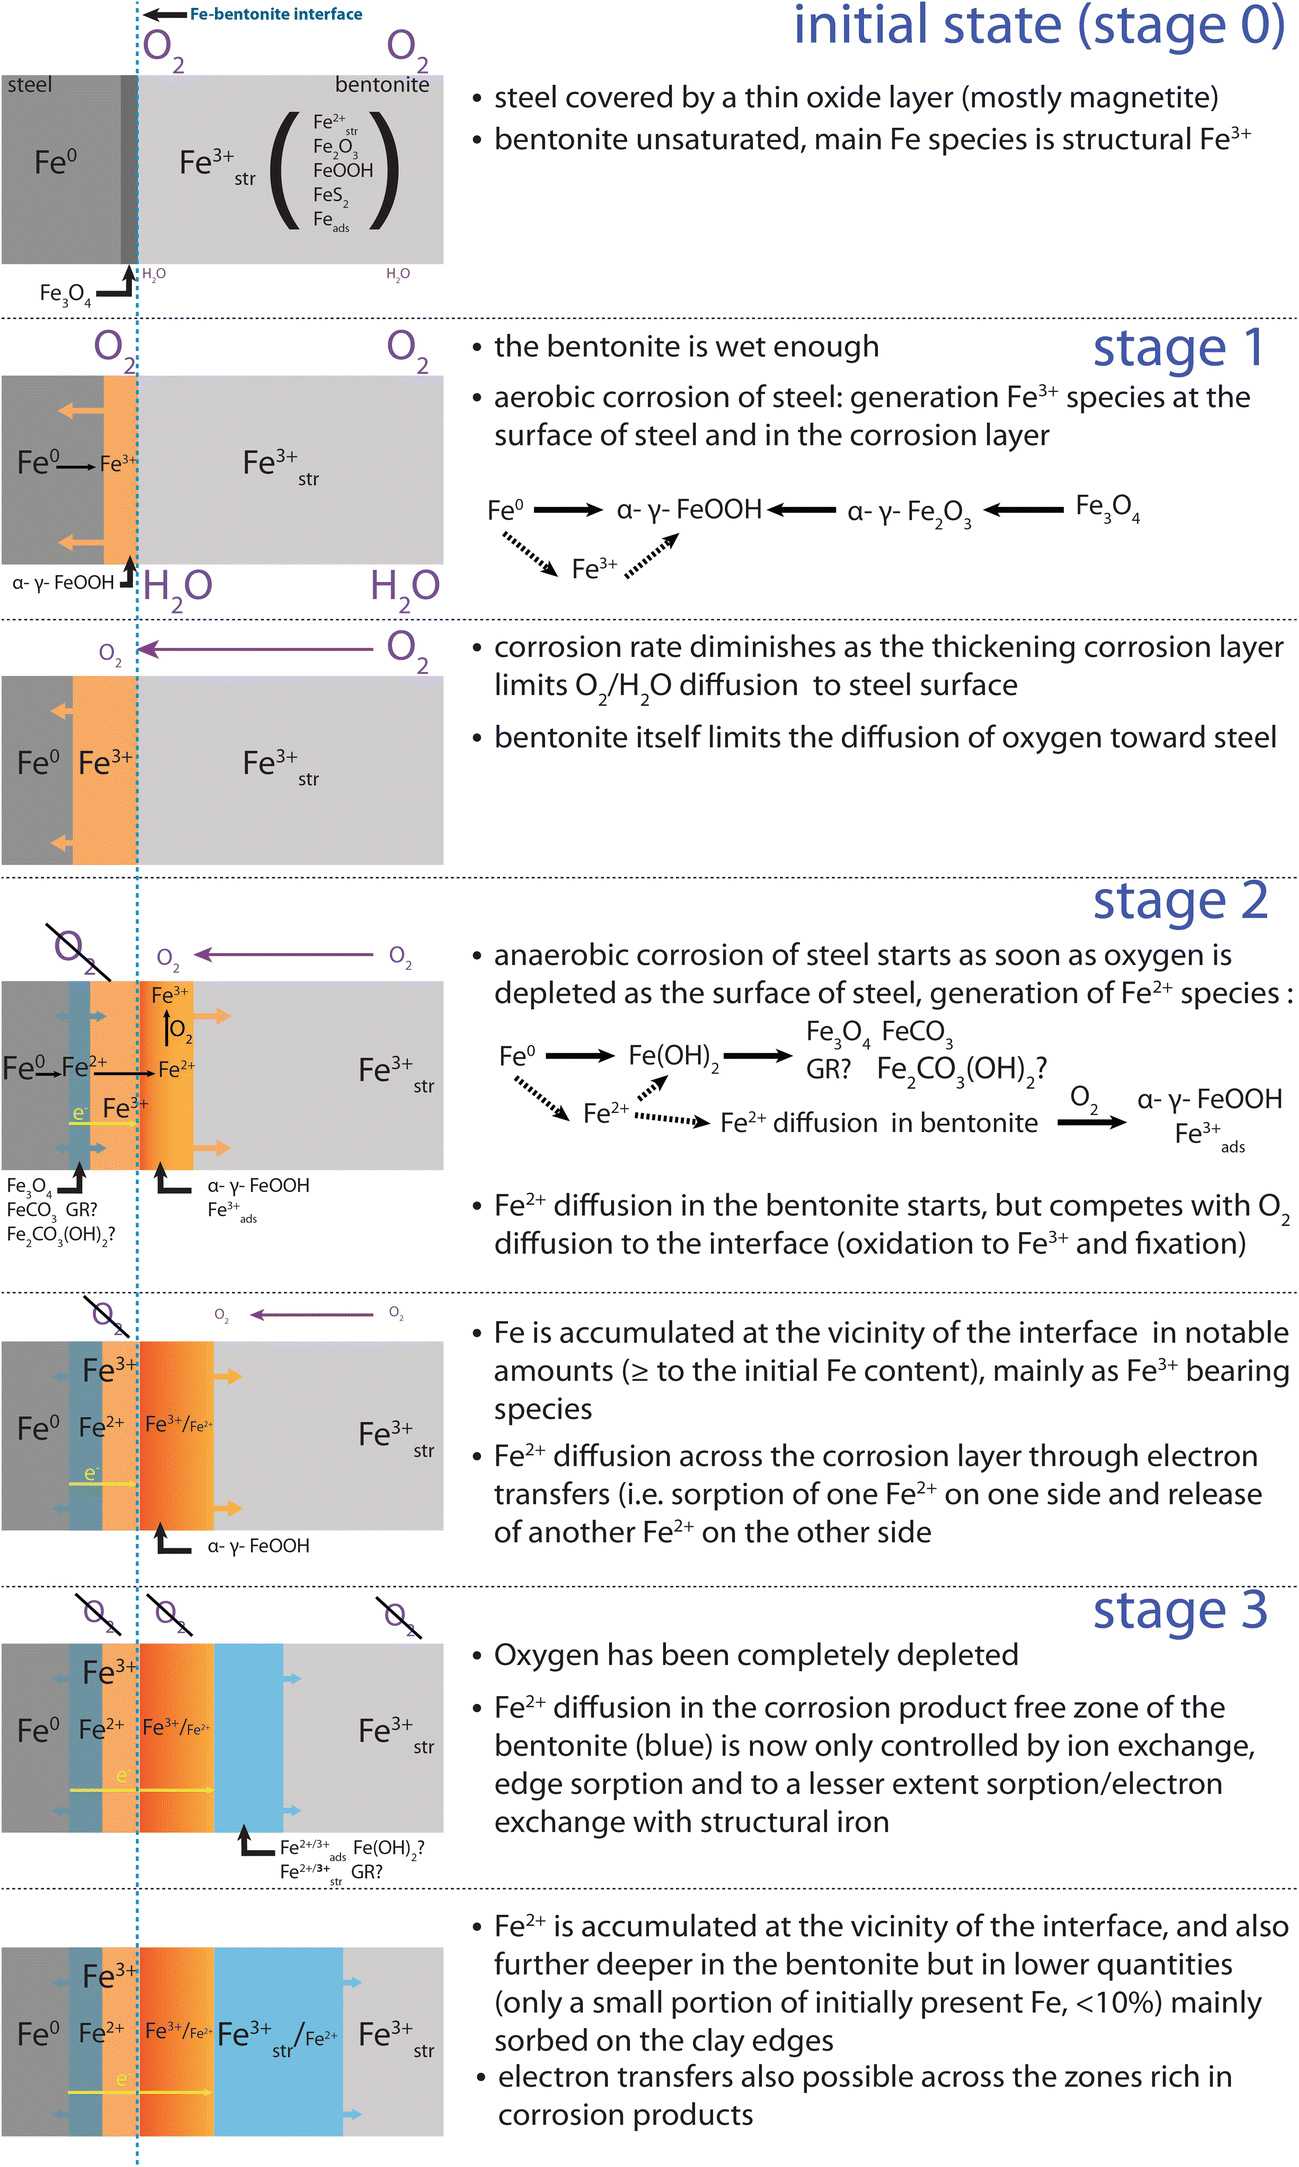
In the proposed mechanism, Fe2+ diffusion is first hindered by O2 present in the bentonite. Fe2+ is oxidized to Fe3+ and precipitates mainly as goethite as soon as it diffuses into the aerobic bentonite. Fe is, thus, first accumulated close to the interface, and will diffuse further in as soon as O2 is depleted in the bentonite. Although it cannot be completely ruled out, neo-formation of hydrous Fe silicates was not observed in any studied section of the FEBEX experiment, and is, thus, not taken into account in the proposed mechanism.
Diffusing Fe2+ can further interact with Fe initially present in the raw bentonite, which consists mainly of structural Fe3+ in octahedral smectite layers. This Fe is considered to be immobile but can undergo reversible redox reactions with the diffusing Fe2+, through the reduction by Fe2+ sorbed on the edges (Schaefer et al. Reference Schaefer, Gorski and Scherer2011; Soltermann et al. Reference Soltermann, Fernandes, Baeyens, Dahn, Miehe-Brendle, Wehrli and Bradbury2013, Reference Soltermann, Fernandes, Baeyens, Dahn, Joshi, Scheinost and Gorski2014), and also on basal surfaces (Komadel et al. Reference Komadel, Madejová and Stucki2006; Latta et al. Reference Latta, Neumann, Premaratne and Scherer2017). Moreover, sorption of diffusing Fe2+ on pre-existing Fe3+ bearing oxides (e.g. on hematite (Yanina and Rosso Reference Yanina and Rosso2008; Rosso et al. Reference Rosso, Yanina, Gorski, Larese-Casanova and Scherer2010; Kerisit et al. Reference Kerisit, Zarzycki and Rosso2015) or goethite (Handler et al. Reference Handler, Frierdich, Johnson, Rosso, Beard, Wang, Latta, Neumann, Pasakarnis and Premaratne2014)) followed by an electron transfer inside the oxide and a release of Fe2+ from another crystallographic site is also possible. Redox interaction with the clay (edge or basal sorption and clay reduction) might lead to the formation of strongly sorbed Fe3+ and immobile structural Fe2+ (limited by the number of structural Fe(III) sites, i.e. at most 600 mmol∙kg−1). While sorption on oxides (followed by oxidation) leads to the fixation of Fe3+ in oxides, it also induces the release of mobile Fe2+ from another crystallographic plane (thus no net accumulation). Both processes will lead to retardation in Fe transport.
Following the proposed mechanism for Fe diffusion in the bentonite (Fig. 11), the additional Fe3+ is generated in situ, as Fe2+ starts to diffuse in the bentonite while low levels of oxygen in the clay are still present.
Proposed Fe diffusion mechanism at the steel–bentonite interface

Results from experimental (Schlegel et al. Reference Schlegel, Bataillon, Brucker, Blanc, Pret, Foy and Chorro2014) and modeling (Wilson et al. Reference Wilson, Benbow, Sasamoto, Savage and Watson2015) studies show that the aerobic stage (stage 1 in Fig. 11) in a repository environment is generally short and would last less than a year under closed conditions as demonstrated from a lab-scale experiment (Kaufhold et al. Reference Kaufhold, Hassel, Sanders and Dohrmann2015). As outlined in the introduction, the FEBEX experiment was not a closed system (potential pathways for air through the plug, the cable ducts, and the gas and water pipes, the effects of the dismantling of FEBEX I and the potential presence of fractures in the host rock). Nevertheless, various features related to anaerobic corrosion were observed throughout the samples. In particular, significant amounts of additional Fe2+ were found not only in the vicinity of the interface but also further away in the blue halo. This indicates that anaerobic conditions were reached during the FEBEX experiment. In the proposed mechanism (Fig. 11), diffusion of Fe2+ starts as soon as anaerobic conditions are reached at the surface of the steel and in the corrosion layer (stage 2). Aerobic conditions would still be prevailing in the bentonite. Most of the diffusing Fe2+ is, thus, oxidized and immobilized as soon as it enters the bentonite, mainly as Fe3+ paramagnetic oxides (e.g. goethite) and to a lesser extent as sorbed Fe3+ (actually Fe2+ is first sorbed and then oxidized by O2). During stage 2, the diffusion of Fe2+ inside the block, thus, competes with the diffusion of oxygen toward the interface. Diffusivity of Fe2+ would increase as soon as O2 concentration decreases. At some point (stage 3), O2 levels in the block become low enough to enable effective diffusion of Fe2+ over a larger distance in the clay. Diffusion of Fe2+ is then controlled by sorption onto clay minerals and by redox processes with structural Fe3+ in the clay or Fe3+ oxides (sorption followed by oxidation). The former process (sorption only) would be predominant, as sorption-reduction sites make up only a small portion of the sorption sites (at most 20% of the occupied octahedral sites are structural Fe (Grim and Kulbicki Reference Grim and Kulbicki1961; Gates Reference Gates and Kloprogge2005)). Either Fe2+ is sorbed without electron transfer or an associated redox reaction with structural Fe3+ occurs, in which structural Fe3+ is reduced and sorbed Fe2+ is oxidized. Under such conditions, Fe2+ diffuses further away from the interface and the local accumulation is more limited. The residence time of Fe2+ in the Fe3+-enriched zone close to the interface would be shortened, as the apparent diffusivity of Fe2+ would be enhanced by electron conduction through oxides. This can explain the absence of additional Fe2+ observed in the four samples collected in the red and orange zones close to the interface. As a consequence, this latter process would lead to a progressive tailing of the Fe profile. This means that the accumulation process of Fe3+ in the vicinity of the interface is stopped, and already-accumulated Fe3+ is slowly displaced further away from the interface.
It must be emphasized that the phenomena described were restricted to localized areas and did not occur all along the liner. The colored halos were observed only along a portion of the liner located in between the two heaters, and along other steel pieces located closer to the wall than to the heater. This is most likely related to varying water saturation conditions in the experiment. In the vicinity of the heaters, the bentonite was presumably not humid enough to allow such processes to occur. Strong contrast in water saturation (as measured in a neighboring layer (Villar et al. Reference Villar, Iglesias, Abós, Martínez, de la Rosa and Manchón2016)) may also explain the large differences between the two studied bentonite blocks and the resulting asymmetric corrosion halo (related to the leftover plastic sheet between the granitic host-rock and the lower part of this section of the experiment). These two blocks originated from the same section of the experiment, but the lower-most one (BM-B-42-2) was almost unaffected by corrosion of the steel liner. This is likely related to the leftover plastic sheet between the granitic host-rock and the lower part of this section of the experiment.
CONCLUSION
Eighteen years of steel–bentonite interaction in the FEBEX in situ test resulted in significant corrosion of emplaced metal components and migration of Fe inside the bentonite in some parts of the experiment, generating large visible red, orange, and blue colored halos. The combination of bulk and spatially resolved approaches employed in this study enabled characterization of the Fe diffusion front observed over >140 mm inside a bentonite block. Goethite was the main newly formed Fe-bearing phase present in the red-orange zone present at the interface with steel (thus only additional Fe3+), while additional Fe2+ was found only at the very interface (few first hundreds of micrometers) and further into the wider and Fe poorer blue zone (without additional Fe3+). The exact location and speciation of this additional Fe2+ is, however, still to be determined. A mechanism is proposed where diffusion of Fe2+ only occurs as soon as anaerobic corrosion occurs (i.e. when O2 is depleted at the surface of steel) and sufficient water saturation conditions are met. Diffusion then proceeds in two stages. During the first stage, Fe2+ diffusion inside the bentonite competes with O2 diffusion toward the interface and Fe is accumulated as Fe3+ (oxyhydr)oxides (mainly goethite) in the vicinity of the interface. As soon as O2 is depleted inside the bentonite, Fe2+ can diffuse deeper into the clay. Better understanding of the process behind Fe accumulation in the bentonite also requires a good knowledge of pre-existing Fe-bearing phases. This combined SEM, XRD, Raman, and 57Fe Mössbauer approach brings further refinement to pre-existing data on FEBEX bentonite.
ACKNOWLEDGMENTS
The authors thank Thomas Siegenthaler and Thomas Aebi for sample preparation. Andreas Jenni, Urs Mäder (University of Bern), and Florian Kober (Nagra) are acknowledged for fruitful discussions. The authors are grateful also to the three anonymous reviewers and the editorial team for careful handling of this manuscript. This work was partially supported by Nagra.