I. INTRODUCTION
The processing of Cu-based metal matrix composites (MMCs) strengthened by dispersion with TiB2 is a leading candidate for applications requiring high thermal and electrical conductivity as well as high mechanical strength.Reference Groza and Gibeling1 The selection of TiB2 from a wide range of available ceramics is motivated both by its superior physical properties (hardness and electrical conductivity) as well as considering the electrical nature of the adopted sintering process viz spark plasma sintering (SPS).Reference Munir, Tamburini and Ohyanagi3 TiB2 is characterized by the high modulus of elasticity (514 GPa), high hardness (25–35 GPa), high melting point (>3000 °C), considerable chemical stability, good thermal (∼65 W/m/K) and electrical [∼7.7 × 10⁶ (Ω m)−1] conductivities, compared to other ceramics.Reference Basu, Raju and Suri2 The low density of TiB2 (4.5 gm/cc) also makes it suitable for light weight applications, whereas its coefficient of thermal expansion (8.1 × 10⁻⁶ °C−1) has to be slightly compromised vis-á-vis copper (18 × 10−6 °C−1).Reference Munro4 Though data on diffusion of TiB2 in Cu or vice-versa are not available in the existing literature, it can be well perceived that TiB2 acts as a nonsintering agent in the absence of any suitable binder in the Cu-matrix.
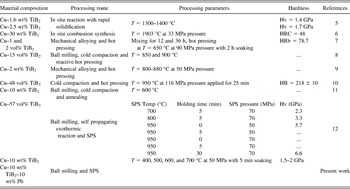
Some limited attempts to process Cu–TiB2 based composites have been made and reported in the literature (Table I). While an in situ reaction in a mixture of elemental powder precursors and then subsequent cold compaction and hot pressing has been largely reported,Reference Guo, Shen and Wang5–Reference Biselli, Morris and Randall11 Kwon et al.Reference Kwon, Dudina, Korchagin and Lomovsky12 used SPS of the milled Cu–Ti–B powders to develop Cu–TiB2 composites. They synthesized Cu–57 vol% TiB2 with TiB2 nanodispersoids by an in situ exothermic reaction, followed by sintering via SPS.Reference Kwon, Dudina, Korchagin and Lomovsky12 At one instance, they were able to achieve a density of ∼79% ρth and hardness of ∼2.3 GPa at a sintering temperature of 700 °C and 70 MPa pressure with 5 min holding time. The major reason toward using the in situ reaction route, as advocated by many investigators, is that it is possible to produce nanodispersoids in an impurity-free matrix by stabilizing the reaction conditions. Zhang et al.Reference Zhang, Yan and Yu6 reported that the reaction to produce TiB2 as reaction product out of the Cu–Ti–B ternary system can only take place, when the reaction temperature is greater than 1527 °C. If the conditions in that parametric window are not precisely maintained, the formation of other unwanted phases cannot be avoided. Moreover, due to application of a high temperature of 1903 °C, the large mismatch of thermal expansion and elastic modulus between adjacent Cu and TiB2 grains has resulted in the formation of interfacial cracks and poor bonding. Lopez et al.Reference Lopez, Corredor, Camurri, Vergara and Jimenez7 fabricated Cu–1 and 2 vol% TiB2 powder using high energy milling for 12 and 36 h, followed by uniaxial pressing at 90 MPa for 2 h at 650 °C and finally hot rolling at 850 °C. Ma and Tjong synthesized Cu–15 vol% TiB2 compact by mixing the elemental Cu, Ti, and B powders, followed by hot pressing at 850 °C and subsequently by extrusion at 900 °C. Dong et al.Reference Dong, Zhou, Shi and Chang9 also attempted in situ synthesis of the Cu–2 wt% TiB2 composite by mechanical alloying for 27 h and hot pressing at 890 °C and 50 MPa pressure. From thermal analysis, they found that in situ formation of TiB2 occurs in the temperature of 825–880 °C. Yih and ChungReference Yih and Chung10 followed a different methodology of consolidation by coating TiB2 particles with Cu to form Cu–60 vol% TiB2 composites by ball milling, followed by hot pressing at 950 °C at 116 MPa pressure with 25 min soaking time. In the above backdrop, it can be emphasized that the need to carry out the consolidation at lower temperatures and pressures with concurrent uniform distribution of the phases as well as to retain the ultrafine grained microstructure was the major motivation of the present work and to achieve our objective, SPS has been selected as a suitable processing route.
Summary of literature results on Cu–TiB2 alloys, processed via various manufacturing routes, process parameters and comparison with present results.

As far as the sintering conditions are concerned, sintering above 327 °C (i.e., melting point of Pb) would melt Pb and thus, leading to liquid phase sintering (LPS) of Cu–TiB2–Pb compact. In an earlier work, the present authors were able to achieve density close to 90% of ρtheoretical for the Cu–10 wt% Pb nanocomposite without any Pb segregation.Reference Sharma, Biswas, Basu and Chakravarty13 Also, copper and titanium diboride form an immiscible system and the wettability of Cu by TiB2 is very poor (wetting angle ∼158°).
In this perspective, an attempt has been made in the present work to alloy a Cu–matrix with 10 wt% Pb addition to aid the sintering process and to improve the achievable density. To impart good hardness, 10 wt% of TiB2 was added to the Cu–Pb matrix. During the SPS process, the combination of uniaxial pressure, holding time and current/voltage pulse play an important role in the densification process. In the above backdrop, sintering temperature has been optimized to obtain an optimum density of the composites. An effort has been made to establish microstructure–property correlation, while substantial efforts are made to discuss the densification characteristics on the basis of in situ measured current profiles during SPS processing. A new approach to explain the densification kinetics via mechanism of surface melting of the constituents has been proposed and this was supported by carrying out microstructural analysis using the electron back scattered diffraction (EBSD) technique.
II. EXPERIMENTAL PROCEDURE
A. Processing
For the composite production, high purity elemental copper powders (mean particle size ∼3 µm, 99.7 pct purity, Sigma–Aldrich, St. Louis, MO), Pb powder (mean particle size ∼10 µm, 99.98 pct purity, Sigma–Aldrich) and TiB2 powder (mean particle size ∼3 µm, SPS Syntex Inc., Kanagawa, Japan) were used as the starting materials. The powder mix of Cu–TiB2 and Cu–TiB2–Pb in the ratio of 90:10 and 80:10:10 (by weight) were mechanically mixed under dry conditions, using a high energy ball mill (Fritsch Pulverisette 5). The milling operation of the premixed powders was performed in a planetary micro-mill for 8 h using WC balls and vial at 100 rpm. The charge ratio (ball-to-powder ratio) used was 10:1 by wt%. To avoid oxidation of the starting powders, high purity argon was replenished into hermetically sealed jars after every 30 min and this entire cycle was repeated 16 times.
SPS using a Dr. Sinter 515S apparatus (SPS Syntex Inc., Kanagawa, Japan) was carried out with Cu–TiB2 and Cu–TiB2–Pb compositions at 400, 500, 600, and 700 °C with an uniaxial pressure of 50 MPa. The powder mix after loading in a cylindrical graphite die (diameter = 15 mm) was heated with the heating rate of 90 K/min to the sintering temperature and held at a given sintering temperature for 5 min, before it was furnace-cooled to room temperature. An inert atmosphere of high purity argon was maintained by continuous purging throughout the processing cycle in the sintering chamber with a flow rate of 2 L/min to ensure minimal oxidation of the powders during heating.
B. Characterization
1. Density determination
The density of all SPS processed pellets was determined according to Archimedes’ principle using distilled water (Sartorius CPA 225D). The theoretical density for the sintered composition was calculated by following the rule of mixtures, considering the theoretical densities of pure Cu, TiB2, and Pb as 8.96, 4.5, and 11.68 gm/cc, respectively.
2. Phase analysis
The phase identification of the polished and flat samples as well as the ball-milled powders was performed by x-ray diffraction (XRD) (Brüker D8 Focus, Billerica, MA) using Ni-filtered Cu Kα (λ = 0.154056 nm) radiation at a scan rate of 0.5°/min. The samples were scanned in the angular range of 2θ = 25–100° with a step-size of 0.05°. The voltage and current applied to the Cu target were 40 kV and 40 mA, respectively. The thermodynamic analysis to assess the formation of different oxides in the samples was analyzed through HSC Thermochemistry (Version 6.1) software.
3. Hardness measurement
Vickers hardness of the sintered samples was measured using a Vickers microhardness tester (Bareiss Prüfgerätebau) by applying 200 gm load and a dwell time of 10 s. The diagonals of Vickers indents were then measured using an optical microscope. At least 10 measurements have been carried out for each sample. The average value of the measurements is reported with error bars, indicating the standard deviation.
4. Microstructural characterization
The morphology of the starting powders and phase distribution of the as-processed composite were investigated using a scanning electron microscope (SEM) in SE and BSE modes (Carl Zeiss EVO50, Oberkochen, Germany) and optical microscope (Nikon Eclipse LV100, Tokyo, Japan). The powder samples were smeared over carbon tape and excess quantity was removed by gentle tapping before being loaded into the microscope chamber. Similarly, sintered composites were mirror polished by grinding, coarse polishing in alumina (5 µm) and then fine polishing using a diamond suspension (5 and 1 µm). The sample for EBSD analysis was additionally polished with colloidal silica as a final step.
5. Elemental analysis by an electron probe microanalyzer
The elemental analysis of the sintered composite was investigated by using field emission electron probe microanalyzer (JEOL 8530F, Peabody, MA) in WDS (wave length dispersive spectroscopy) mode at an accelerating voltage of 15 kV.
6. Grain orientation analysis by EBSD analysis
The analysis of the preferred grain orientation in the sintered composite was carried out by using EBSD (Oxford Instruments, Abingdon, Oxon, UK) coupled with SEM (Carl Zeiss EVO50, Oberkochen, Germany) with an in-built Aztec software package. The area scanned was roughly 22 × 12 μm in dimensions at an accelerating voltage of 20 kV at a tilt angle of 70°.
III. RESULTS
A. Microstructural characterization
1. Morphology and size distribution of starting powders
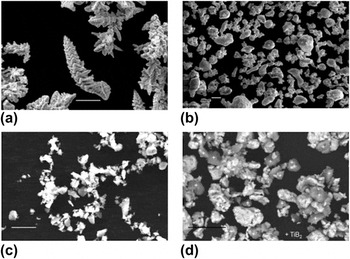
Figure 1 shows the representative SE-SEM micrographs of the as-received and ball-milled powders, illustrating their morphology and size scale. Figures 1(a), 1(b), and 1(c) correspond to the as-received Cu with dendritic, Pb with ligamental and TiB2 with flaky morphology, respectively. Figure 1(d) shows the Cu–10 wt% TiB2–10 wt% Pb powder, after ball-milling for 8 h. It can be seen from Figure 1(d) that the initially faceted TiB2 particles have smoothed down after ball-milling though no significant reduction in particle size was observed. Interestingly, the copper dendrites with an average initial aspect ratio of ∼10:1 have successfully transformed into particles with equiaxed morphology. Pb, being ductile, can be present in the form of chapped layers over Cu particles. The high-energy milling for 8 h duration was significant enough for Cu and Pb powders to undergo severe plastic deformation, fracturing and cold-welding.
SE−SEM micrographs of as–received (a) Cu, (b) Pb, and (c) TiB2 powders and (d) BSE–SEM micrograph of ball–milled Cu–10 wt% TiB2–10 wt% Pb powder. Micron marker equals 10 μm. Plus sign marks the TiB2 particles.

2. Phase distribution of sintered composites
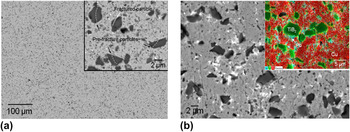
Figures 2(a) and 2(b) show the representative BSE-SEM micrographs of Cu–10 wt% TiB2 and Cu–10 wt% TiB2–10 wt% Pb composites, sintered at 400 °C respectively. It can be noted that light gray contrast is for Cu-matrix, dark gray is for TiB2 and bright phase is Pb. Homogeneous and uniform distribution of TiB2 and Pb in the Cu-matrix is the common feature for both the composites. The inset in Fig. 2(a) shows few TiB2 particles marked with white dotted lines. These lines (drawn offset) are the position of the actual cracks which are developed in the TiB2 particles during the course of ball-milling, indicating a prefracturing process. Upon close inspection of Figs. 2(a) and 2(b), the distribution of still finer TiB2 particles can also be noted in the composites, which might have occurred by the fracture and subsequent detachment of corners in the course of rounding and smoothening process of the coarse TiB2 particles during ball-milling. Pb particles after being melted at sintering temperatures of 400 °C or more (m. p. ∼ 327.5 °C) can be traced as contours in the Pb containing composites [see Fig. 2(b) for Cu–10 wt% TiB2–10 wt% Pb samples sintered at 400 °C].
BSE–SEM micrographs of the SPS samples: (a) Cu–10 wt% TiB2 at 400 °C and (b) Cu–10 wt% TiB2–10 wt% Pb at 400 °C. Inset in (a) shows the high magnification micrograph. Temperature values quoted above are the sintering temperature.

B. Phase assemblage of sintered composites
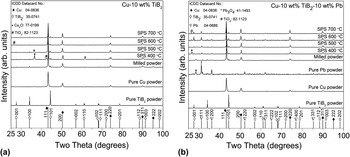
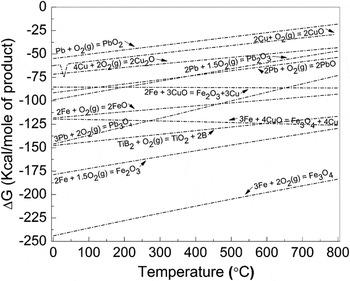
Figures 3(a) and 3(b) show the XRD patterns acquired from the polished surfaces of Cu–10 wt% TiB2 and Cu–10 wt% TiB2–10 wt% Pb samples, respectively, sintered at different sintering temperatures. XRD patterns obtained from the respective ball-milled powders are also shown in Fig. 3. The peak position corresponding to each individual starting phase from the ICDD® (International Center for Diffraction Data) database has also been plotted after normalization and the corresponding data card number is indicated at the top left corner. The point to be noted is that the plotted ICDD® peaks are only symbolic positional representations of the phases i.e., without any type of broadening or strain effects. The area of the individual peaks was obtained with the help of Origin® Version 8.5 (OriginLab) software. Some of the sintered composites exhibit the appearance of oxide peaks (Cu2O, TiO2, and Pb3O4) corresponding to their parent constituents (Cu, TiB2, and Pb). The identification of the characteristic oxide peaks (ball-milled as well as sintered) was carefully analyzed as the oxide formation is supposed to have an adverse effect on the effective density obtained (Cu2O: ρth = 6.0 gm/cc, TiO2: ρth = 4.23 gm/cc and Pb3O4: ρth = 8.3 gm/cc). The formation of different oxides can be explained by plotting the corresponding free energy of formation (ΔG) in the temperature range of 0–800 °C (Fig. 4). The ΔG values are calculated using HSC Thermochemistry (Version 6.1) software. For example, among the possible Pb-oxides (PbO, PbO2, Pb2O3, and Pb3O4), Pb3O4 is the most thermodynamically stable phase in the sintering temperature range of the present study.
XRD patterns of (a) Cu–10 wt% TiB2 and (b) Cu–10 wt% TiB2–10 wt% Pb, ball–milled powder and composites after SPS at 400, 500, 600, and 700 °C at 50 MPa. Standard ICDD peaks are also shown (bottom) corresponding to each phase.

Plots of relative free energy (ΔG) with temperature for different elemental oxides of Cu, Pb, Ti, and fe, as determined using HSC Thermochemistry software.

C. Hardness of sintered composites
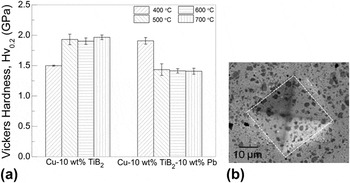
Figure 5(a) shows the hardness variation of the Cu–10 wt% TiB2 and Cu–10 wt% TiB2–10 wt% Pb samples, sintered at 50 MPa and at different sintering temperatures. In the present study, the applied load was 200 gm and the possibility of any indentation size effect (ISE) can, therefore, be ruled out. Overall the hardness varies in the range of ∼1.4–2 GPa for all samples sintered at different temperatures. For the Cu–10 wt% TiB2 composite, the mean hardness is close to ∼1.5 GPa, when sintered at 400 °C and increases to ∼2.0 GPa at 500, 600, and 700 °C. Whereas for the Cu–10 wt% TiB2–10 wt% Pb composite, the hardness is found to be maximum after sintering at 400 °C (∼1.9 GPa) and decreases down to ∼1.4 GPa and remains steady for samples sintered at 500, 600, and 700 °C.
(a) Hardness plot for Cu–TiB2 and Cu–TiB2–Pb composites as a function of SPS temperature and (b) shows a typical indenter replica (white dotted square) on the sample.

D. Densification of the composites
1. Variation of relative density with sintering temperature
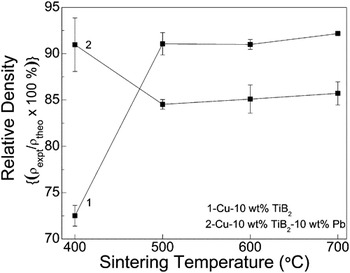
Figure 6 shows the variation of relative density with temperature for Cu–10 wt% TiB2 and Cu–10 wt% TiB2–10 wt% Pb composites sintered at 50 MPa. It can be seen that the relative density for Cu–10 wt% TiB2 composites is close to ∼72% ρth at 400 °C and rises to ∼91 % ρth at 500 °C and remains almost constant at that value for 600 and 700 °C. The trend is somewhat opposite for the Cu–10 wt% TiB2–10 wt% Pb composite in that ρexpt is close to ∼91% ρth at 400 °C and decreases to 85% ρth at 500 °C. The sinter density however remains constant after sintering at 600 and 700 °C. It should be noted that the set of data points have been connected by dotted lines for visualization purpose only and should not be used to establish any trend. Moreover, the trend in the hardness variation (see Sec. III. C) and variation in relative density complement each other for the sintered composites as it is obvious from the fact that decrease in density will lead to a corresponding lowering in hardness values.
Relative density plot for Cu–TiB2 and Cu–TiB2–Pb composites as a function of SPS temperature.

2. In situ densification vis-á-vis increase in sintering temperature
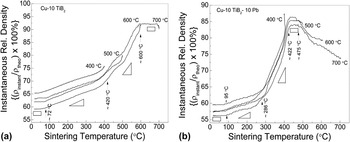
To assess the progress of densification with temperature, the instantaneous relative density, defined as (ρinstantaneous/ρtheoretical) × 100%, is plotted and shown in Fig. 7. The instantaneous density is computed on the basis of real time dilatometer measurements during a SPS run. Figures 7(a) and 7(b) show the plots for the instantaneous relative density with temperature for Cu–10 wt% TiB2 and Cu–10 wt% TiB2–10 wt% Pb composites, respectively. Moreover, the curves shown are inclusive of the soaking period (here 5 min) at the respective sintering temperature for both composites i.e., just before the start of the cooling period, so that the effect of different diffusional processes can clearly be analyzed and understood. Black dotted arrows in Figs. 7(a) and 7(b) mark the temperature, where there is a transitional change in the instantaneous relative density. Also, the black rectangles and triangles symbolize the slopes corresponding to each region having a constant slope. The rectangle corresponds to a zero slope and signifies any imperceptible change in density, whereas triangles with a positive slope indicate increasing densification and vice-versa. It should be emphasized here that the temperatures marked here represent the slope changes or the inflexion points are made on a purely qualitative basis. Also, the origin for slope changes will be discussed in the subsequent section.
Plots of instantaneous relative density with temperature for (a) Cu–10 wt% TiB2 and (b) Cu–10 wt% TiB2–10 wt% Pb composites.

IV. DISCUSSION
The present investigation has clearly demonstrated that it is possible to obtain 90% ρth in Cu–10 wt% TiB2 at 500 °C and 92% ρth in the Cu–10 wt% TiB2–10 wt% Pb composite at 400 °C with a homogeneous distribution of TiB2 and Pb in the Cu matrix using the SPS route. Moreover, lower processing temperatures and shorter holding time are the other notable features of the present study. These can be considered as a clear advantage in contrast to other studies as the typical processing temperatures span from 800–1900 °C and pressure in excess of 100 MPa, as tabulated in Table I. Also, it is clear from Figure 6 that the addition of 10 wt% Pb in Cu–10 wt% TiB2 does not necessarily result in attaining higher density by facilitating LPS. The merit of this work, therefore, also lies in exploring the addition of Pb to Cu–TiB2 composites and its effect on the sinter density with respect to the lower processing temperatures. The possible reasons for such densification, the variation in densification kinetics and density variation will be discussed in this section in reference to the following aspects:
(i) Slope-wise changes in instantaneous relative density: Surface melting of Cu and Pb prior to the attainment of bulk equilibrium melting temperature and “quasiliquid” formation.
(ii) Densification behavior of Cu–10 wt% TiB2.
(iii) Densification behavior of Cu–10 wt% TiB2–10 wt% Pb: Temperature dependent wetting behavior of Pb on Cu.
(iv) Variation in the diffusivity [lattice, grain boundary (GB) and surface] of Cu with temperature.
(v) Formation of different oxides during sintering and their effect on the density.
a) The primary aim of Pb addition in bearing alloys is to promote lubrication. The secondary reason of adding Pb in the Cu–10 wt% TiB2 composites has been to increase the density after sintering at processing temperatures of greater than the bulk melting temperature T m of Pb i.e., ∼327.5 °C. But as widely documented, the melting of any solid begins at its surface and therefore, the temperature approaching T m can trigger a lot of surface-specific processes: surface relaxation, surface reconstruction, deconstruction, preroughening, roughening and wetting.Reference Mei and Lu14 The free surface of any solid can act as a heterogeneous site for melt nucleation, at a temperature below T m. Since different faces of a crystal have different atomic configurations and related energy, surface melting occurs with the initiation and growth of a loose and disordered region in the form of a surface film over the crystal, termed as “quasiliquid.”
As proposed by Pluis et al.Reference Pluis, Gon, Frenken and Veen15 and Pinxteren,Reference Pinxteren and Frenken16 the surface melting of Pb (110) is initiated by the formation of a partially ordered liquid at 227 °C, followed by a surface liquid film at 287 °C, which is much below the equilibrium bulk melting temperature of 327.5 °C. Detailed experimental studies indicate that for Pb, open (110) surfaces exhibit a complete surface premelting, (100) surfaces show incomplete surface melting and close-packed (111) surfaces do not melt at all below T m.Reference Pluis, Gon, Frenken and Veen15,Reference Pinxteren and Frenken16 Similar experiments and modeling investigations carried out by HakkinenReference Hakkinen and Manninen17 on the melting and disordering of Cu establishes that the open (110) face disorders at the lowest temperature of 427 °C, whereas the closest-packed (111) face is the most stable one till the equilibrium melting point, ∼1083 °C.
Figure 7(a) plots the instantaneous density variation for Cu–10 wt% TiB2 composite. The curves plotted for sintering temperatures of 500, 600, and 700 °C show a slope change occurring at ∼420 °C, which is quite close to the value reported for the disordering of (110) face for Cu i.e., 427 °C.Reference Hakkinen and Manninen17 The increase of slope on crossing the transition temperature of ∼420 °C will facilitate the intensification of densification process by the premelting of Cu particles. Again at a temperature of ∼600 °C, any further increase in slope is not recorded and the saturation in instantaneous relative density has reached. It is, therefore, clear that the Cu/Cu particle interface, with one or both particles having their (110) face oriented with the neighboring particle, will experience an increase in kinetics of diffusional processes, thereby leading to densification. The TiB2 particles, being an intermetallic with high melting point (>3000 °C), will act as a nonsintering agent and will not contribute toward the densification process.Reference Basu, Raju and Suri2 The Cu/TiB2 interface is expected to be mechanically bonded. One obvious assertion about the diffuse nature of the slope change can be put forward on the ground that all the different crystallographic planes in a crystal have different limits of disordering temperature. For example, (111) face of Cu is fairly stable till the bulk equilibrium melting temperature is reached. This is why there is never a sharp transition or well defined temperature break point in relative density plots.
Again, Fig. 7(b) plots the instantaneous density variation for Cu–10 wt% TiB2–10 wt% Pb composite. Here again, the curves plotted for all sintering temperatures of 400, 500, 600, and 700 °C show the first major break at a temperature close to ∼286 °C, which matches very closely with the temperature of formation of surface liquid film on the Pb (110) face.Reference Pluis, Gon, Frenken and Veen15,Reference Pinxteren and Frenken16 This phenomena of premelting occurring much below the bulk melting temperature of Pb i.e., 327.5 °C will then be responsible for the incipient melting of Pb in the powder compact and once the temperature crosses the limit of bulk melting temperature itself at 327.5 °C, Pb will melt, thereby modulating the sintering process by LPS phenomena.Reference German, Suri and Park18 At this temperature, fully molten Pb-rich liquid, thus formed around the Cu grains would promote faster diffusion path, leading to rapid densification. This is also the region where the maximum axial shrinkage (since increase in density or decrease in axial dimension are equivalent) in the powder compact will take place as is evident from the steepest slope appearing for the curves plotted at all sintering temperatures.
As the sintering progresses, the second transition in the slope change in case of Cu–10 wt% TiB2, occurs at a temperature close to ∼422 °C which is again close to the value reported for the disordering of (110) face of Cu i.e., 427 °C.Reference Hakkinen and Manninen17 This break point in temperature is followed by a constricted plateau during which the relative density remains almost constant for all sintering temperatures of 500, 600, and 700 °C. Such a plateau extends till the third transition temperature is reached close to ∼475 °C. Beyond this temperature, there is a decrement in relative density obtained for sintering temperatures of 600 and 700 °C. This decrement in obtained relative density can be explained on the basis of the wetting behavior of Cu grains by liquid Pb phase and has been explained in a following subsection.
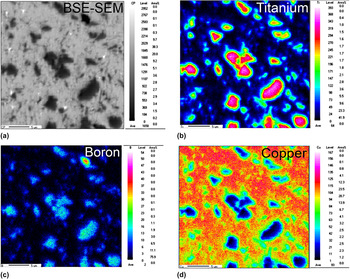
b) As per the studies conducted by Kwon et al.,Reference Kwon, Dudina, Korchagin and Lomovsky12 in which the highest density reported for Cu–57 vol% TiB2 is close to 94% ρth at a temperature of 950 °C for 30 min with pressure of 70 MPa, while the relative density obtained for Cu–10 wt% TiB2 composites sintered at 500 °C and 50 MPa pressure with 5 min holding time is close to ∼91% ρth (the present case). This decrement of 250 °C in temperature, 20 MPa pressure and 25 min of holding time obtainable in the present study can be considered as an advantage in terms of power consumption. To investigate for this enhancement in density, it was anticipated that apart from the reasons cited in point (a) above, the diffusion kinetics of the Cu–TiB2 system may be responsible and therefore, needs to be invoked herein. But according to the best of the authors’ knowledge, there is no standard data available for the diffusion of Cu in TiB2 or vice-versa. As a secondary option, a careful elemental analysis of the Cu–10 wt% TiB2 composite, sintered at 600 °C, was carried out by electron probe micro analyzer (EPMA) technique. Figure 8(a) presents the BSE-SEM micrograph and Figs. 8(b), 8(c), and 8(d) are the corresponding elemental maps for titanium, boron and copper, respectively. It is clearly evident that the TiB2 particles (dark contrast) are surrounded by a sheath rich in Cu content [Fig. 8(d), light green region around the blue patches]. The formation of this Cu-rich layer can also be justified from the thermodynamics point of view,Reference Veen19 according to which a solid surface with a liquid layer will become stable when its free energy (ΔF) becomes negative, as follows:
 $$\Delta F\left( {\rm{\delta }} \right) = {\rm{\rho }}L_{\rm{m}} {\rm{\delta }}\left( {1 - {T \over {T_{\rm{0}} }}} \right) + \Delta {\rm{\gamma }}({\rm{\delta }})\quad ,$$
 $$\Delta {\rm{\gamma }}\left( {\rm{\delta }} \right) = \Delta {\rm{\gamma }}_\infty (1 - e^{ - {{\rm{\delta }} \over {\rm{\xi }}}} )\quad ,$$
 $$\Delta {\rm{\gamma }}_\infty = ({\rm{\gamma }}_{{\rm{sl}}} + {\rm{\gamma }}_{{\rm{lv}}} - {\rm{\gamma }}_{{\rm{sv}}} ) \,\lt \,0\quad ,$$
where ρ is the density (assumed constant for both solid and liquid phases), L m is the latent heat of fusion, δ is the thickness of liquid film (and also ξ is found to be one monolayer), T 0 is the equilibrium bulk melting temperature and Δγ is the change in interfacial free energy.
(a) BSE–SEM micrograph and the corresponding elemental maps of (b) Ti, (c) B and (d) Cu for the Cu–10 wt% TiB2 composite sintered at 600 °C.

For pure Cu, γsv = 1592, γsl = 263, and γlv = 1310 (mJ/m2), making Δγ∞ < 0 and this contributes to the favorable free energy change toward the formation of liquid Cu layer on the solid Cu particles.
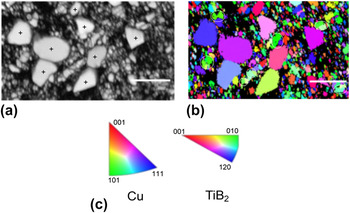
To further confirm the hypothesis of surface melting of Cu particles as proposed in point a) above, EBSD analysis of the Cu–10 wt% TiB2 composite sintered at 500 °C was carried out (Fig. 9). Figures 9(a), 9(b), and 9(c) show a band contrast image, the corresponding inverse pole figure (IPF) image taken along z-axis and standard triangles for Cu and TiB2, respectively. The coarser dispersion corresponds to TiB2 particles in the finer Cu-matrix. Some of the sintered islands of Cu grains have been marked with white circles/ellipses in Fig. 9(b). By noting the corresponding orientation of Cu grains (light green colored) from the standard triangle [Fig. 9(c)], the preferred orientation of Cu grains along the (110) face during the course of sintering process can be clearly realized. This will result in sintering of Cu/Cu particles lying in close proximity by surface melting. Furthermore, the formation of liquid layer onto the surface melted Cu particles, in the vicinity of TiB2 particles, will try to enclose them by rearrangement process—though not similar to LPS, which specifically occurs in the presence of a liquid phase. This engulfing of the TiB2 particles by a thin sheath of Cu-rich liquid layer may be responsible for the solid state sintering of the Cu–10 wt% TiB2 composite and consequently, the higher relative density achievable in the present study. Apart from this, Fig. 9(b) also shows the close particle–particle contact among some of the coarser TiB2 particles and Cu particles are not being trapped at TiB2/TiB2 interfaces. The evidence for necking or particle–particle bonding for TiB2 phase can therefore be confirmed from EBSD analysis.
EBSD micrograph of the Cu–10 wt% TiB2 composite sintered at 500 °C showing (a) band contrast image, (b) The corresponding IPF image taken along z-axis and (c) Standard triangles for the individual phases. Plus sign marks the TiB2 particles. White circles/ellipses mark the Cu particles. Micron marker equals 5 μm.

c) In LPS, it is necessary that the participating liquid phase should wet the other solid component i.e., the contact angle extended by the liquid phase over the solid surface must be less than 90°. If at any time during LPS, there is a change in this angle or more specifically, a transition from less than 90° to more than 90°, the liquid formed will start to dewet the solid phase. Alternatively, the liquid may move out of the powder compact as a result of the applied mechanical pressure (like in SPS), thereby creating porosity and a concomitant decrease in density.
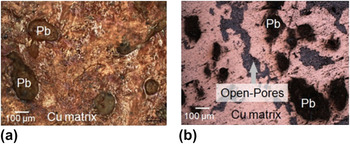
In the present work, Pb is present in liquid state, when Cu–10 wt% Pb is sintered at 400 °C or higher temperature. The effect of molten 10 wt% Pb on the densification kinetics of Cu–10 wt% TiB2–10 wt% Pb, therefore, needs to be considered. It has been reported in the literature that the interfacial energy between liquid Pb and solid Cu (γPb(l)/Cu(s)) is temperature dependent.Reference Felberbaum, Rossoll and Mortensen20 As reported by Empl et al.,Reference Empl, Felberbaum, Laporte, Chatain and Mortensen21 the liquid Pb does not wet Cu grains beyond 400 °C. Although Pb is present in the compact, it leads to a decrease in densification, since dewetting phenomena of Cu grains by liquid Pb can lead to considerable porosity formation. To confirm the exuding of Pb out of powder compact, a separate sample of Cu–10 wt% Pb was sintered at 500 °C at a pressure of 50 MPa. Figures 10(a) and 10(b) shows the photomicrographs, illustrating the presence of Pb nodules on the surface of the pellet before and after polishing. These observations clearly show the oozing of Pb out of the pellet, signifying that Cu grain boundaries do not get wet by liquid Pb. A large fraction of open pores terminating on the surface can also be seen. An important point to note here is that although Pb has exuded out of the compact, it still resides on the surface and can still be detected in the x-ray diffractograms of the composites sintered at 500 °C or higher.
Photomicrographs of surface of Cu–10 wt% Pb pellets after spark plasma sintered at 500 °C and 50 MPa: (a) before polishing and (b) after polishing.

Although the advantageous process of disordering of (110) face of Cu occurring at 427 °C can lead to an increase in density [see Fig. 7(a)], the simultaneous phenomena of dewetting of Pb on Cu surfaces at 500 °C or higher can outweigh the density increment and is responsible for the observed decrease in the relative density. The discussion made herein commensurate fairly well with our observations of changes in instantaneous relative density.
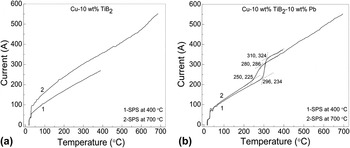
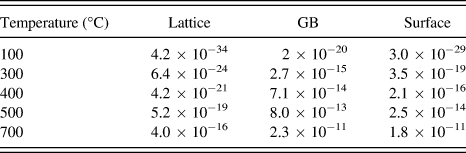
d) To further deconvolute the effect of the formation of liquid Pb phase and the various diffusion processes occurring in Cu particles on the densification kinetics of Cu–10 wt% TiB2 and Cu–10 wt% TiB2–10 wt% Pb composites, the variation of in situ current with respect to temperature was plotted and analyzed, as shown in Figs. 11(a) and 11(b). These data are recorded during SPS experiment and hence, in situ current values are reported. The selected sintering temperatures were restricted at the two extremes i.e., 400 and 700 °C to get a clear picture of the sintering kinetics. In addition, lattice, GB, and surface diffusivity values for Cu has been calculated using the standard data, as shown in Table II.Reference Brandes and Brook22Figure 11(a) shows the variation of current for Cu–10 wt% TiB2 composites, sintered at 400 and 700 °C and Fig. 11(b) reveals the current profile for Cu–10 wt% TiB2–10 wt% Pb composites, sintered at 400 and 700 °C. A cursory glance at these plots indicates that the incorporation of 10 wt% Pb in the Cu–10 wt% TiB2 composite [Fig. 11(a) versus Fig. 11(b)] has resulted in a step formation, which can be attributed to the corresponding enthalpy of melting of Pb being delivered by the electric current.
Plots of instantaneous current with temperature for (a) Cu–10 wt% TiB2 and (b) Cu–10 wt% TiB2–10 wt% Pb, respectively.

Values of different types of diffusion in copper (D, m2/sec) from T = 100–700 °C.
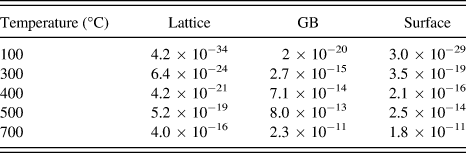
In case of the Cu–10 wt% TiB2 composite, the maximum temperature rise corresponds to ∼270 and 550 A for 400 and 700 °C temperatures, respectively. This can be explained on the basis that the various diffusivity values (lattice, GB, and surface) for Cu are orders of magnitude higher at 700 °C as compared to their corresponding values at 400 °C (Table II). Since diffusivity scales up with temperature [as exp(−Q/T), where Q is the activation energy and T is temperature], higher temperatures will lead to rapid densification by the creation of multiple channels for the flow of electric current through the bulk of the instantaneously densified Cu grains.
Again for the case of the Cu–10 wt% TiB2–10 wt% Pb composite, the current values should always be higher than that for the Cu–10 wt% TiB2 composite at respective temperatures, because it involves the enthalpy of melting of Pb being provided by the current. But as this was true for the sintering temperature of 400 °C (370 A for Pb-containing composites as against 270 A for composites without Pb), the same reasoning does not hold true, when SPS was carried out at 700 °C (current values being almost equal to 550 A for both the composites). This anomaly can well be explained by the fact that as molten Pb will exude out of the powder compact at temperature of around 400 °C (Sec. IV. C), there will not be sufficient Pb in the internal porosity network. Henceforth, the sintering kinetics in the Cu–10 wt% TiB2–10 wt% Pb composite will be governed by the Cu grains only. After the completion of the sintering, the resultant density of Cu–10 wt% TiB2–10 wt% Pb will be lower (85% ρth) compared to the Cu–10 wt% TiB2 composite (91% ρth), sintered at the same temperature.
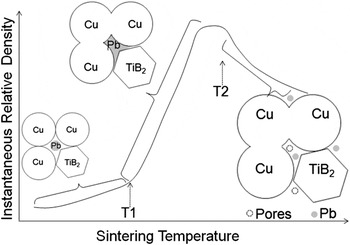
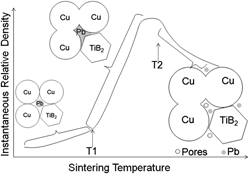
On the basis of the explanation made above in the points (a, b, and c), the process schematic has been schematically shown in Fig. 12. Such a schematic depicts the variation in instantaneous relative density with respect to sintering temperature for the Cu–TiB2–Pb system. Three different regions of different slopes have been identified here and transitional temperatures have been marked as T1 and T2. T1 corresponds to the disordering/surface melting temperature of the components and T2 is the critical temperature at which interfacial free energy (γCu(s)/Pb(l)) changes, mediated by the contact angle. The complete melting of one component occurs between T1 and T2. The phenomena of sintering—neck formation, grain growth and liquid formation with increasing temperature has also been exemplified in the adjacent schematics of powder compact (see Fig. 12).
Process schematic for densification of powder compact in the Cu–TiB2–Pb composite system.

e) Since oxides are generally of lower density than the parent element, it seems reasonable here to discuss their role and influence on the sinter density of Cu–TiB2–Pb composites. It can be seen from the XRD of ball-milled powders for each composite that Cu–10 wt% TiB2 powder does not show any oxide peak, but Cu–10 wt% TiB2–10 wt% Pb contains some minor Pb3O4 peaks. Also, Pb3O4 peaks cannot be seen in the Pb containing composites sintered at temperature 500 °C or beyond, since its melting point is 500 °C. The formation of TiO2 is therefore thermodynamically favored at sintering temperature of 500 °C or beyond, compared to Pb3O4 via the following chemical reaction:
 $${\rm{2TiB}}_{\rm{2}} + {\rm{Pb}}_{\rm{3}} {\rm{O}}_{\rm{4}} = {\rm{2TiO}}_{\rm{2}} + {\rm{3Pb}} + {\rm{4B}}\quad .$$
The thermodynamic feasibility of the above reaction is also evident from the ΔG versus T plots for Pb3O4 and TiO2 formation with TiO2 having lower ΔG values than Pb3O4 (Fig. 4). The relative intensities of Pb peaks centered at 2θ = 31.3, 52.25, and 62.1°, therefore, slightly increases for the composites sintered at or above 500 °C.
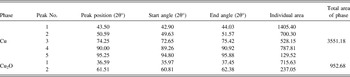
In case of Cu–10 wt% TiB2, the composite sintered at 400 °C shows major Cu2O peaks (∼2θ = 36.59 and 61.51°) and their respective intensities got diminished in composites sintered at 500, 600, and 700 °C. To look into the formation of Cu2O and its effect on the relative density of the composite, its volume fraction was quantified by measuring the area of the peaks and compared with respect to the areas of the Cu peaks. The area extended by the Cu2O is 952.68 units, which is ∼27% to that extended by the Cu peaks 3551.18 units (Table III). This manifests itself in the lowering of the relative density of the composite sintered at 400 °C, since Cu2O has a lower density (ρth = 6.0 gm/cc) than metallic Cu (ρth = 8.96 gm/cc).
Calculation of the area of diffractogram peaks of Cu–10 wt% TiB2 sample, SPS at 400 °C.

As a concluding remark, the above experimental findings suggest that the addition of low-melting metallic phase like Pb to the premixed Cu–TiB2 does not yield significantly higher density of more than 95% ρth, even when a superfast densification process like SPS is adopted. The parametric window of sintering temperature 500–700 °C, pressure 50 MPa and heating rate ∼90 °C/minute is to be strictly maintained to get >90% relative density for Cu–10 wt% TiB2 composites. The temperature dependent wetting behavior of Pb on Cu has an adverse effect on the densification. Nevertheless, extremely high hardness of close to 2 GPa was achieved. Further improvement in the sinter density as well as hardness can be realized if nanocrystalline powders as well as optimized TiB2 content are used.
V. CONCLUSIONS
The present work has demonstrated that it is possible to obtain Cu–10 wt% TiB2–10 wt% Pb composites with more than 90% relative density by tailoring SPS conditions. In particular, the following major conclusions can be drawn:
(1) A maximum sinter density of around 92% ρth is attained in Cu–10 wt% TiB2–10 wt% Pb composites at 400 °C. A relatively higher hardness of around 2 GPa is measured with the Cu–10 wt% TiB2–10 wt% Pb composite after SPS at 400 °C. Such a combination of sinter density and hardness after sintering at less than 500 °C has never been achieved in the conventionally processed Cu-based alloys and this establishes the efficacy of SPS as an advantageous consolidation process for metallic system.
(2) The observed changes in the densification behavior for the Cu–10 wt% TiB2–10 wt% Pb composite is explained on the basis of exuding of molten Pb out of the powder compact at temperatures greater than 400 °C owing to change in surface energy.
(3) The ultrafine grained microstructure is characterized by dispersion of Pb as a semi-continuous phase in the Cu-matrix with TiB2 as dispersed phase with a few close contacts at TiB2/TiB2 interfaces, as revealed using the EBSD technique. Despite the predominant presence of starting phases (Cu/Pb/TiB2), the detectable presence of various oxides (Cu2O, TiO2, Pb3O4) has been rationalized using thermodynamic analysis.
(4) The sintering kinetics is explained using the phenomena of surface melting of particles before reaching the bulk melting temperature. In particular, the preferential melting event occurring at the (110) surface of the Cu particles below its equilibrium melting temperature and consequent sintering has been exemplified for Cu–10 wt% TiB2 composite, spark plasma sintered at 500 °C.
ACKNOWLEDGMENTS
The use of SPS facility at IIT Kanpur, procured with partial funding from the Department of Science and Technology, Government of India as well as CARE funding from IIT Kanpur, is gratefully acknowledged. The authors would also like to acknowledge the help rendered by Mr. C.S. Tiwary in obtaining EPMA results and Drs. Ubhi Singh and Ritwik Basu for EBSD analysis.