


Introduction
Although Gallium Nitride (GaN) high electron mobility transistors (HEMTs) are regarded as one of the most promising radio frequency (RF) power transistor technologies thanks to their high-voltage high-speed characteristics, they are still known to be prone to trapping effects, which hamper achievable output power and linearity. The trapping effects can normally be split into two groups: drain-lag effects are caused by the charge capture and emission processes of the donor traps in the buffer layers below the two-dimensional electron gas (2DEG) and gate-lag effects are mainly due to the presence of negative charges trapped on the semiconductor surfaces of the epitaxial layers above the 2DEG [Reference Rudolph, Fager and Root1,Reference Binari, Klein and Kazior2]. For some devices, e.g., in our case, the gate-lag effects are so weak, that it is almost impossible to distinguish between the gate-lag effects and thermal effects even by means of pulsed measurements [Reference Luo, Bengtsson and Rudolph3]. Thus, the drain-lag modeling remains the only critical issue regarding trapping effects modeling in the nonlinear modeling field.
In recent years, a significant interest on modeling trapping effects can be observed within the microwave community. As a result, various trap models [Reference Jarndal and Kompa4–Reference Jardel, Groote, Reveyrand, Jacquet, Charbonniaud, Teyssier, Floriot and Quéré8] have been published. These models are most accurate since they are able to fully predict the impact of trapping effects on nonlinear device performance. However, until now, none of them was implemented in commercial electronic design automation tools. One of the main reasons is the use of a huge number of fitting parameters or some bias-dependent parameters, which are extremely hard to be described accurately. With this in mind, in addition to modeling accuracy, reducing the parameter number and the parameter extraction effort is also necessary in the trapping effect modeling.
This paper proposed a simple drain-lag model, which only employs four easily-determined fitting parameters. This model is combined with two drain-lag models. The first drain-lag model was published in [Reference Luo, Bengtsson and Rudolph3] (parameter-scaling drain-lag model), and it has been proven to predict device performance well for various trap states. It relies on the scaling of model parameters with quiescent drain voltage which yields convenient parameter extraction. Another benefit of this model is, it reduces to the standard Chalmers model with optimized parameters for fixed drain bias. However, it is of little use in describing the typical kink around the quiescent drain voltage from pulsed IV curves or predicting the RF output conductance under large-signal condition. Thus, the drain-lag model which was initially published in [Reference Jardel, Groote, Reveyrand, Jacquet, Charbonniaud, Teyssier, Floriot and Quéré8] (Quéré drain-lag model), was integrated to overcome these drawbacks. The Quéré drain-lag model employs a pseudo gate-source voltage at the input of the current source. The pseudo gate-source voltage is related to a fitting parameter k, which is linked to the density of trap charges and is assumed to be linearly dependent on the output current [Reference Jardel, Groote, Reveyrand, Jacquet, Charbonniaud, Teyssier, Floriot and Quéré8]. However, our investigations have shown that, instead of the complicated expression of parameter k as presented in Quéré drain-lag model, a constant value should bring the same modeling performance if combined with the parameter-scaling drain-lag model. This can significantly simplify the model parameters extraction process.
This approach is presented here. The drain-lag model parameters are determined by fitting the model against the measured pulsed output current i ds and the i ds-related parameters, e.g., transconductance g m and output conductance G ds, that are extracted from the pulsed S-parameter measurements. Using these measurements allows to achieve high modeling accuracy under different trap states without influence of self-heating.
The paper is organized as follows. In the section “Device structure”, we briefly describe the device-under-test, which is a 250 μm AlGaN/GaN HEMT in a 250 nm GaN-on-SiC process. In the section “Model development”, following the brief explanation of the modified Chalmers (Angelov) model equations of the nonlinear drain-source current, the drain-lag model and its impact on the output conductance G ds are described. In the section “Drain-lag model parameters extraction”, the extraction procedure for the drain-lag model parameters is described in detail. In thesection “Model validation”, the proposed drain-lag model is verified by comparing between measured and simulated pulsed IV characteristics, pulsed S-parameters, load pull performance under different bias conditions, and low-frequency large-signal behavior. Finally, the section “Drain-lag model parameters extraction” presents the conclusion.
Device structure
The drain-lag model has been determined for a 250-μm gatewidth AlGaN/GaN HEMT fabricated employing FBH GaN technology on 4-inch wafers. The technology is based on an Al0.25 Ga0.75 N/GaN: Fe epitaxial structure grown on 4H semi-insulating SiC substrate. The transistor hasa gate of 250 nm length defined by electron beam lithography in the first SiNx layer and encapsulated by the second SiNx layer. Both layers are deposited by plasma enhanced chemical vapor deposition [Reference Chevtchenko, Kurpas, Chaturvedi, Lossy and Wurfl9].
Model development
This paper is based on the Chalmers (Angelov) model [Reference Angelov, Bengtsson and Garcia10,Reference Angelov, Desmaris, Dynefors, Nilsson, Rorsman and Zirath11], which is a well-known and frequently used large-signal model for GaN HEMTs. In this work, the extrinsic parameters are determined by using cold-FET S-parameter data [Reference Dambrine, Cappy, Heliodore and Playez12]. Moreover, the drain-source current and charge model parameter extraction routine is based on pulsed S-parameter measurements for different drain voltages QV ds = 8, 15, and 28 V. This ensures the modeling accuracy if the transistor operates at the bias equal to QV ds [Reference Luo, Bengtsson and Rudolph13].
The topology of the modified large-signal model for the investigated GaN HEMT is shown in Fig. 1. As seen in this figure, a thermal sub-circuit and a drain-lag sub-circuit are employed to describe the self-heating and drain-lag effects. The thermal resistance R th can be extracted by using pulsed IV measurements [Reference Jenkins and Rim14], and the thermal time constant τth = R th · C th can be obtained by long time duration pulsed drain measurements [Reference Yuk, Branner and McQuate5] or simply set as 1 ms in this paper [Reference Jarndal and Kompa4]. Moreover, the constant resistance-capacitance (RC) branch in parallel to I ds [Reference Camacho-Peñalosa and Aitchison15], which is used in the standard Chalmers model to describe the g ds dispersion, was removed in this modified model, since it is only valid under small-signal condition, but not for large-signal condition [Reference Rudolph, Fager and Root1]. The drain-lag sub-circuit used here was presented in [Reference Jardel, Groote, Reveyrand, Jacquet, Charbonniaud, Teyssier, Floriot and Quéré8] and is shown in Fig. 2.
Large-signal model topology for GaN HEMT with thermal and trapping sub-circuits.

Detailed topology of drain-lag model with two input voltages: v gs and v ds, and two output voltages v gs,eff and v ds,eff [Reference Jardel, Groote, Reveyrand, Jacquet, Charbonniaud, Teyssier, Floriot and Quéré8].

Nonlinear drain-source current
As mentioned before, the Chalmers model was applied to model the drain-source current. The equation of the main current source including drain-lag effects can be expressed as:
 $$\eqalign{I_{ds} &= I_{\,pk0}(v_{ds,eff})\cdot(1 + \tan {\rm h}(\psi))\tan {\rm h}(\alpha\cdot v_{ds}) \cr & \quad\cdot(1 + \lambda(v_{ds,eff})\cdot v_{ds} + L_{sb0}\cdot e^{(v_{dg} - V_{tr})}),}$$
where I pk0 is the drain current at maximum transconductance g m. λ is the channel length modulation parameter. Both of them depend on v ds,eff, which is the output voltage of the drain-lag sub-circuit. v ds and v dg denote the drain-source and drain-gate voltage of transistor, respectively. L sb0 is the breakdown model parameter. V tr represents the threshold of breakdown voltage of transistor. α is the saturation voltage parameter and ψ is in general a power series function. They can be described as
 $$\eqalign{\psi &= P_{1}\cdot(v_{gs,eff}-V_{\,pkm}) + P_{2}\cdot(v_{gs,eff}-V_{\,pkm})^{2} \cr &\quad + P_{3}\cdot(v_{gs,eff}-V_{\,pkm})^{3}}$$
 $$\eqalign{\alpha = \alpha _{r} + \alpha _{s}(v_{ds,eff})\cdot(1+tanh(\psi)),} $$
where P 1, P 2, and P 3 are fitting parameters, which contribute to the prediction of measured ‘bell-shaped’ transconductance g m structure. αr indicates the slope at low voltage and low current region. αs represents the slope at low voltage and high current region. αr is constant while αs depends on v ds,eff. v gs,eff is another output voltage of the drain-lag sub-circuit. V pkm can be described as
 $$V_{\,pkm} = V_{\,pks} - D_{vpks} + D_{vpks}\cdot \tan {\rm h}(\alpha _{s}(v_{ds,eff})\cdot v_{ds}), $$
where V pks is the gate voltage at which the maximum of transconductance g m. D vpks is the difference between the gate voltages measured at the drain voltage in the saturated region and close to zero.
Moreover, the equation of the parameter-scaling drain-lag model can be described as [Reference Luo, Bengtsson and Rudolph3]
 $$\eqalign{\ I_{\,pk0}(v_{ds,eff}) &= I_{\,pk0,cons} \cdot (1 + Tr_{Ipk0} \cdot v_{ds, {\rm eff}} ),} $$
 $$\eqalign{\alpha_{s}(v_{ds,eff}) &= \alpha_{s,cons} \cdot (1 + Tr_{alphas} \cdot v_{ds,{\rm eff}}),} $$
 $$\eqalign{\lambda(v_{ds,eff}) &= \lambda_{cons} \cdot (1 + Tr_{lambda} \cdot v_{ds, {\rm eff}}),} $$
where I pk0,cons, αs,cons, λcons, Tr Ipk0, Tr alphas, and Tr lambda are constants for the drain-lag model. The trapping time constants for emission and capture process are given by
 $$\eqalign{\tau_{emission} &= R_{emission} \cdot C,}$$
 $$\eqalign{\tau_{capture} &= R_{capture} \cdot C,}$$
where τemission ≫ τcapture.
Drain-lag effects
The new drain-lag model used here consists of two parts: the first part, the parameter-scaling drain-lag model, expressed by (5)–(7), has been fully described in [Reference Luo, Bengtsson and Rudolph3,Reference Luo, Bengtsson and Rudolph16]. This part takes into account the current variation under different trap states by adjusting the trap-sensitive parameters, I pk0, αs, and λ, to different traps. However, this model still has some drawbacks. On one hand, it cannot account for the difference between output conductance under dc and RF conditions, which is described by a constant RC branch in standard Chalmers model. On the other hand, its ability to describe the typical kink, which can be clearly observed around quiescent bias point in pulsed IV characteristics and is mainly due to the current difference between capture and emission process, is still very limited. Hence, we employed another element to overcome these drawbacks, the Quéré drain-lag model.
The detailed drain-lag sub-circuit for the Quéré drain-lag model has been described in [Reference Jardel, Groote, Reveyrand, Jacquet, Charbonniaud, Teyssier, Floriot and Quéré8] and is shown in Fig. 2. The first output voltage v ds,eff from the envelope detector represents the modified v ds related to lagged trap states and is also used to determine three drain current model parameters, I pk0, αs, and λ, with respect to different trap states (see in (5)–(7)).
The second output voltage v gs,eff is only applied in the Quéré drain-lag model and is related to the capture or the emission of charges by the traps. The initial equation of v gs,eff can be expressed as
 $$v_{gs,eff} = k\cdot (v_{ds} - v_{ds,eff}) + v_{gs}, $$
where k is related to the density of trap charges and is assumed in [Reference Jardel, Groote, Reveyrand, Jacquet, Charbonniaud, Teyssier, Floriot and Quéré8] to be dependent on the estimated output current Ids EST. However, the mathematical formulation of the bias dependence of k is tedious. Hence, in order to simplify the expression of k, the parameter-scaling drain-lag model was adopted to pre-estimate the impact of traps. In this way, the parameter k is now related to the rest of the impact of traps, which cannot be described by the parameter-scaling drain-lag model. It will be shown in the section “Model development” that the value of k tends to be constant instead of following a complicated function as introduced in [Reference Jardel, Groote, Reveyrand, Jacquet, Charbonniaud, Teyssier, Floriot and Quéré8].
Output conductance
Output conductance G ds represents the change of the drain current with respect to the drain voltage. A drain-lag model is supposed to be able to provide a correction term ΔG ds to take into account the difference between the output conductance extracted from the small-signal RF characteristics and that obtained from direct current (DC) measurements:
 $$\Delta G_{ds} = G_{ds,RF} - G_{ds,DC}.$$
In the standard Chalmers model, a correction term ΔG ds to the dc output conductance G ds,DC, which is given by the model parameters of the main current source found in (1), is supplied by an RC branch. However, the correction term ΔG ds is always constant and equals 1/R independent of the bias, that makes the standard Chalmers model problematic under large-signal condition.
For the parameter-scaling drain-lag model, the correction term ΔG ds is related to the partial derivative of three trap state dependent parameters, I pk0, αs, and λ, with respect to drain voltage v ds, e.g., in the case of I pk0:
 $$\displaystyle{\partial I_{\,pk0}(v_{ds,eff}) \over \partial v_{ds}} = I_{\,pk0,cons}\cdot Tr_{Ipk0} \cdot {\partial v_{ds,eff}\over \partial v_{ds}}, $$
where v ds,eff is a time-relevant parameter and can be expressed as:
 $$v_{ds,eff} = \left\{ \matrix{v_{ds}(t_{0}) - \Delta v_{ds}\cdot (1 - e^{{-t}/{\tau _{emission}}}) \quad {\rm if} v_ds \lt 0 \hfill \cr v_{ds}(t_{0}) - \Delta v_{ds}\cdot (1 - e^{{-t}/{\tau _{capture}}}) \quad\, {\rm if} v_{ds} \gt 0 \hfill},\right.$$
where v ds (t 0) and Δv ds represent the value of v ds before v ds variation and the instantaneous change of v ds, respectively. Actually, for pulsed measurements, the value of v ds (t 0) equals the quiescent drain voltage QV ds, and the value of the time t equals the used pulse length t pulse, in this work, t pulse = 250 ns ≪ τemission. Thus, we have:
 $$e^{{-t}/{\tau _{emission}}}\approx 1 \Rightarrow v_{ds,eff} \approx QV_{ds} \ (const.). $$
As a consequence, ΔG ds now can be given by:
 $${\partial v_{ds,eff}\over \partial v_{ds}} \approx 0 \Rightarrow \Delta G_{ds} \approx 0.$$
Therefore, we can assume that G ds or G ds-related parameters, e.g., S 22, extracted from the Chalmers model with the parameter-scaling drain-lag model and the Chalmers model without RC branch should be very close in the emission process. Figure 3(a) shows the similar discrepancy between measured and simulated S 22 by using the Chalmers model with the parameter-scaling drain-lag model and the Chalmers model without RC branch, which supports our suggestion.
Comparison between measured (black dots) and modeled (lines) pulsed S-parameter S 22 biased at v gs = −2 V and v ds = 14 V at a quiescent bias point of QV gs = −2.3 V and QV ds = 28 V up to 20 GHz using the Chalmers model (a) without RC branch (red solid line) and with the parameter-scaling drain-lag model (blue dashed line) (b) with the combined drain-lag model with extracted k=0.015 (red solid line).

To overcome these problems we employ the Quéré drain-lag model. Now, the G ds,RF can be formulated as:
 $$\eqalign{G_{ds,RF} = & I_{\,pk0}(v_{ds,eff})\cdot {A \cdot C \over \cosh ^2(\alpha v_{ds})} \cdot ( \alpha_{s}(v_{ds,eff})\cdot D \cr & + \alpha) + I_{\,pk0}(v_{ds,eff})\cdot B \cdot C \cdot D \cr & + I_{\,pk0}(v_{ds,eff})\cdot A\cdot B\cdot \lambda(v_{ds,eff}),} $$
where
 $$A = 1 + \tan {\rm h}(\psi)$$
 $$B = \tan {\rm h}((\alpha \cdot v_{ds})$$
 $$C = 1 + \lambda(v_{ds,eff}) \cdot v_{ds} + L_{sb0}\cdot e^{(v_{dg} - V_{tr})}$$
 $$\eqalign{& D = {1 \over \cosh^2(\psi)}(P_{1}\cdot {\partial v_{gs,eff} \over \partial v_{ds}} + 2\cdot P_{2} \cdot (v_{gs,eff}-V_{\,pkm}) \cdot \cr & \quad {\partial v_{gs,eff} \over \partial v_{ds}}+3\cdot P_{3} \cdot (v_{gs,eff}-V_{\,pkm})^2 \cdot {\partial v_{gs,eff} \over \partial v_{ds}})} $$
 $${\partial v_{gs,eff} \over \partial v_{ds}} = k - k\cdot {\partial v_{ds,eff}\over \partial v_{ds}} =k.$$
According to these equations, it is evident that the parameter k could be simply extracted from the G ds of the equivalent small-signal model. The detailed extraction procedure will be discussed in the next section.
Drain-lag model parameters extraction
Now, we give an overview of the extraction of the drain-lag model parameters.
The emission time constants extraction process and results have been already addressed in detail in [Reference Jardel, Groote, Reveyrand, Jacquet, Charbonniaud, Teyssier, Floriot and Quéré8,Reference Nunes, Gomes, Cabral and Pedro17]. In this work, the emission time constants for the HEMTs of our process is known to be in the range of 1–20 μs, which is well in line with the literature [Reference Jardel, Groote, Reveyrand, Jacquet, Charbonniaud, Teyssier, Floriot and Quéré8,Reference Huang, Zhong, Wu and Guo18]. As we are treating extremely narrowband signals, it is the sole purpose of the time-constant to distinguish between DC and RF signals. In order to apply the model to broadband applications, it needs to be considered that it is highly likely that drain-lag and thermal time-constants lie within the baseband and significantly impact device performance. In these cases, it is advisable to determine the exact value of the time constant as presented in [Reference Jardel, Groote, Reveyrand, Jacquet, Charbonniaud, Teyssier, Floriot and Quéré8,Reference Nunes, Gomes, Cabral and Pedro17]. The capture time constants are generally too fast to be measured. Hence, one does not need to determine them exactly, as long as the emission time constant is much longer than the capture time constant. In this work, the emission time constant is set as τemission = R emisson C = 10 μs, while the capture time constant is set as τcapture = R capture C = 1 ns. Therefore, the number of drain-lag model parameters added in standard Chalmers model without the constant RC branch can be reduced to 4, namely, Tr ipk0, Tr alphas, Tr lambda, and k. The extraction procedure for these parameters can now be split into two parts: (1) parameters Tr ipk0, Tr alphas, Tr lambda extraction; (2) parameter k extraction.
Extracting parameter-scaling drain-lag model parameters
The extraction procedure for the parameters of the parameter-scaling drain-lag model, i.e., Tr ipk0, Tr alphas, Tr lambda, I pk0,cons, αs,cons, and λcons, has been discussed in [Reference Luo, Bengtsson and Rudolph3]. Here, the parameters are extracted from pulsed S-parameter measurements at different quiescent drain voltages QV ds = 8 V, 15 V, and 28 V and a constant QV gs = −2.3 V. For each measurement condition, a standard Chalmers model was made by fitting (1) the drain-source current model against the measured drain-source current along the pulsed S-parameter measurement and (2) the transconductance g m extracted from the pulsed S-parameter measurements. Only three parameters have to be adjusted if the quiescent drain-source voltage varies: I pk0, αs, and λ which are proven sensitive to traps. Our investigations revealed that these parameters show a rather linear dependence on the quiescent drain voltage, as plotted in Fig. 4. The parameters Tr ipk0, Tr alphas, and Tr lambda can then be simply extracted from the slope of the changes of parameters I pk0, αs, and λ versus QV ds. The y-axis intersection values provide the extracted values for I pk0,cons, αs,cons, and λcons. The resulting values for these drain-lag model parameters are given in Table 1.
Extracted values of the Chalmers model parameters I pk0, αs, and λ depending on pulse quiescent drain voltages QV ds.

Extracted values of drain-lag model parameters

Extracting parameter k
As mentioned before, the parameter k can be determined by fitting the model against the value G ds of the small-signal model extracted from pulsed multi-bias S-parameter measurements. Considering the importance of traps for the extraction of k, it is necessary to determine k under different trap states. Hence, the pulsed multi-bias S-parameter measurements at different quiescent drain voltages QV ds = 8, 15, and 28 V are presented here.
Figure 5 shows the extracted values of k as a function of v gs and v ds for the combined drain-lag and the Quéré drain-lag model. From the extracted values of k against v gs, it can be clearly observed that the extracted k for the combined drain-lag model shows a smooth and quasi-constant value for v gs > −2 V at each trap state, while that for the Quéré drain-lag model rises with increasing v gs.
Extracted values of k as a function of v gs at v ds below QV ds (at the left-hand side) and function of v ds at v gs = 0 V (at the right-hand side). k is extracted by fitting the model against pulsed I ds and G ds at QV ds = 28, 15, and 8 V.(black solid lines: for combined drain-lag model, blue crosses: for Quéré drain-lag model).

In this work, the pulsed measurements with a pulse length of 250 ns were used under the assumption that the device is free from the self-heating and drain-lag effects [Reference Jarndal, Markos and Kompa19]. However, the assumption does not correspond with the reality, since the trapping (capture process) time constant lies normally in nanosecond range that is much shorter than the pulse length, while the detrapping (emission process) time constant is of microsecond level that is longer than the pulse length, which means that only the capture process will occur in the pulsed measurements. With this in mind, the curves of extracted values of k against v ds can be split in two cases:
1) v ds < QV ds: The drain-source voltage is pulsed down during a pulse, and the slow emission process predominates for the traps. In this process, the voltage v ds,eff in (10) presents a slow voltage transient from QV ds to dynamic v ds and should be considered different from the dynamic v ds in the short pulse, which puts the parameter k in a critical position of the i ds description. Hence, in the extraction of k, not only extracted G ds but also measured pulsed i ds should be accounted for in the region v ds < QV ds, otherwise a mismatch for the IV characteristics as shown in Fig. 6 may come up. As illustrated in Fig. 5, it is evident that the extracted values of k for combined drain-lag model tend to be constant thanks to the prediction of the behavior of the related traps through the parameter-scaling drain-lag model according to (5)–(7). In contrast, the parameter k exhibits a rather complicated behavior for the Quéré drain-lag model.
2) v ds > QV ds: The drain-source voltage is pulsed up. Hence, the fast capture process predominates, and the voltage v ds,eff changes quickly from QV ds to dynamic v ds in the pulse. In this situation, the parameter k does not influence the output current i ds any more, and the traps are now dependent on the related dynamic voltages (v gs and v ds), which are same for the combined and the Quéré drain-lag model. Hence, the extracted values of k are the same.
Measured (circles) and modeled (lines) pulsed I ds and G ds for v ds = 3 V at QV ds = 28 V with different k extracted by fitting the model against only G ds (blue lines) and against both I ds and G ds (black marked lines).

Model validation
After modeling the drain-lag effects, the augmented Chalmers model including the drain-lag model was implemented in a Verilog-A design kit for the ADS simulator [20]. A large signal model extracted using the procedure described previously has been validated by comparing the simulations with measurements of a further transistor type, performed on a HEMT with 250 μm finger width fabricated on the 0.25 μm GaN-on-SiC process of the Ferdinand-Braun-Institut, Leibniz-Institut für Höchstfrequenztechnik [Reference Rudolph, Doerner, Ngnintedem and Heinrich21].
Pulsed IV measurements
First, the pulsed IV characteristics, which were obtained along the pulsed multi-bias S-parameter measurements, were measured. To validate the capability of the model in predicting the drain-source current under various trap states, three different quiescent drain voltages QV ds = 28, 15, and 8 V were used. Furthermore, in order to reduce the impact of self-heating effects, the pulse length was chosen shorter than the time constants associated with self-heating, in our case: the pulse length is 250 ns.
Figure 7 shows a comparison between modeled pulsed I/V characteristics by using the standard Chalmers model with RC sub-circuit (blue marked lines), the parameter-scaling drain-lag model (gray dashed lines) and the combined drain-lag mode (black solid lines). Here, three standard Chalmers models were separately extracted by using pulsed S-parameter measurements with these different QV ds, which enables them to achieve a good fit of the pulsed drain current i ds. However, on one hand, the good fit is confined to v ds < QV ds, since the process of capture is not considered in the model, on the other hand, the pulsed drain current i ds becomes negative in a part of the simulated IV networks, which is non-physical, this is because the correction term ΔG ds provided by the RC branch is always constant, even in the low v gs and low v ds region. In the situation of using the parameter-scaling drain-lag model, although the general fit is acceptable and a good modeling accuracy is achieved around the quiescent bias, the accuracy of prediction of typical kink in the pulsed I/V curves observed around v ds = QV ds is still limited, and, even more pronounced, the model cannot describe the knee walkout effect. However, these problems of the both models have been obviously solved by using the new drain-lag model described previously.
Pulsed IV measurements for v gs from − 3 to 1 V with 0.5 V steps at QV ds = 28, 15, and 8 V, pulse length is 250 ns (symbols), pulsed simulations in the same conditions by using the standard Chalmers models extracted from pulsed S-parameter measurements at QV ds = 28, 15, and 8 V (blue marked lines), the parameter-scaling drain-lag model (gray dashed lines) and the combined drain-lag model (black solid lines).

Pulsed S-parameter measurements
Pulsed S-parameters were measured for each bias of the IV characteristic illustrated in Fig. 7 and also at different quiescent drain voltages QV ds = 8, 15, and 28 V. To verify the models extracted with these S-parameters, we should focus on the two following regions according to different processes of drain-lag effects:
a) if the dynamic v ds is below the quiescent drain voltages QV ds, the drain voltage is reduced during a pulse. In this case, the emission process dominates for drain-lag-related traps and the traps remain overcharged related to the QV ds. Figure 8(a) shows the measured pulsed S-parameters biased at v ds = 8 V below QV ds = 15 V versus that simulated by the Chalmers model with the standard Chalmers model (blue marked lines), the parameter-scaling drain-lag model (dashed lines), and with the combined drain-lag model (black solid lines). In this figure, it is evident that the impact of kink effect can be observed in the output scattering parameter (i.e., S22). As well known, this effect is mainly ascribable to the high values of transconductance that inherently characterize the GaN HEMT technology [Reference Crupi, Raffo, Caddemi and Vannini22]. The good modeling performance of S 11 and S 12 using all of these three models indicate the good agreement of the intrinsic capacitances C gs and C gd. Moreover, it is well known that S 21 is basically influenced by the drain current. Therefore, the more correspondence with the simulated S 21 using the standard Chalmers model and the combined drain-lag model testifies the better drain current modeling accuracy as shown in Fig. 7. Moreover, it can be clearly observed that the parameter-scaling drain-lag model fails to predict S 22, which is strongly related to the output conductance G ds. This problem can be solved if a correction term ΔG ds is provided, e.g., by the RC branch of the standard Chalmers model or by the parameter k of the combined drain-lag model.
b) if the dynamic v ds is higher than the quiescent drain voltages QV ds, the drain voltage is increased during a measurement pulse period. In this case, the capture process predominates and the response time for the drain voltage change is very short. The S-parameters measured under this condition can be considered very close to the ones measured under static condition without self-heating. Figure 8(b) presents the measured and simulated pulsed S-parameters at v ds = 22 V. The discrepancies between measured and simulated pulsed S-parameters by using the standard Chalmers model further testify its uselessness for the capture process. For the use of the parameter-scaling drain-lag model and the combined drain-lag model, a similar situation of case (a) can be clearly observed: a significantly improved fit for S 22 is obtained by using the combined drain-lag model.
Measured (red dots) and simulated (lines) pulsed S-parameters from 400 MHz to 40 GHz for QV ds = 15 V and QV gs = −2.3 V at (a) v ds = 8 V, v gs = −2 V and (b) v ds = 22 V, v gs = −2 V. (blue lines with crosses: the standard Chalmers model, black lines with triangles: the parameter-scaling drain-lag model, black solid lines: the combined drain-lag model).

Load pull measurements
To further verify this large signal model, load pull measurements at 8, 15, and 28 V and at 8 GHz were performed. The source and load impedances were chosen as optimum impedances for providing maximum output power. Furthermore, the impedances at the second harmonic were also supplied in the simulation in order to better reproduce the measurement condition.
The impact of trapping effects on the average output drain-source current, especially drain-lag effects, is particularly obvious, since the trapping effects significantly hamper the achievable output power and degrade the output current. The constant RC branch parallel to i ds, which was employed in the standard Chalmers model, was supposed to describe this impact of trapping effects. However, as can be seen in Fig. 9, its ability to describe the trapping effects is still very limited, even the used standard Chalmers models were especially extracted by using pulsed S-parameter measurements with QV ds same as the bias condition of load pull measurement, which can improve the modeling accuracy [Reference Luo, Bengtsson and Rudolph13].
Measured and simulated Gain, PAE, and mean I ds as a function of input power P in at 8 GHz for v ds = 28, 15, and 8 V, (black dots: measurements, black solid lines: simulation with the combined drain-lag model, red marked lines: simulation with the parameter-scaling drain-lag model, blue dashed lines: simulation with standard Chalmers models extracted from pulsed S-parameter measurements at QV ds = 28, 15, and 8 V, respectively).

The parameter-scaling drain-lag model leads to a significant improvement of prediction accuracy for power added efficiency (PAE) and mean output current, especially at higher V ds condition, where the impact of drain-lag effects is more pronounced. However, at the same time, more improvements of prediction of mean output current could be expected by using the combined drain-lag model.
Moreover, the parameter-scaling drain-lag model fails to predict the gain in the linear region due to the mismatch of the S-parameter, i.e., S 22 as shown in Fig. 3, while a good agreement in predicting the gain in the linear region has been achieved by using the combined drain-lag model.
Low-frequency large-signal network analyzer (LSNA) measurements
In order to further validate the accuracy of the proposed model under actual operating conditions, LSNA measurements [Reference Raffo, Di Falco, Vadalà and Vannini23] were performed at low-frequency (i.e., 2 MHz). This operating frequency, chosen to lay above the cut-off frequency of dispersive effects, allows focusing on the correct evaluation of the I/V model, avoiding the presence of linear and nonlinear dynamic effects. In this way the impact of the low frequency dispersion effect, i.e., mainly the trapping effect, can be well isolated.
Figure 10 illustrates the load lines synthesized during the 2 MHz LSNA measurements at a bias point of v ds,0 = 28 V and v gs,0 = −2.3 V. For each load line, the gate incident signal is a sinusoidal wave with a constant amplitude of 1.15 V, chosen to dynamically reach v gs = 0 V (i.e., since the FET input port at 2 MHz behaves as an open circuit, the gate voltage amplitude is twice the gate incident amplitude), whereas the amplitude of the drain incident wave is swept with values from 4 to 29 V. Compared with the dc IV characteristic at v gs,0 = 0 V, the impact of the dispersive phenomena related to traps can be clearly observed.
The load lines (red solid lines) synthesized during the low-frequency LSNA measurement. A bias point of v ds,0 = 28 V and v gs,0 = −2.3 V is studied. The measured dc IV characteristics (dashed lines) are also shown with the IV characteristic at v gs,0 = 0 V is highlighted.

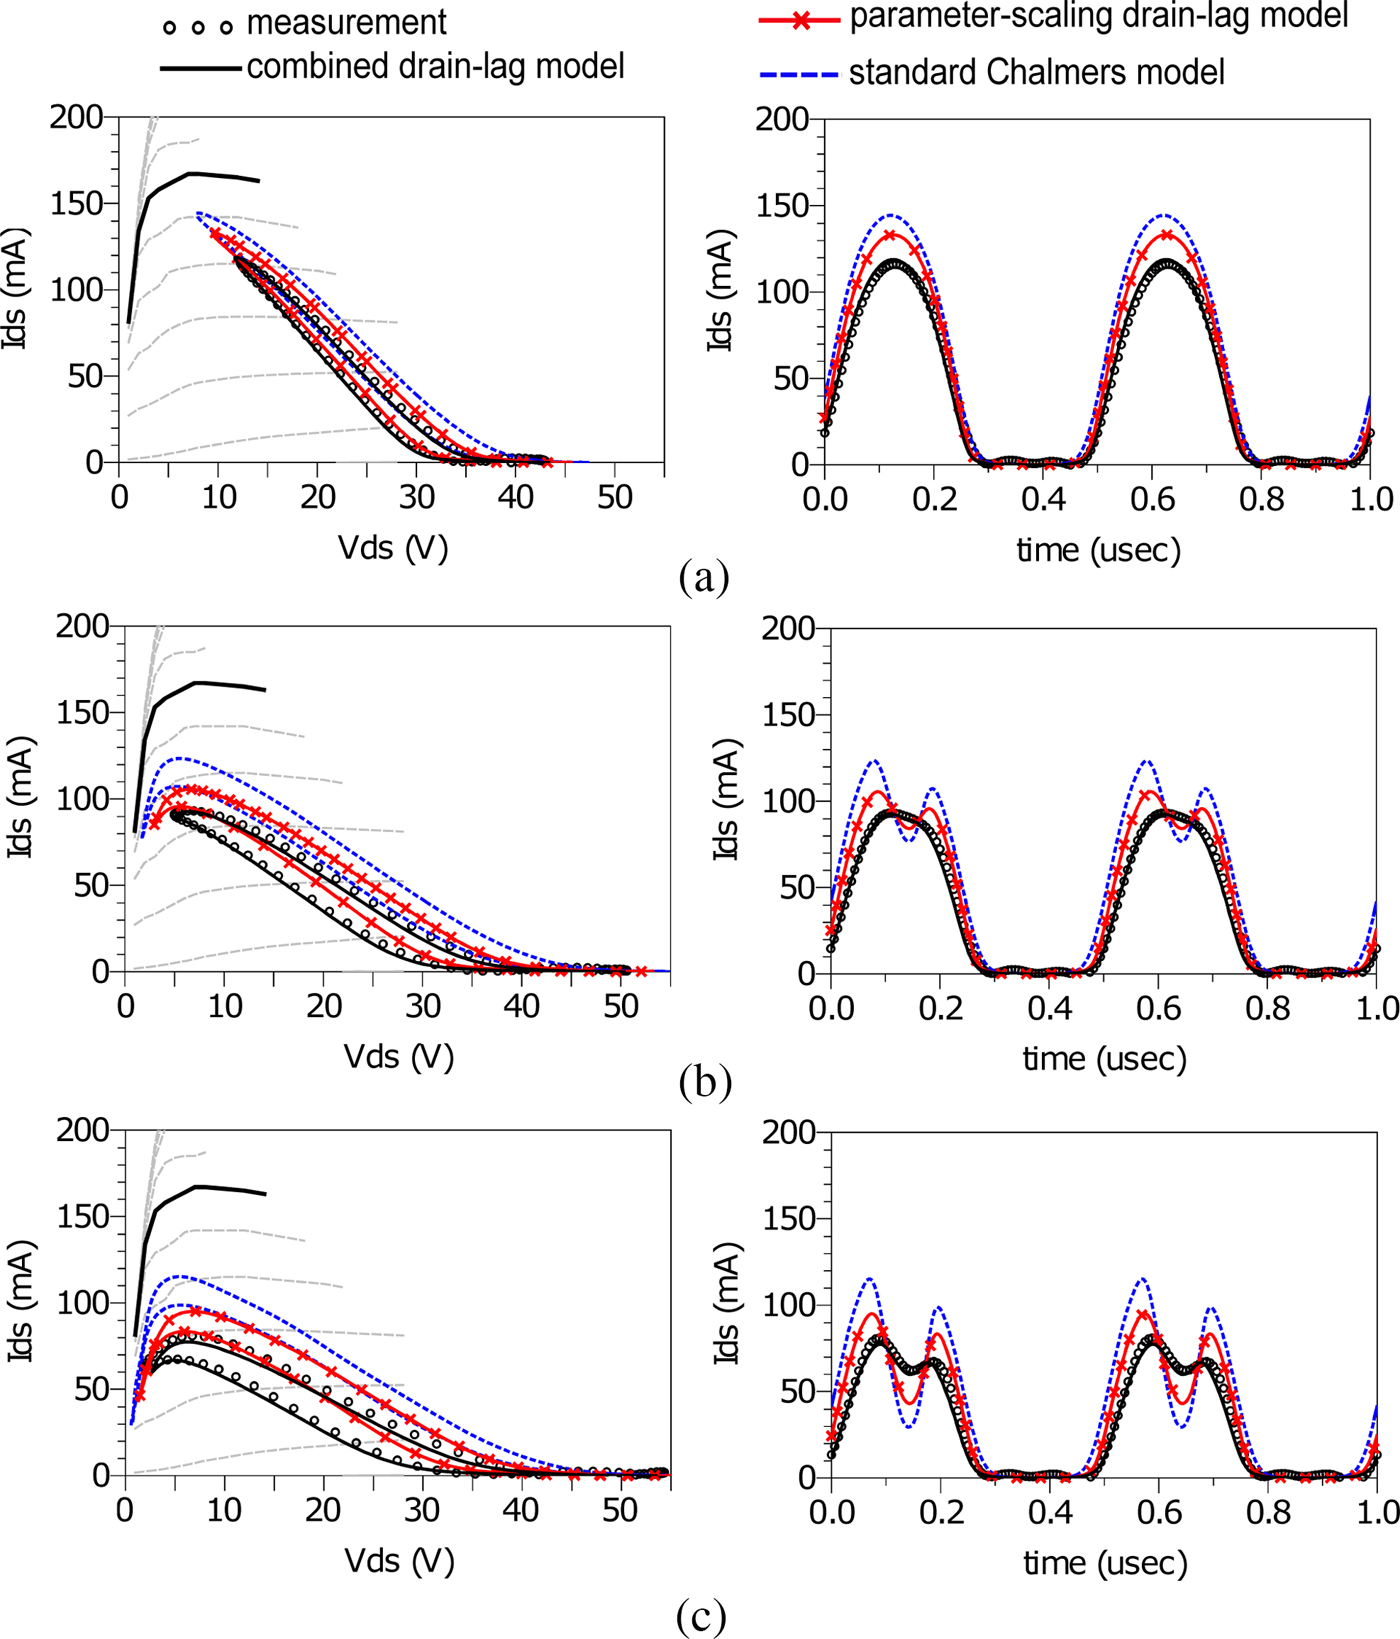
Figure 11 shows the comparison between measured and simulated load lines and time-domain output current under large-signal operation at 2 MHz for three different amplitudes of the drain voltage: 15, 23, and 27 V. The simulations were performed with three different models: the standard Chalmers model; the parameter-scaling drain-lag model and the new proposed drain-lag model. It is evident that the standard Chalmers model shows its limitation in taking into account the difference between output current measured under dc and large-signal conditions, whereas both of the adopted drain-lag models yield an improvement in predicting the output current in the presence of traps. However, the parameter-scaling drain-lag model still overestimates the output currents along the whole load lines, while, at the same time, the combined drain-lag model is able to reproduce the output current with a better level of accuracy.
Measured (black circles) and simulated (lines) load lines and output current in time-domain waveform under large-signal operation at 2 MHz with drain incident wave with amplitudes of (a): 15 V; (b): 23 V; (c): 27 V; (blue dashed lines: simulation with standard Chalmers model; red marked lines: simulation with the parameter-scaling drain-lag model; black solid lines: simulation with combined drain-lag model).
Conclusion
In this paper, an efficient drain-lag model for GaN HEMTs based on the Chalmers model and pulsed S-parameter measurements is presented. This proposed drain-lag model is combined from two published drain-lag descriptions, not only taking the advantages of both models but also overcoming the drawbacks of both.
It is shown that only four constant model parameters have to be extracted only by means of fitting them against the measured pulsed i ds and the calculated i ds-related parameters g m and G ds. This greatly simplifies the modeling procedure for the trapping effects.
The proposed drain-lag model has been validated by several types of measurements: pulsed IV characteristics, pulsed S-parameters, load-pull performance under different conditions, and time domain output current at low frequency under large-signal condition. Good agreement was found which demonstrates that this drain-lag model can accurately predict the performance of GaN HEMTs in the presence of trapping effects.
 Peng Luo received the M.Sc. and Dr.-Ing degrees in electrical engineering from Brandenburg University of Technology Cottbus-Senftenberg, Cottbus, Germany, in 2014 and 2018, respectively. From 2014 to 2017, he was with the Ferdinand-Braun-Institut(FBH), Berlin, Germany. Since 2018, he has been with Brandenburg University of Technology Cottbus-Senftenberg. His current research interests include dispersion modeling of GaN HEMTs and rugged low-noise amplifier design.
 Frank Schnieder received the Dipl.-Ing. and Dr.-Ing. degrees in electrical engineering from the Technical University of Dresden, Dresden, Germany, in 1986 and 1990, respectively.
Since 1989, he has been involved with GaAs and GaN devices. In 1992, he joined the Ferdinand-Braun-Institut (FBH), Berlin, Germany. His current research is focused on device modeling.
 Olof Bengtsson received the Ph.D. degree from the Department of Solid State Electronics (SSE), Ångström Laboratory, Uppsala University, Sweden, in 2008.
Since April 2009, he has been with the Ferdinand-Braun-Institut (FBH), Berlin, Germany, where he currently holds the position of group leader for microwave measurements and packaging.
 Valeria Vadalà was born in Reggio Calabria, Italy, in 1982. She received the M.S. degree cum laude in electronic engineering from the Mediterranea University of Reggio Calabria, Reggio Calabria, Italy, in 2006 and the Ph.D. degree in information engineering from the University of Ferrara, Ferrara, Italy, in 2010.
She is currently in the Department of Engineering, University of Ferrara, as Assistant Professor and teaches the course of electronic instrumentation and measurement. Her current research interests include nonlinear electron-device characterization and modeling and circuit-design techniques for nonlinear microwave and millimeterwave applications.
 Antonio Raffo was born in Taranto, Italy, in 1976. He received the M.S. degree cum laude in electronic engineering and the Ph.D. degree in information engineering from the University of Ferrara, Ferrara, Italy, in 2002 and 2006, respectively.
Since 2002, he has been with the Department of Engineering, University of Ferrara, where he is currently a Research Associate and teaches courses in circuit theory and high-frequency circuit design. He has co-authored more than 130 publications in international journals and conferences and co-edited Microwave Wireless Communications: From Transistor to System Level (Elsevier, 2016). His current research interests include nonlinear electron device characterization and modeling and circuit-design techniques for nonlinear microwave and millimeter-wave applications.
Dr. Raffo is a Member of the Technical Program Committee of the IEEE International Workshop on Integrated Nonlinear Microwave and Millimetrewave Circuits (INMMiC) and the IEEE Microwave Measurement Technical Committee. He serves as an Associate Editor of the Wiley International Journal of Numerical Modeling: Electronic Networks, Devices, and Fields, and was the Technical Program Committee Chair of the IEEE INMMiC Conference, Leuven, Belgium, in 2014.
 Wolfgang Heinrich received the Dipl.-Ing., Dr.-Ing., and Habilitation degrees from the Technical University of Darmstadt, Darmstadt, Germany, in 1982, 1987, and 1992, respectively.
Since 1993, he has been with the Ferdinand-Braun Institut (FBH), Berlin, Germany, where he is currently the Head of the Microwave Department and the Deputy Director of the Institute. Since 2008, he is also a Professor with the Technical University of Berlin, Germany. He has authored or co-authored over 350 publications and conference contributions. His current research interests include monolithic microwave integrated circuit design with an emphasis on GaN power amplifiers, mm-wave integrated circuits, and electromagnetic simulation.
Prof. Heinrich has been serving the microwave community in various functions such as Distinguished Microwave Lecturer from 2003 to 2005, the General Chair of the European Microwave Week in Munich, 2007, and as an Associate Editor of the IEEE Transaction on MTT from 2008 to 2010. Since 2010, he has been the President of the European Microwave Association.
 Matthias Rudolph received the Dipl.-Ing. degree in electrical engineering from the Berlin Institute of Technology, Berlin, Germany, in 1996, and the Dr.-Ing. degree from Darmstadt University of Technology, Darmstadt, Germany, in 2001.
In 1996 he joined Ferdinand-Braun-Institut (FBH), Berlin, Germany. In October 2009, he was appointed the Ulrich-L.-Rohde Professor for RF and Microwave Techniques at Brandenburg University of Technology Cottbus-Senftenberg, Cottbus, Germany.
His research focuses on modeling of FETs and HBTs and on design of power, broadband, and low-noise amplifiers. He authored or coauthored over 50 publications in refereed journals and conferences.
Dr. Rudolph was the Program Chair of the European Microwave Weeks 2007 and 2013, Chair of the German Microwave Conference 2010, and Electronic Submissions Chair of the European Microwave Week 2010, of the IEEE COMCAS in 2013 and 2017 and of the Microwave and Radar Week in Krakow, 2016. Since 2014, he is the EuMA Conference Software Officer. He serves at the IEEE MTT-S technical committees MTT-1 (CAD) and MTT-14 (low-noise techniques) and on the technical programme committe of the IEEE Intl. Microwave Symp. since 2007.



