


Introduction
The launch of the Earth Observing System (EOS) Terra and the Aqua spacecraft in 1999 and 2000, respectively, will allow us to produce global snow maps that are superior to those available today, from the EOS Moderate Resolution Imaging Spectroradiometer (MODIS) and the Advanced Microwave Scanning Radiometer-E (AMSR-E). Efforts are ongoing to determine errors of satellite-derived snow-cover maps, and these efforts will continue in the EOS era.
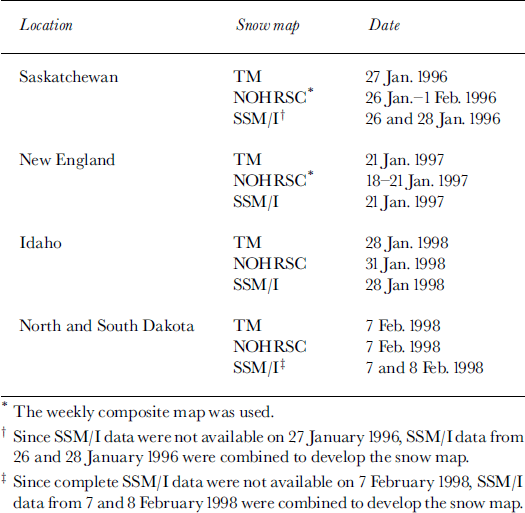
In previous work, we have estimated errors in snow maps in eight different land covers under conditions of continuous snow cover, using Landsat Thematic Mapper (TM) data and land-cover maps, and extrapolated those errors globally (Reference Hall, Foster, Salomonson, Klein and ChienHall and others, 1998). For the present study, we compare snow maps derived from TM data, degraded to 1 km resolution, with U. S. National Operational Hydrologic Remote Sensing Center (NOHRSC) and Defense Meteorological Satellite Program (DMSP)/Special Sensor Microwave Imager (SSM/I) snow maps over four study areas located in North America (Table 1) to determine relative errors as compared to 30 m resolution TM-derived snow maps. The 30m resolution TM snow maps were derived using the MODIS prototype algorithm, SNOWMAP (Reference Hall, Riggs and SalomonsonHall and others, 1995; Reference Klein, Hall and SeidelKlein and others, 1998a, b). These maps are considered to be the most accurate because of the good spatial resolution, and because some of the errors with this method of snow mapping have recently been evaluated under conditions of continuous snow cover (Reference Hall, Foster, Salomonson, Klein and ChienHall and others, 1998). Two different algorithms were applied to the SSM/I data, and the results of a comparison of the resulting snow maps are also discussed. The results demonstrate some of the problems in quantitative comparison of snow maps derived from different sensors at different spatial resolutions. These problems will continue to plague researchers in the EOS era.
Satellite data used in this study
Background
EOS snow-cover products
The EOS Terra spacecraft will fly in a sun-synchronous, near-polar orbit with a 1030 h equatorial-crossing time and will include the MODIS instrument as part of its payload (Reference Kaufman, Herring, Ranson and CollatzKaufman and others, 1998). The MODIS and AMSR-E instruments will be placed on the EOS first afternoon (Aqua) spacecraft which is scheduled to be launched in 2000.
MODIS is a 36–channel spectroradiometer covering visible, near-, shortwave-infrared and infrared bands from 0.4 to 14 μm (Reference Barnes, Pagano and SalomonsonBarnes and others, 1998). The AMSR-E is a 12–channel, six-frequency passive-microwave radiometer system. It measures brightness temperatures at 6.925, 10.65, 18.7, 23.8, 36.5 and 89.0 GHz in both vertical and horizontal polarizations.
MODIS-derived daily, global snow-cover maps are planned to be produced using data from the Terra and Aqua satellites, and both MODIS- and AMSR-E-derived snow maps will be produced from sensors on the PM-1 platform. Algorithms are being developed that will use both AMSR-E and MODIS data together to map global snow cover (Reference Tait, Hall, Foster and ArmstrongTait and others, 2000).
A fully automated algorithm, SNOWMAP, has been developed that will map global snow cover, cloud cover permitting, on a daily basis at 500 m spatial resolution using MODIS data (Reference Hall, Riggs and SalomonsonHall and others, 1995; Reference Riggs, Hall and SalomonsonRiggs and others, 1996; Reference Klein, Hall and RiggsKlein and others, 1998b). Shortly after launch, there will be daily and 8 day composite global snow-cover products at 500 m resolution, and daily and 8 day and monthly-composite climate-modeling grid (CMG) products at 0.25° × 0.25° spatial resolution. MODIS snow- and ice-data products will be archived at and distributed by the U. S. National Snow and Ice Data Center (NSIDC) in Boulder, Colorado (Reference Scharfen, Hall and RiggsScharfen and others, 1997).
Detailed studies of the SNOWMAP algorithm have been conducted in many different land covers, resulting in estimates of snow-mapping errors in at least eight individual land-cover classes under conditions of continuous snow cover (Reference Hall, Foster, Salomonson, Klein and ChienHall and others, 1998). Preliminary results, under cloud-free conditions, show the highest average errors in forested areas (15%) and the lowest average errors in non-forested areas (5%). Errors are expected to be greater when snow cover is not continuous, and are expected to be greatest in alpine areas containing patchy snow cover (personal communication from J. G. Shi, 1999).
Currently, a global, daily snow-cover dataset at 500 m resolution (or better) does not exist, so a direct comparison of the MODIS- and AMSR-E-derived products with ˚actual-global snow cover will not be possible until after the launches of Terra and Aqua. Instead, the EOS snow maps will be compared with other hemispheric-scale maps such as the Northern Hemisphere weekly snow-cover maps produced by the U.S. National Oceanic and Atmospheric Administration (NOAA) National Environmental Satellite, Data and Information Service (NESDIS), and maps prepared by NOHRSC. Precise errors of these snow maps have not been established. The EOS snow maps will also be compared with maps derived from passive-microwave data (e.g. Reference Chang, Foster and HallChang and others, 1987,Reference Chang1997; Reference Grody and BasistGrody and Basist, 1996; Tait and others, in press) from the SSM/I. At regional and local scales, MODIS snow-cover maps will be validated using snow-cover maps derived from the Landsat-7 Enhanced Thematic Mapper Plus (ETM+), launched on 15 April 1999, and Terra’s Advanced Spaceborne Thermal Emission and Reflection Radiometer (ASTER).
NOHRSC snow maps
The Geostationary Operational Environmental Satellite (GOES) imager scans parts of the Earth every 15 min. The visible images are navigated and registered using 169 landmarks in the Northern and Southern Hemispheres. The navigation specifications require the visible data to be within 4 km and infrared data to be within 6 km. Using 15 min visible imagery during the past 52 weeks, 90% or more of landmarks met specifications for the north-south direction (except for 3 weeks) and 95% or more of landmarks met specifications for the east-west direction (except for 2 weeks).
Once daily, from Saturday through Thursday, GOES East and GOES West infrared (bands 2, 4 and 5) and water-vapor (band 3) images are resampled to match the 1 km resolution of the visible data using an inverse distance function. Each pixel in the visible band is normalized to solar noon using a simple cosine correction. The normalized visible image and the reprojected and resampled infrared bands are used as input to an algorithm that produces 32–bit images of cloud and snow/cloud. Each image is given an 80–byte header, which contains the ancillary information required to read and utilize the images. The three images are divided into smaller, more manageable images for analysis. Each subdivided image is analyzed to produce a cloud-mask image and a snow/cloud image. A coastline vector file is layered on one of the visible images to derive the north-south and east-west shift required to align or register the final snow-cover image. The cloud and snow/cloud images are merged to produce an image of snow, cloud and no-snow/no-cloud for each subdivided image; the smaller images are mosaicked to produce an unregistered east or west snow-cover map. Alphanumeric tabulations of the snow-cover percentage by hydrologic basin and elevation zone are produced, and are made available on the NOHRSC website (http://www.nohrsc.nws.gov/), and sent to the National Weather Service (NWS) offices over the NWS communications lines and sent by file transfer protocol over the Internet to interested agencies.
Land-cover maps
To determine land-cover type, International Geosphere-Biosphere Program (IGBP) land-cover maps of North America developed from 1km Advanced Very High Resolution Radiometer (AVHRR) data are used (Reference Loveland and BelwardLoveland and Bel-ward, 1997). These maps are based on monthly normalized-difference vegetation index (NDVI) composites from 1992 and 1993. Using these maps, Reference Hall, Foster, Salomonson, Klein and ChienHall and others (1998) classified the Northern Hemisphere into eight land-cover classes (forest; mixed agriculture and forest; barren/sparsely vegetated; tundra; grasslands/shrublands; wetlands; permanent snow and ice; and water) and estimated snow-cover mapping errors in each land-cover class for continuous snow-cover conditions based largely on field studies.
Study Areas and Satellite Data
TM, NOHRSC and SSM/I data were acquired for four study areas located in Canada and the United States: (1) Saskatchewan, Canada; (2) New England (Massachusetts, New Hampshire and Vermont) and eastern New York; (3) central Idaho and western Montana; and (4) parts of North and South Dakota (Table 1). The site in Saskatchewan is characterized by gentle relief and rolling hills (interior lowlands) and is composed predominantly of boreal forest (aspen and spruce) and some mixed agriculture and forest. It is located in an area of prairie snow cover, according to Reference Sturm, Holmgren and ListonSturm and others (1995). Land cover in the New England study area is predominantly composed of northern hardwood forests, and the snow cover is maritime (Reference Sturm, Holmgren and ListonSturm and others, 1995). In the Idaho study area, terrain is mountainous (northern Rocky Mountains) and forested (mainly fir trees), and the snow cover is prairie, alpine or maritime (Reference Sturm, Holmgren and ListonSturm and others, 1995). In the study area in North and South Dakota, the terrain is mainly flat (the Great Plains), land cover is composed of grassland/shrubland in the west and mixed agriculture and forest in the east, and the snow cover is classified by Reference Sturm, Holmgren and ListonSturm and others (1995) as prairie snow.
The SNOWMAP algorithm was applied to the 30 m and lkm resolution TM data (Reference Klein, Hall and RiggsKlein and others, 1998b) to map snow. Using the SSM/ I data, two different algorithms were used to map snow. The Reference Grody and BasistGrody and Basist (1996) method uses the difference between the microwave brightness temperature (TB) at 37 and 19 GHz, and at 85 and 22 GHz vertical polarizations, and a decision tree whereby filters are used to isolate the snow-cover signature. Reference ChangChang and others’ (1997) method (without forest-cover corrections) was also used. This is based on the difference between the 19 and 37 GHz channels,

where SD is snow depth (in cm).
One of the main problems with SSM/I-derived snow-cover maps is the presence of melting snow. Liquid water coating snow grains absorbs microwave radiation, producing an increase in TB. To minimize this problem, only the early-morning satellite observations were used because this is when the surface temperature is generally the coldest.
The SSM/I maps may not cover exactly the same areas on the ground as do theTM and NOHRSC maps, although efforts were made to register the data. It is possible that the SSM/I maps are as much as 25 km offset from the other maps. The lack of ground-control points observable on the SSM/I data meant that the registration could only be done using latitude and longitude lines.
The spatial resolutions of the various snow maps discussed herein are different. TM maps have 30 m resolution and are also degraded to lkm resolution, while the NOHRSC maps have 30 arcsecond resolution (approximately lkm resolution at the Equator). The resolution of the SSM/I snow maps is 0.5° × 0.5°; at a latitude of 50°, this is approximately 35 km × 55 km.
Results
The NOHRSC and SSM/I maps were registered digitally to the Landsat TM-derived maps. The latitude and longitude of the center of each SSM/I pixel were known. Also, we knew the corner latitude and longitude of each TM scene. To obtain the best possible co-registration, we chose sections of the SSM/ I data that matched the latitude and longitude boundaries of the TM scenes most closely. A condition to these selections was that the SSM/I box was slightly larger than theTM scene, so that theTM scene could fit inside the SSM/ I box. We were then able to extract the SSM/ I data according to the corner latitudes and longitudes of the TM scene. If we were to shift the SSM/I box up/down or left/ right we would only be getting farther from the optimum co-registration.
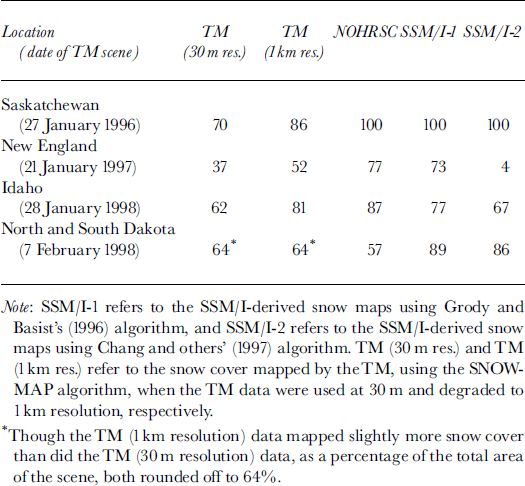
Since all of the maps were registered (i.e. the SSM/I and NOHRSC maps were registered to the TM-derived maps), the percentage of snow cover was easily determined from the TM, NOHRSC and each of the SSM/I maps for the area covered byTM data (Table 2).
Percentage of snow cover as determined from the various snow naps
The 30 m resolution TM data were degraded to lkm resolution in the following way. Each band of the TM data that is used in the SNOWMAP algorithm was reprojected from 30 to 25 m spatial resolution separately. Then 40 × 40 pixels were averaged to equal the spatial area (1600 pixels × 625 m2) of a 1 km pixel (100 000 m2). The data from individual bands, at lkm resolution, were then used in the MODIS prototype algorithm to create a snow-cover map.
The SNOWMAP algorithm was applied to the data after the degradation in spatial resolution.
Saskatchewan
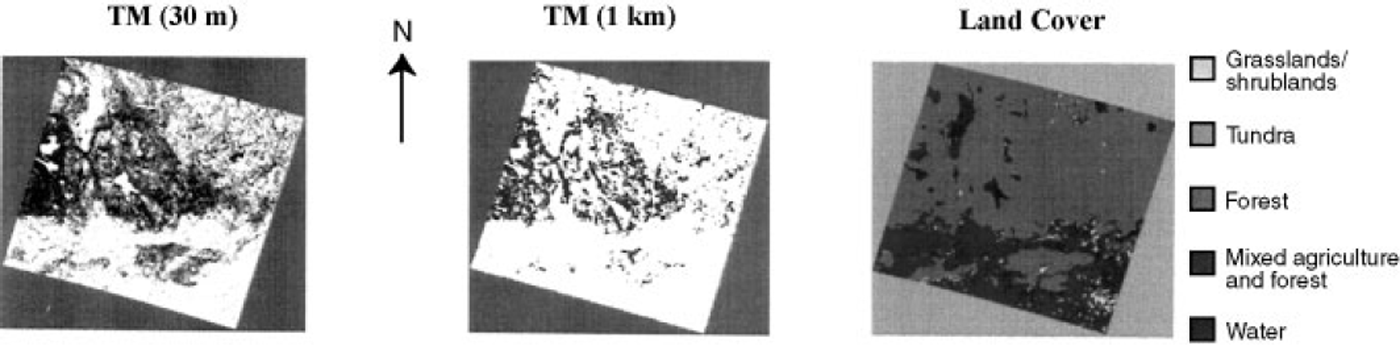
The 27 January 1996 30 m resolutionTM snow map (TM-1) of southern Saskatchewan showed 70% snow cover (Fig. 1). The boreal forest in the northern part of the scene contains both coniferous and deciduous trees. Unless there has been a recent snowfall, the tree canopies, branches, stems and trunks will likely be mapped as non-snow-covered because the snow is often blown or falls from a tree canopy, or the snow sublimates over time. Previous work has shown that it is very difficult to map snow through both dense coniferous and dense deciduous forests (Hallikainen and others, 1988; Reference Foster, Chang, Hall, Mougin, Ranson and SmithFoster and others, 1994; Reference Hall, Foster, Salomonson, Klein and ChienHall and others, 1998). While some areas in the central and western parts of the TM scene are not mapped as snow-covered, the southern part of the scene which is composed of mixed agricultural land and forest (but is predominantly agricultural land) is nearly 100% snow-covered as seen on the TM-derived maps. The snow map created from the TM data, degraded to 1km resolution (TM-2), shows 86% snow cover. The NOHRSC and both SSM/I-derived snow maps all show 100% snow cover for the scene (Table 2).
Southern Saskatchewan. Left: TM-derived 30 m resolution snow map (from TM image No. 5434917022300, path/row 37/23) of southern Saskatchewan, Canada, acquired on 27 January 1996. Center: TM-derwedlkm resolution snow map. Right: IGBP land-cover map of the same area shown in the TM images. Each image is 185 km across.
New England
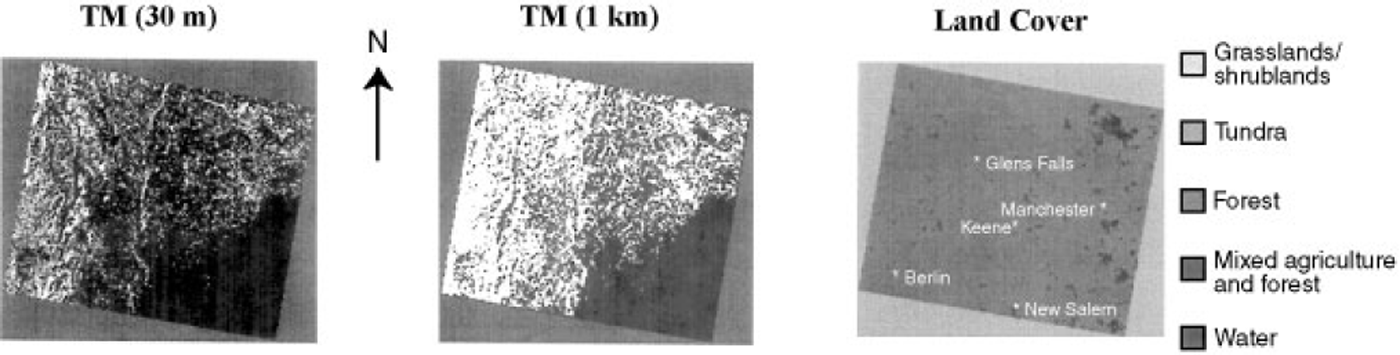
Most (96%) of the area included in the 21 January 1997 TM scene of New England (including eastern New York, parts of Vermont, New Hampshire and Massachusetts) is composed of forest (Fig. 2). While the TM 30 m resolution map shows only 37% snow cover, the TM 1km map shows 52%, and the NOHRSC and SSM/I-1 maps show 77% and 73% snow cover, respectively (Table 2). Across most of the scene, snow cover was intermittent as determined from fieldwork and meteorological-station data (Reference Bayr, Goumas and PicardBayr and others, 1997; NOAA, 1997a; Reference Klein, Hall and SeidelKlein and others, 1998a; Reference Tait, Hall, Foster, Chang and KleinTait and others, 1999). (Note that the NOAA meteorological stations tend to be in open areas where less snow may be present than in the forests.) For example, Berlin, New York, had about 13 cm and Glens Falls, New York, had 10 cm (NOAA, 1997a). In Keene, New Hampshire, NOAA data show 5 cm of snow on the ground on 21 January 1997, though reports from Keene indicate patchy snow cover in the surrounding areas on that date (personal communication from K. J. Bayr, 1999). To the east, in Manchester, New Hampshire, there was no snow reported on the ground (NOAA, 1997b). In the southeastern part of the scene, in Massachusetts, the TM-, NOHRSC- (Figs 2 and 3) and SSM/I-derived maps are shown as snow-free. This is consistent with the meteorological-station data of that area; for example, New Salem, Massachusetts, had only a trace of snow on the ground on 21 January (NOAA, 1997a).
New England. Left: TM-derived 30 m resolution snow map (from image No. LT5013030009702110, path/row 013/030) of parts of New England (New Hampshire, Vermont and Massachusetts) and eastern New York, acquired on 21 January 1997. Center: TM-derived lkm resolution snow map Right: IGBP land-cover map of the same area shown in the TM image. Approximate locations of selected meteorological stations are shown. Each image is 185 km across.
New England. Left: NOHRSC snow map acquired on 18–21 January 1997. Center: snow map derived from 21 January 1997 SSM/I data using Grody and Basist’s (1996) algorithm (SSM/I-1). Right: SSM/I-derived map from 21 January 1997, using Reference ChangChang and others’ (1997) algorithm (SSM/I-2). Each image is 185 km across.
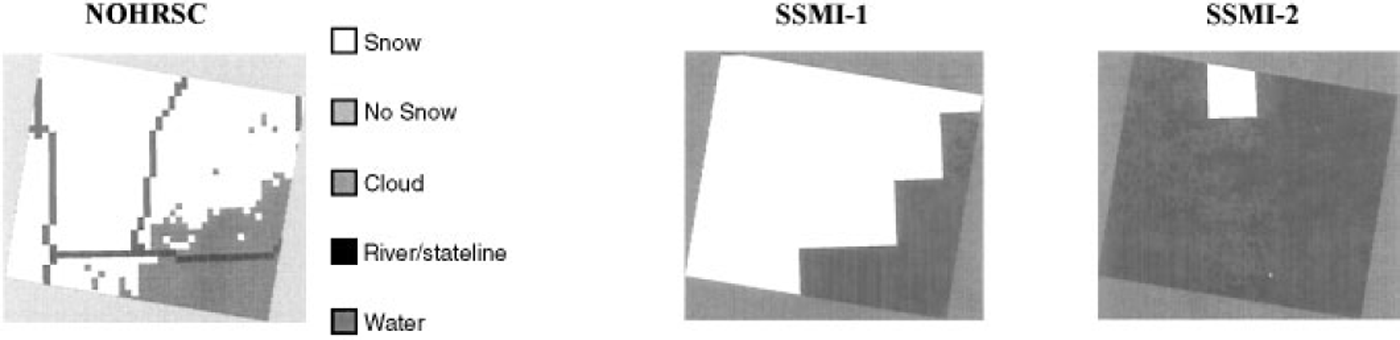
The SSM/I-derived snow map using Reference ChangChang and others’ (1997) algorithm (SSM/I-2), without forest-cover correction, shows 96% of the New England scene as being snow-free. This is probably because the snow is shallow and wet and therefore its signature is similar to the surrounding snow-free ground. Also, this is a forested area, which often causes problems for snow mapping using SSM/I data since emission from trees increases the TB (Reference Foster, Chang, Hall, Mougin, Ranson and SmithFoster and others, 1994), especially under patchy-snow conditions. The SSM/I-1 algorithm utilizes the 85 GHz channel which is more sensitive to snow cover, and therefore maps shallower snow than does the SSM/I-2 algorithm. This may be why the SSM/I-1 algorithm maps more snow cover in this scene than does the SSM/I-2 algorithm.
The New England snow maps (except for the SSM/I-2 map) generally agree with respect to the location of snow cover, but not with respect to amount of snow cover. Probably the main reason that theTM map shows less snow cover than the other maps (Table 2) is that the intermittent snow in the forests in the area is mapped as full snow cover on the NOHRSC and SSM/I-1 maps, and, more correctly, as partial snow cover on theTM map.
In the forested New England study area, there is patchy snow cover in New Hampshire, Vermont and New York, but in Massachusetts (southeastern part of the scene) the area is basically snow-free according to meteorological-station data. All of the snow maps show this area to be snow-free.
Idaho
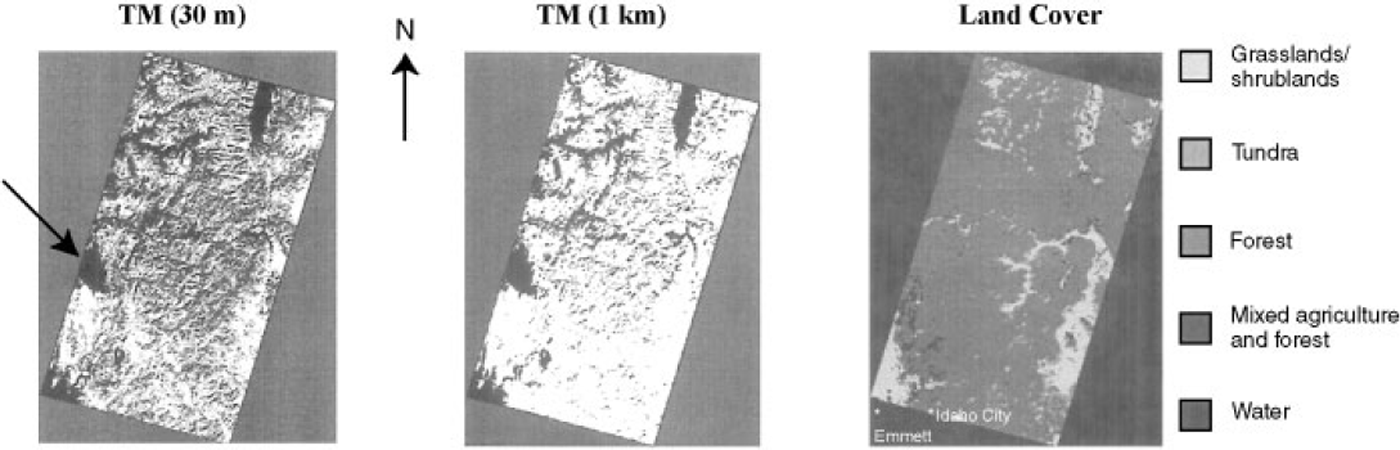
In Idaho, on the 28 January 1998 TM-1 snow map, in a predominantly forested site, snow is mapped over 62% of the scene, while the TM-2, NOHRSC and both SSM/I maps show greater amounts of snow cover (Table 2). The TM-1 map does not show continuous snow cover in the forests, while the other snow maps do (Figs 4 and 5). Mountain shadows are present and are incorrectly mapped as being snow-free using the TM-1 and –2 maps. The apparently snow-free area on the TM maps is cloud cover (see arrow in Fig. 4).
Idaho. Left: TM-derived snow map (from image Ms. LT5041028009802810, path/row 41/28; LT5041029009802810, path/row 41/29) of central Idaho and western Montana, 28 January 1998; arrow points to cloud cover. Center: TM-derived 1 km resolution snow map. Right: IGBP land-cover map of the same area shown in the TM image. Approximate locations of selected meteorological stations are shown. Each image is 185km across.
Idaho. Left: NOHRSC snow map acquired on 31 January 1998. Center: SSM/I-derived map from 28January 1998using Reference Grody and BasistGrody and Basist’s (1996) algorithm (SSM/I-1). Right: SSM/I-derived map from 28 January 1998, using Reference Grody and BasistChang and others’ (1997) algorithm (SSM/I-2). Each image is 185 km across.
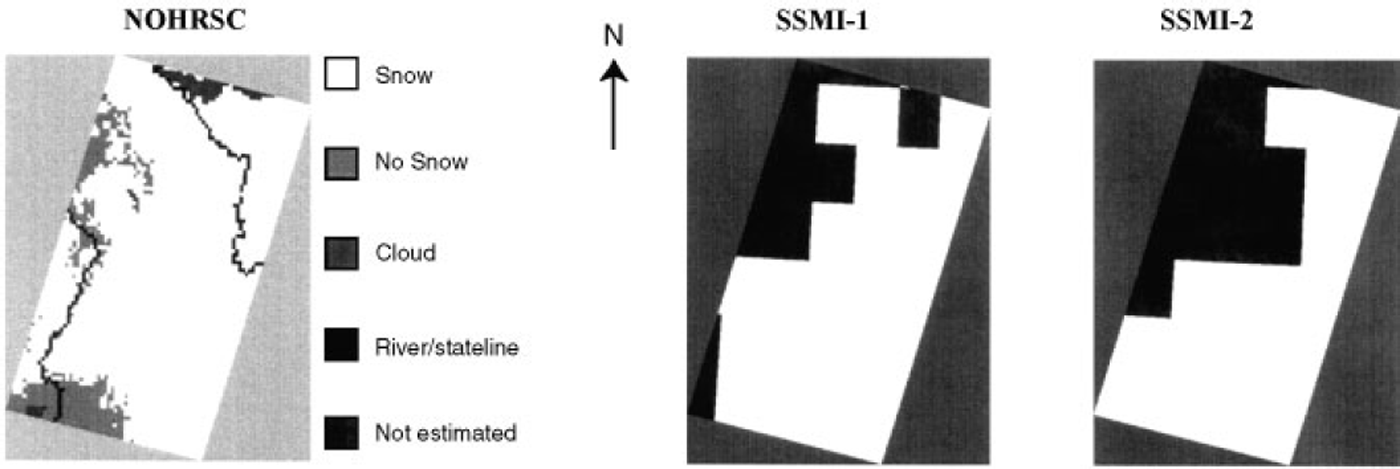
On the Idaho maps, a non-snow-covered area is shown in the southwestern part of the scene on both the TM and NOHRSC maps (Fig. 4), and the SSM/I-1 map (Fig. 5). The nearby station at Emmett, Idaho, just south of the scene, reported no snow cover (NOAA, 1998a). Farther to the west the TM and both of the SSM/I maps show continuous snow cover. Meteorological-station data are sparse to the east of Emmett, but point values show 25–71 cm of snow on the ground in this area. For example, there were 51 cm in Idaho City, Idaho (NOAA, 1998a), in an area that is shown as snow-free on the NOHRSC snow maps.
Other problems are evident. Both SSM/I maps show a well-delineated snowline in the western part of the scene where there is no snowline according to the TM and NOHRSC data. If the snow cover is patchy and thin, the large SSM/I pixels may not detect enough of a signal change to map the whole pixel as snow, and thus both SSM/I algorithms map the western part of the scene as snow-free.
In Idaho, a mountainous area, continuous snow cover is not mapped in mountain shadows using the TM data, but is mapped using the coarser-resolution data. In this case, it is believed that the TM-1 snow map underestimates the amount of snow cover present.
North and South Dakota
In North and South Dakota, a snowline is visible on all of the 7 and 8 February 1998 snow maps (Figs 6 and 7).The eastern part of all of the maps is generally snow-covered, while the southern and southwestern parts are snow-free. The snowline, as seen on the TM-derived maps, closely follows the boundary between the grassland/shrubland land-cover class to the west (which is snow-free) and the mixed vegetation and forest class (which is snow-covered) to the east (Fig. 6). The snow cover remains longer in the forest than it does in the grassland/shrubland, which is why there is such an obvious snowline on the TM-derived snow maps. This appears to be an accurate depiction of the snow-cover situation, and is corroborated by the NOAA meteorological-station data showing, for example, no snow cover in Pollock, South Dakota (NOAA, 1998c), west of the snowline, and 13 cm in Jamestown, 20 cm in Cooperstown and 10 cm of snow cover in Edgely, North Dakota, on 7 February 1998 (NOAA, 1998b), east of the snowline. The NOHRSC map also shows a well-defined snowline, but in a slightly different place than shown on the TM-derived maps. In this case, it was difficult to register the TM and NOHRSC data, due to a lack of ground-control features, and therefore the positions of the snowlines may not match due to misregistration.
North and South Dakota. Left: TM-derived snow map (from image No. 50310270098038 TO, path/row 31/27; 50310280098038 TO,path/row 31/28; 50310290098038 TO, path/row 31/29) acquired on 7February 1998. Center: 1km resolution TM-derived snow map Right: IGBP land-cover map of the same area shown in the TM image. Approximate locations of selected meteorological stations are shown. Each image is 185 km across.
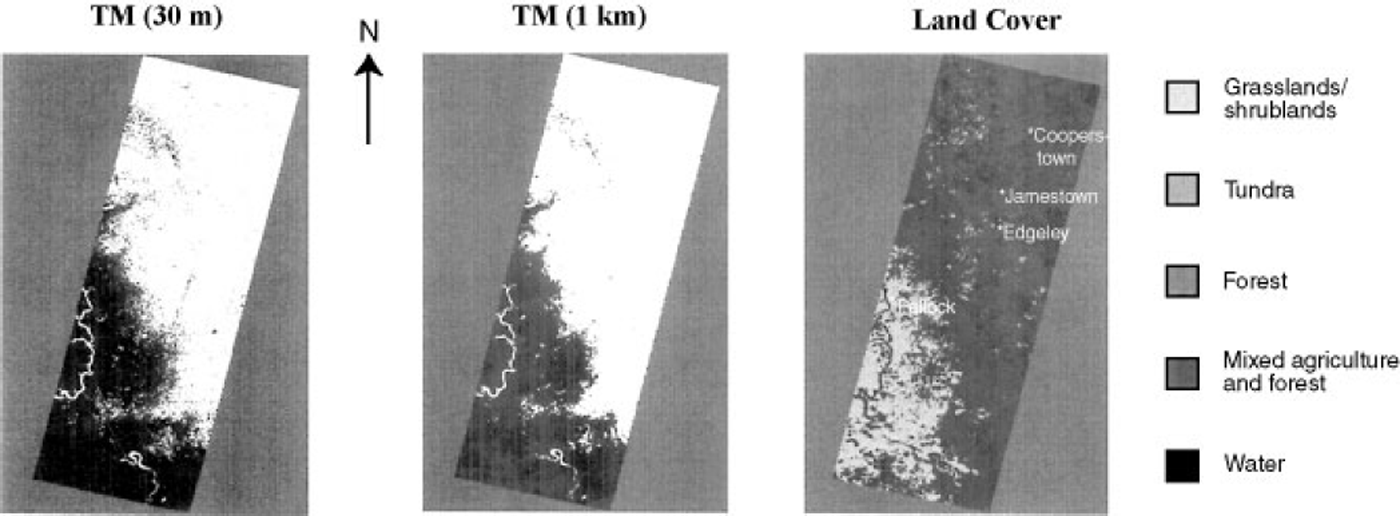
North and South Dakota. Left: MOHRSC snow map acquired on 7 February 1998. Center: SSM/I-derived map from 7–8 February 1998 using Reference Grody and BasistGrody and Basist’s (1996) algorithm (SSM/I-1). Right: SSM/I-derived map from 7–8 February 1998 using Reference ChangChang and others’ (1997) algorithm (SSM/I-2). Each image is 185 km across.
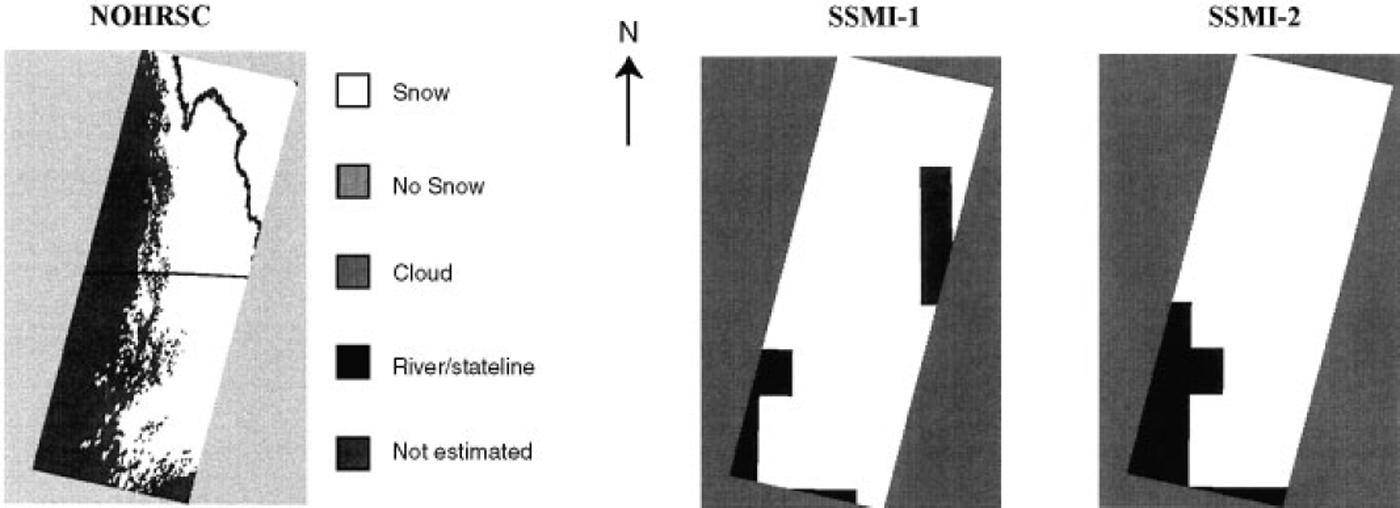
Both SSM/I-derived snow maps show a well-defined snowline in the southwestern part of the scene. In addition, the SSMI-1 map shows a snow-free area in the eastern part of the scene in a location that is snow-covered according to the other maps and the meteorological-station data. These snow-free pixels are the result of the algorithm’s precipitation filter which indicates that it may have been raining or snowing at the time the data were acquired. Reference Standley and BarrettStandley and Barrett (1999) have used the infrared data from the DMSP Operational Line Scanner (OLS), in combination with the SSM/I data, to map snow more accurately than when using the SSM/I data alone. This is because the infrared temperature of snow cover is generally greater than that of the precipitating clouds.
There was very little change in the amount of snow on the TM-1 and –2 maps (64%) in the North and South Dakota study area. Though the TM-2 map showed slightly more snow cover than did the TM-1 map, as a percentage of the total area of the scene, both rounded off to 64%. The NOHRSC 1 km resolution maps show less snow (57%), while the SSM/I-1 and –2 maps show 89% and 86% snow cover, respectively. In terms of spatial coverage, this area provided more consistent results among the snow maps than did the maps with patchy snow cover, probably because continuous snow cover with a well-defined snowline is much easier to map accurately than patchy snow cover.
Discussion
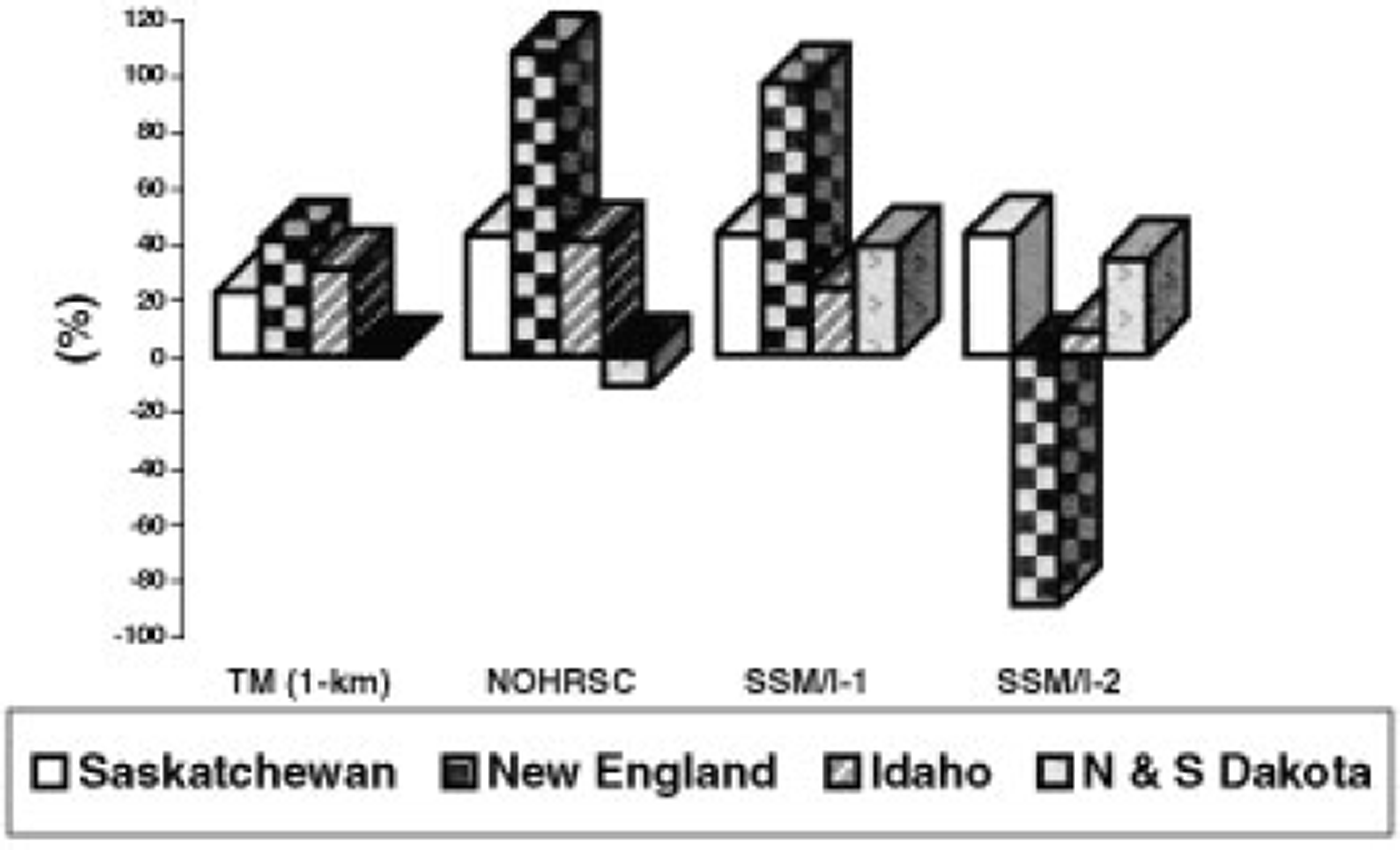
Because of the good (30 m) spatial resolution of theTM sensor, and the fact that the SNOWMAP algorithm has been evaluated for accuracy in different land covers, the assumption is that, of the snow maps studied in this paper, the 30 m resolution Landsat TM-derived snow maps (TM-1) are the most accurate. The snow maps derived fromTM data (1km resolution), NOHRSC maps and both SSM/ I maps were compared to the TM (30m resolution) maps. Percentage change in snow cover mapped, relative to the TM 30 m resolution data, is shown in Figure 8. This, however, addresses the accuracy only in terms of the total amount of snow mapped, not in terms of the location of the snow cover, and for this reason may be misleading. Furthermore, it is expected that the TM-2 maps should be the most similar of all the maps to the TM-1 maps because the same algorithm was used to calculate snow cover using both the 30 m and 1km resolution TM maps. The NOHRSC maps are generally accurate depictions of the location of snow cover, but show more snow cover than is probably present since the tree canopy, branches and stems are actually not snow-covered as seen on the TM data. When the TM data are degraded to 1 km spatial resolution, more snow is generally mapped.
Percentage change of the snow cover for TM (lkm) -, MOHRSC- and SSM/I-derived maps relative to the TM 30 m resolution maps.
The important role of land cover in snow-cover distribution is seen in the North and South Dakota scene where there is a distinct snowline at a clear demarcation between the grassland/shrubland and the mixed agriculture and forest land-cover classes (Fig. 6). This snowline is apparent on all of the satellite-derived maps.
The SSM/I maps are considered to be the least accurate in terms of mapping the location of snow cover accurately, primarily because of the coarse resolution of the data. There is confusion in the SSM/I-2 maps in patchy snow in forests in the New England study area. The SSM/I-1 algorithm maps precipitation as non-snow cover and maps more snow cover in the eastern part of the North and South Dakota scene than is present. In Saskatchewan, both SSM/I maps show 100% snow cover. Due to the coarse resolution, the signature of the snow-free tree canopies and trunks is not detected because the algorithms cannot delineate sub-grid-size features. Even in continuous snow cover, snow-free areas exist and should be mapped as being snow-free if the resolution of a satellite sensor is good enough.
Conclusions
This study demonstrates some of the difficulties involved in intercomparing satellite-derived snow-cover maps. First, we do not know which map is the most accurate, though we assume in this work that the highest-resolution map (30 m resolution map derived fromTM data) is the most accurate. In addition, since different satellite sensors are used to derive the maps, different algorithms are used. Furthermore, the maps are at different spatial resolutions, further complicating the comparisons. More such intercomparisons will be accomplished following the launch of the MODIS sensor on the Terra spacecraft. It will be possible to use Landsat-7 data to derive snow-cover maps and compare those with MODIS, SSM/I and AMSR-E maps. As the EOS MODIS and AMSR-E datasets become available, and such studies are repeated, we will be able to reduce the uncertainties in the accuracy assessments of various snow maps.
Acknowledgements
The authors would like to thank J. Chien of General Sciences Corporation (GSG), Laurel, MD, for image processing, M. Larko of GSC for obtaining the SSM/I data, and A. Klein of Texas A&M University, College Station, TX, A. Moore of Hartwick College, Oneonta, NY, and K. Bayr of Keene State College, Keene, NH, for obtaining field measurements in the New England/New York study area during February 1997.



