Introduction
The Antarctic Peninsula has been identified as an area experiencing atmospheric warming in recent years (Morrison, 1990). Doake and Vaughan (1991) have documented, by satellite imagery collected between 1974 and 1989, the disintegration of Wordie Ice Shelf on the western side of the peninsula and have suggested that this warming is responsible for the demise of this ice shelf.
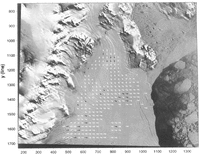
The northern part of the Larsen Ice Shelf discussed in this paper lies approximately 600 km north-northeast of Wordie Ice Shelf and on the eastern side of the Antarctic Peninsula. With a more complete set of satellite images, the retreat history of this region of Larsen Ice Shelf has also been documented (Skvarca, 1993). The amount of retreat increases with distance north of Lindenberg Island (Fig. 1). The most dramatic retreat has been a 20km recession of the ice front in Larsen Inlet in just 3 years. The retreat can be seen by comparing the ice fronts on Figures 1, 2 and 3.
Landsat-MSS image of northern Larsen Ice Shelf collected on 1 March 1986 and used as the reference image in this study. Locations of landmarks referred to in the text are indicated. Solid circles indicate positions of surveyed markers discussed in the text.

Landsat-TM image collected on 5 November 1989 and used in this study. It has been resampled and warped to (0-register with the MSS image (Fig. 1). As discussed in the text, the image does not extend jar enough south to include either Lindenberg Island or Larsen Nunalak. Velocity field is derived from the MSS—TM image pair. Vector lengths correspond to actual displacements over the 3.68 year interval — vector tails are the centers of the reference areas in the MSS image and vector heads are the centers of the reference areas as located in the T M image. Black vectors are those in common with the Kosmos—MSS data set (Fig. 3; T able 1). Vector grid spacing is 25 pixels (1425 m). Coordinate s)!Stem refers to MSS-image pixels by sample (x axis) and line (y axis).

Fig. 3. Kosmos Kate-200 image collected on 3 October 1975 and used in this study. It has been resampled and warped to co-register with the MSS image (Fig. 1). Velocity field is derived from the Kosmos-MSS image pair. Vector lengths correspond to actual displacements over the 10.4( year interval vector heads are the centers of the reference area in the MSS image and vector tails are the centers of the reference areas as located in the Kosmos image. Black vectors are those in common with the MSS—TM data set (Fig. 2; Table 1). Vector grid spacing is 25 pixels (1425m). Coordinate system refers to MSS-image pixels by sample (x axis) and line (y axis).

In this paper, we use three of the images in the Larsen Ice Shelf time series to investigate the velocity field of this ice shelf over a 14 year period. Digital images were used to take advantage of recent cross-correlation techniques for the derivation of the velocity fields. Comparison between velocity fields averaged over different periods suggest that the ice shelf is accelerating.
Techniques
The method of using cross-correlation to track features in sequential imagery has been described elsewhere (Scambos and others, 1992). Here, our technique is being applied to imagery of three different resolutions. The most recent image is a Landsat Thematic Mapper I'M) image collected on 5 November 1989. The second image is a Landsat MSS image collected on I March 1986 (Fig. I). The oldest image is a Kosmos Kate-200 image collected on 3 October 1975.
The two Landsat images were available in a digital format on computer tape and were processed by us first to eliminate. scan-line noise in each spectral band. Gener-ation of a first principal-component image reduced noise still further. The Kosmos image was only available as a photographic negative. The negative was printed and scanned to generate a digital version necessary for the tracking software. The respective pixel dimension of each digital image is: Kosmos, 77 m; MSS, 57 m; and TM, 28.5 m.
Given the various resolutions of the images used, this study supplied a useful test of the software's capabilities for handling different image resolutions and was one of the motivations for undertaking the study. The cross-correlation technique is much more adept at tracking subtle or poorly resolved features than pixel-picking methods. The long time periods involved provide an additional challenge to the software's ability to match features after many years of flow. As will be shown, the software performs well under these difficult circumstances.
To make measurements of feature displacements in separate images meaningful, the images must first be co-registered. We chose the MSS image as the control image and measured displacements backward in time to the Kosmos image and forward in time to the TM image. Because the MSS served as the control image, and the other images were resampled as part of the co-registration process, distances, when stated in pixel lengths, will always refer to the MSS pixel dimension, 57 m. The sample axis of the MSS image (horizontal on Figures I, 2 and 3) has an azimuth of 109° from true north (determined from survey data described later).
In the case of the older image pair (Kosmos MSS), 17 common control points were chosen on rock outcrops on three sides of the ice shelf, from Lindenberg Island clockwise around to Sobral Peninsula. Where possible, control points were chosen close to the ice shelf, at low elevation, to optimize the accuracy of the fit on the ice shelf and to minimize elevation-induced distortion. A third-order polynomial was used to warp the Kosmos image to fit the MSS image. This polynomial matched the positions of the control points with an RSS residual of 0.84 pixels (0.61 pixels in x (sample axis) and 0.5 pixels in y (line axis)). Resampling during the warping process used a cubic convolution algorithm.
In the case of the TM—MSS co-registration, the TM image did not extend far enough south to permit the use of either Larsen Nunatak or Lindenberg Island for co-registration control (see Fig. 2). Without the availability of these areas for control points for this image pair, co-registration errors can grow to the southeast. To hold extrapolation errors in check, only a second-order warping polynomial was used and more control points (20) were chosen over a wider area than in the Kosmos image. This polynomial fitted the control points with an RSS of 1.02 pixels (0.91 pixels in x and 0.47 pixels in y).
Once co-registered, each pair of images (Kosmos-MSS and MSS—TM) was run through the cross-correlation tracking software to generate a set of dis¬placement vectors. The size of the reference area (the sub-image window whose features are to be matched in the search area of the second image) was taken to be 32 × 32 pixels, and the search area in the second image Was taken to be 128 × 128 pixels. The grid spacing of reference areas was 25 pixels (1.425 km). In each pair, the MSS served as the reference image and the Kosmos or TM was the search image. By applying the software in this way, we located the same reference area (i.e. set of unique features) in both the older and newer images. This three-cpoch trajectory assisted greatly in judging the validity of three-epoch matches discussed later. A conservative value of the 1σ accuracy of the cross-correlation procedure based on our work with other imagery is that the location of the features in the reference area can be identified in the search image to ±0.5 pixels.
The software calculates a strength parameter of each match but we have found, in practice, that the output file still has many spurious matches with high strengths and many weak matches that are, in fact, valid. The calculated displacement field was coherent enough to permit the easy identification of spurious matches and confirm weak matches based on surrounding velocity data and glaciological clues such as flow stripes and the positions of major tributary glaciers. Editing of the software's output file was done interactively on the computer screen using customized software that allowed the user to flicker between each image while viewing an overlay of the center points of all reference areas and their calculated trajectories (Fahnestock and others, 1992).
Image-Derived Velocity Fields
Due to the higher resolution of the TM image and the shorter time period between the MSS and TM images (3.68 years), the software was able to produce a more complete and spatially coherent velocity data set than was possible for the older image pair. Figure 2 shows the edited velocity field of 244 vectors derived from this image pair. The length of the vector corresponds to the actual displacement of the reference-area center. It shows the discharge of numerous glaciers feeding into the ice shelf and the gradual acceleration of this ice toward the ice front. Two regions arc without velocity data. The first is the broad, featureless southeastern region where the lack of features prevented any opportunities for tracking. The other region is the area of longitudinal ridges near the top of the mapped grid. The orientation of the dominant ridges in this area prevented the software from finding acceptable maxima to the cross-correlations in the along-flow direction.
The ±0.5 pixel uncertainty in measuring displacement converts to a relative speed error (1σ) of ±8 ma−1. The accuracy due to co-registration adds an error component to the absolute accuracy which varies because of the lack of control to the south and east. Near control points, the position error of co-registration ( ± 1.02 pixels) converts to a speed uncertainty of ±16 ma−1. This error increases with distance from control, reaching a maximum at the southeast corner, where, based on the polynomial coefficients used in the warping, we estimate it may be as large as ±50 ma−1. Thus, the error in the absolute speed of the MSS-TM data set ranges from ±18 m a near rock to ±51 ma at the southeast extreme.
The velocity field derived from the Kosmos MSS image pair was more sparse but still contains 135 points (Fig. 3). The sparseness is a combined result of the longer time period (10.41 years) and the poorer resolution of this image pair. Enough matches were achieved to show the same basic pattern of flow. The more seaward extent of the ice shelf in this earlier period allowed some velocities to be measured beyond the ice-front position in 1989, including in Larsen Inlet where catastrophic retreat occurred between 1986 and 1989. The maximum speed in the central part of the ice shelf occupying Larsen Inlet was 309 ma1 over this interval. The extension of coverage to the south shows the effect of Drygalski Glacier as it spreads laterally once it enters The ice shelf. Clearly, this glacier is a major tributary of the northern Larsen Ice Shelf.
One advantage of the longer time period between the Kosmos and MSS images is that the uncertainties in velocity measurements are decreased. The relative accuracy (1σ) is ±3 mal . The co-registration-induced component of error is ±5 ma1, which, due to the third-order fit, varies throughout the image. However, due to the presence of control on Lindenberg Island and Larsen Nunatak, this error cannot grow in an unbounded fashion as with the MSS—TM data set. We suggest the error of the absolute speed in the Kosmos-MSS data set is ±6 ma−1.
The error in velocity azimuth depends on the position uncertainty of the feature match and the magnitude of the displacement. As a guide, we use a typical velocity of 200 ma1 and use the position uncertainty of ±0.5 pixel stated above. With these numbers, the typical 1σ error in velocity azimuth is ±2° for the recent MSS—TM data set and ±0.7° for the older, but longer duration, Kosmos-MSS data set. Of course, these velocity measurements do not represent instantaneous directions or speeds but are averages over the corresponding time interval. The smoothness of the velocity fields in Figures 2 and 3 supports these accuracy estimates of velocity magnitude and azimuth.
Comparison Of Image-Derived Velocity Fields
At 27 grid points, there were velocities from both the earlier and later time periods (Figs 2 and 3). Comparisons were made at most of these points between the measured velocity during the more recent MSS—TM time period and a prediction of the velocity based on the velocity during the older Kosmos-MSS period corrected for longitudinal strain rate and rotation rate (Table I). The values for longitudinal strain rate and rotation rate were derived from the MSS—TM data set, because it was more complete spatially, permitting the calculation of local values of these two parameters at nearly all of the common points using a centered-difference scheme. At six locations (noted in Table I), the longitudinal strain rate and rotation rate had to be calculated centered at an adjacent grid point. In two cases (also noted in Table I), data were insufficient for an estimate of these parameters. The data arc arranged into five flow regions and are discussed in order below.
In the “Dinsmoor/Bombardier Glacier” area, the ice is compressing longitudinally and extending laterally. The six common points indicate a slight acceleration with a mean velocity increase of 11.3 ma−1. The fact that there are six points in this region reduces the likelihood that the error is due to the random component of the measurement. However, this advantage has only a minor impact on the test of significance, because the random component of measurement error is smaller than the systematic component, as discussed earlier. The 1a magnitude for testing the significance of this change is ±17.1 ma−1, which is already larger than the mean velocity increase. This corresponds to only a 49% confidence level in the significance of this result. The change in velocity azimuth has a mean value of —2.5°. The lσ magnitude for significance of this component is ±2.1° —again near the lσ level of significance.
Two points in the margin of this flow have been separated out as “West Margin“, because they are spatially distinct. Adjacent data were not present to calculate longitudinal strain rates and rotation rates. Nevertheless, the two data sets show the expected counter-clockwise rotation in azimuth as another glacier feeds into the ice shelf just north of Fothergill Point. The changes in velocities are negligible.
As the ice from Dinsmoor and Bombardier Glaciers moves past Sobral Peninsula, it flows into the region named here “Big Curve”. The data in Table I show that this region has accelerated with a mean velocity increase of 29.9 ma−1. This is greater than the lσ value of uncertainty (±17.0 ma1 for eight data points) and can be assigned a 91% level of confidence. The significance of the mean change in azimuth, 4.1°, also is above 90%.
The next region considered is the unnamed glacier that enters Larsen Ice Shelf between Fothergill Point and Cape Worsley. Two of the three points in this region show the largest velocity increases in this study. The mean velocity increase is 50.8 ma−1, roughly equal to three times the a of ±17.5 ma−1 for three data points. These numbers imply a confidence level of over 99% but the fact that the longitudinal strain rates and rotation rates had to be calculated at adjacent grid points for two of the three points may also be responsible for some part of the indicated changes.
The final region, “Drygalski Glacier”, corresponds to ice entering the ice shelf south of Cape Worsley. It is limited to the south by the extent of the TM image. Again, an acceleration is calculated with a mean velocity increase of 29.1 ma1 and, as with the “Big Curve” region, the statistical significance test has a σ of ±17.0 ma−1. Λ 91% confidence level can be assigned to this result. The changes in azimuth are small but consistent with straight flow.
As discussed above, the errors in the absolute velocities are due primarily to possible systematic errors in the co-registration of image pairs. This error would tend to cause a uniform error in a single direction across any pair of images. The separate regions in this velocity comparison flow in many different directions yet all (except “West Margin”) show acceleration. This fact reduces the likelihood that systematic errors are responsible for the accelerations and raises confidence that the measured accelerations between 1975 and 1989 are real
Comparison With Ground Survey
A ground survey of a single line of surface markers on Larsen Ice Shelf was conducted during November 1991 by personnel from the Instituto Antártico Argentino (see Fig. I). This line extended from Larsen Nunatak to Sobral Peninsula with an average azimuth of 17° from true north. Weather conditions during the first survey (15 November 1991) were very warm and made it impossible to close the survey by sighting to any fixed point on Sobral Peninsula. 15 d later, after conditions had improved, a second survey of this line was conducted and Sobral Peninsula was occupied but no independently known positions could be tied into the survey to calculate absolute surveying errors.
Instrument precision can provide a partial estimate of errors. Angles between markers were measured with a Zeiss Th 2 theodolite and actual misclosures suggest an error of ±2” of arc. Distances between markers were measured with a C-1000 tellurometer with a stated single-measurement precision of 0.05 ft [1.5 cm] plus a scale error due to “atmospheric refractive-index determination and crystal-frequency drift” which is stated by the manufacturer to be “usually less than 5ppm”. The typical distance between markers was 2—4 km, so we assume here a distance-measurement accuracy of ±2.5 cm. If these errors are treated as random (the scale error may not be), they will accumulate at the rate of sqrt(N) where N is the number of markers already surveyed along the traverse. From the orientation of the direction of the traverse relative to the azimuths of the marker's motion, the largest standard errors at the most distant marker (P14) are ±2 ma−1 in speed and ±1° in azimuth.
Comparison of image-derived velocity data sets

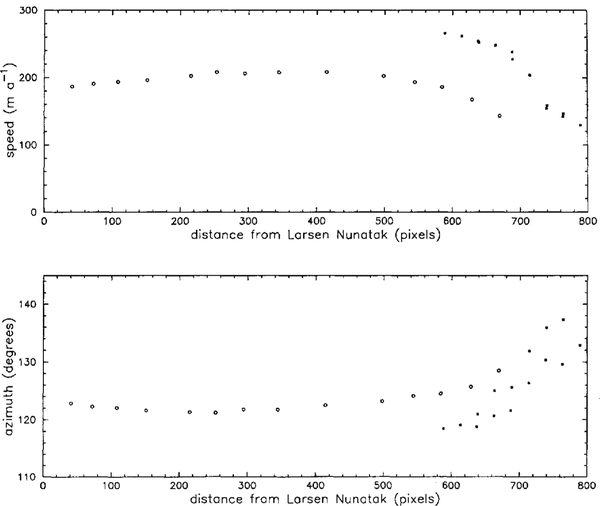
While these facts leave unresolved the absolute accuracy of the velocities derived from the short-period survey, we nevertheless compare them with the image-derived data. Figure 4 compares the velocity data along the surveyed profile. Image-derived velocities within 25 pixels (712.5 m) of the surveyed profile have been projected orthogonally on to a profile that runs through the survey line. The few occurrences of two points at nearly the same profile distance on the MSS—TM profile are a result of the surveyed profile being nearly parallel (4°) to the velocity grid. The difference between these pairs of points shows that the effect of longitudinal strain rate is negligible for this comparison. Over the segment of overlapping profiles, the profiles have the same shape but a rather consistent onset of about 75 ma−1 in velocity and 6° in azimuth. The relative smoothness of each profile suggests small errors for each profile and the possible presence of a systematic error.
Speed and azimuth along a line following the surface traverse from Larsen Nunatak toward Sobral Peninsula discussed in the text. Open circles are the surface-survey data (see Figure 1 for positions). Solid squares are image-derived velocity data from the MSS—TM data set within 25 pixels of the line, projected orthogonally on to the line.

We have searched extensively for systematic errors, without success. Given the smoothness of the survey profiles, the most obvious source of a systematic error in this data set is in the survey of the first point. It, however, was surveyed 13 separate times from two stationary points on Larsen Nunatak between 11 November and 6 December 1991 with a resulting speed consistent with the value obtained from the two ice-shelf traverse surveys.
The image data also were examined in a number of ways in a search for systematic errors. Different control points and polynomial orders for warping were tried. Differences always fell within the calculated errors stated above. An interesting spin-off investigation centered on the fact that a systematic shift of the MSS pixels by 5.5 pixels in the sample direction would bring both the velocity magnitude and azimuth into agreement with the ground-survey data. This shift had to be limited to the ice shelf itself because control points on the rock were matched during the co-registration process. Thus, it would need to be an internal distortion within a limited area of the ~fSS image. Discussion with a mapping expert with vast experience using Landsat data for mapping and calibration from the beginning of the satellite series stated categorically that internal distortion of this magnitude for Landsat data collected in the mid- to late 1980s exceeded anything he had ever seen or heard of and was, therefore, highly unlikely (personal communication from A. Colvocorresses).
Variations in satellite pitch, roll and yaw all generate non-systematic distortions that vary across the image (Sabins, 1986). The purpose of co-registration was to remove these variations and the statistical measure of the co-registration indicates that this was successful. If we assume that the ratio of the pixel sizes between the MSS and the TM is exactly 2:1, we can calculate the magnitude of this distortion introduced into the image by the warping process. In the southeastern part of the ice shelf the strain introduced would be 0.5% in x and 0.2% in y. Over 500 pixels, the approximate distance from the control to the southeast extreme of the ice shelf in the TM image, amounts to 2.5 pixels in x and 1.0 pixels in y. This is not sufficient to explain the differences between the profiles which occur much closer to Sobral Peninsula.
Conclusions
We Have Presented Data on the velocity of the northern Larsen Ice Shelf during three periods, 1975-86, 1986-89 and a 15 d period in 1991. Significant changes in velocity seem to have taken place between these time periods. It is known that significant retreat of the ice shelf occurred over this time interval (Skvarca, 1993). The pattern of accelerations from 1975 to 1989 suggests that the velocity changes were not driven by the retreat of the ice shelf. The greatest acceleration during this period was in the section of the ice shelf fed by the glacier between Fothergill Point and Cape Worsley, not in that section farther north experiencing the greatest ice-front retreat. Acceleration of the ice might be caused by warmer temperatures occurring in the Antarctic Peninsula region. The acceleration might also be accompanied by thinning which could, in turn, be responsible for the retreat of the ice front.
The difference between the 1986—89 image-derived velocities and the velocities of the 1991 surface survey, taken at face value, indicate a deceleration of the ice as the ice front retreated. If these changes are real, then the northern Larsen Ice Shelf is undergoing dramatic oscillations in flow rate. We hope to obtain more high-resolution imagery that avoids the control limitations of the TM image used in this paper and spans the time period of the ground survey. In addition, the ground survey should be repeated with a longer time base and be closed on rock, as was the second of the surveys discussed here, to constrain more tightly that data set. When these two additions to the data set are complete, some of the unresolved questions posed in this paper will be answered.
Acknowledgement
This work was supported by U.S. National Science Foundation grant DPP-9018127.