1. INTRODUCTION
Image thresholding and morphological analysis of objects are common methods of ship detection from Synthetic Aperture Radar (SAR) data (Chaturvedi et al., Reference Chaturvedi, Yang, Ouchi and Shanmugam2012). In SAR images, land has higher reflectance values than open sea. Therefore, land masking is an essential step before applying ship detection algorithms to SAR images (Greidanus et al., Reference Greidanus, Clayton, Indregard, Staples, Suzuki, Vachoir, Wackerman, Tennvassas, Mallorquí, Kourti and Ringrose2004; Keramitsoglou et al., Reference Keramitsoglou, Cartalis and Kiranoudis2006; Margarit, 2009; Montuori et al., Reference Montuori, Nunziata and Migliaccio2010; Pelizzari, Reference Pelizzari2011). One of the major concerns in SAR-based ship detection is edge extraction. This is critical in images of complicated geographical areas such as the coastal regions of South Korea which possesses many small islands and exposed rocks, complicated by a large tidal range (Jeong et al., Reference Jeong, Kotov and Lee2013). During land masking, small land objects should be properly masked out in order to reduce the numbers of false alarms during ship detection (Brusch et al., Reference Brusch, Lehner, Fritz, Soccorsi, Soloviev and van Schie2011). Moreover, accurate land maps are also useful in assisting detection of sea surface slicks, wind and wave fields, coastal erosion, development of new structures along the coastline, and other features from high-resolution SAR images (Biamino et al., Reference Biamino, Borasi, Cavagnero, Croce, Di Matteo, Fontebasso, Tataranni and Trivero2015; Jiang et al., Reference Jiang, Wang, Ziou and Zaart1999; Kim et al., Reference Kim, Yang, Oh and Ouchi2014).
Coastline detection algorithms are generally operated in two modes, “shape” and “image” (Margarit et al., Reference Margarit, Barba and Tabasco2009). In the shape method, land masking is achieved by superimposing an archived coastline available in the form of shape files (collections of latitude and longitude pairs) (Margarit et al., Reference Margarit, Barba and Tabasco2009). The accuracy increases with the increase in number of points used. Some freely available shoreline files are found at several resolutions, including 90 m resolution (Slater et al., Reference Slater, Garvey, Johnston, Haase, Heady, Kroenung and Little2006). One of the most commonly utilised shoreline databases is called the Global Self-consistent, Hierarchical, High-resolution Shoreline (GSHHS) which possess a good resolution shoreline data set (Brusch et al., Reference Brusch, Lehner, Fritz, Soccorsi, Soloviev and van Schie2011; Wessel and Smith, Reference Wessel and Smith1996). Another public domain land-water mask is the Shuttle Radar Topography Mission (SRTM) Water Body Data (SWBD) produced by exploiting data acquired during the National Aeronautics and Space Administration's (NASA's) space shuttle radar topography mission (Biamino et al., Reference Biamino, Borasi, Cavagnero, Croce, Di Matteo, Fontebasso, Tataranni and Trivero2015; Karvonen, Reference Karvonen2015; Wessel and Smith, Reference Wessel and Smith1996). However, compared to these coastline maps, Electronic Navigational Chart (ENC)-based coastline data is of much higher resolution.
The image approach exploits image analysis techniques (for example, segmentation and edge detection) in order to isolate the coastline for building a mask by discriminating land pixels from sea pixels (Margarit et al., Reference Margarit, Barba and Tabasco2009; Romeiser et al., Reference Romeiser, Breit, Eineder, Runge, Flament, De Jong and Vogelzang2005). Image segmentation is the process of partitioning a digital image into several regions of similar features (Al-amri et al., Reference Al-amri, Kalyankar and Khamitkar2010; Ramadevi et al., Reference Ramadevi, Sridevi, Poornima and Kalyani2010; Senthilkumaran and Rajesh, Reference Senthilkumaran and Rajesh2009), and edge detection is one of the segmentation processes commonly used for digital images (Kodors and Zarembo, Reference Kodors and Zarembo2013). Many techniques for segmentation are in use: interferometry on SAR image pairs (Dellepiane et al., Reference Dellepiane, De Laurentiis and Giordano2004), wavelet-based active contour model (Della Rocca et al., Reference Della Rocca, Fiani, Fortunato and Pistillo2004), morphological filtering (Shu et al., Reference Shu, Li, Yousif and Gomes2010), non-local fuzzy C-means algorithm (Feng et al., Reference Feng, Jiao, Zhang, Gong and Sun2013), mathematical morphology (Mashaly et al., Reference Mashaly, AbdElkawy and Mahmoud2014), etc.
Each of these approaches has advantages as well as some limitations. For instance, despite the high quality of freely available coastline databases, they cannot be directly applied to satellite images as the images have often been georeferenced using only the coordinates of the four image corners without ground control points (Biamino et al., Reference Biamino, Borasi, Cavagnero, Croce, Di Matteo, Fontebasso, Tataranni and Trivero2015; Greidanus et al., Reference Greidanus, Clayton, Indregard, Staples, Suzuki, Vachoir, Wackerman, Tennvassas, Mallorquí, Kourti and Ringrose2004; Trivero et al., Reference Trivero, Adamo, Biamino, Borasi, Cavagnero, De Carolis, Di Matteo, Fontebasso, Nirchio and Tataranni2016). Therefore, the geo-positioning of the satellite images has limited accuracy and results in image shifts in the azimuth direction, and a consequent displacement of the land mask resulting in shifting of shorelines from the actual coastline and associated false alarms near the coast (Biamino et al., Reference Biamino, Borasi, Cavagnero, Croce, Di Matteo, Fontebasso, Tataranni and Trivero2015; Greidanus et al., Reference Greidanus, Clayton, Indregard, Staples, Suzuki, Vachoir, Wackerman, Tennvassas, Mallorquí, Kourti and Ringrose2004; Trivero et al., Reference Trivero, Adamo, Biamino, Borasi, Cavagnero, De Carolis, Di Matteo, Fontebasso, Nirchio and Tataranni2016). On the other hand, commonly available land masks usually have accuracy limitations with small islands, intertidal areas and coastal man-made constructions leading to false alarms (Greidanus et al., Reference Greidanus, Clayton, Indregard, Staples, Suzuki, Vachoir, Wackerman, Tennvassas, Mallorquí, Kourti and Ringrose2004). To compensate for these limitations, some methods exclude a safety zone near the coast, but that also leads to potential misdetections (Greidanus et al., Reference Greidanus, Clayton, Indregard, Staples, Suzuki, Vachoir, Wackerman, Tennvassas, Mallorquí, Kourti and Ringrose2004). Moreover, these methods cannot easily solve the issue of masking very small islands, exposed rocks and sea stacks. Therefore, in detection of small objects such as ships from SAR images, accurate discrimination and masking of land for those regions possessing many small islands and intertidal zone remains to be solved (Yang and Ouchi, Reference Yang and Ouchi2008). Considering these issues we have applied a combination of both methods. The inaccuracies in image mode operation were avoided by supporting image processing with reference shape files. The proposed algorithm takes a temporary land mask image (produced from KOMPSAT-5 images) as input and finalises the land objects from the temporary land mask with the help of a decision-based archived shoreline.
2. MATERIALS AND METHODS
2.1. Study area and selected KOMPSAT-5 images
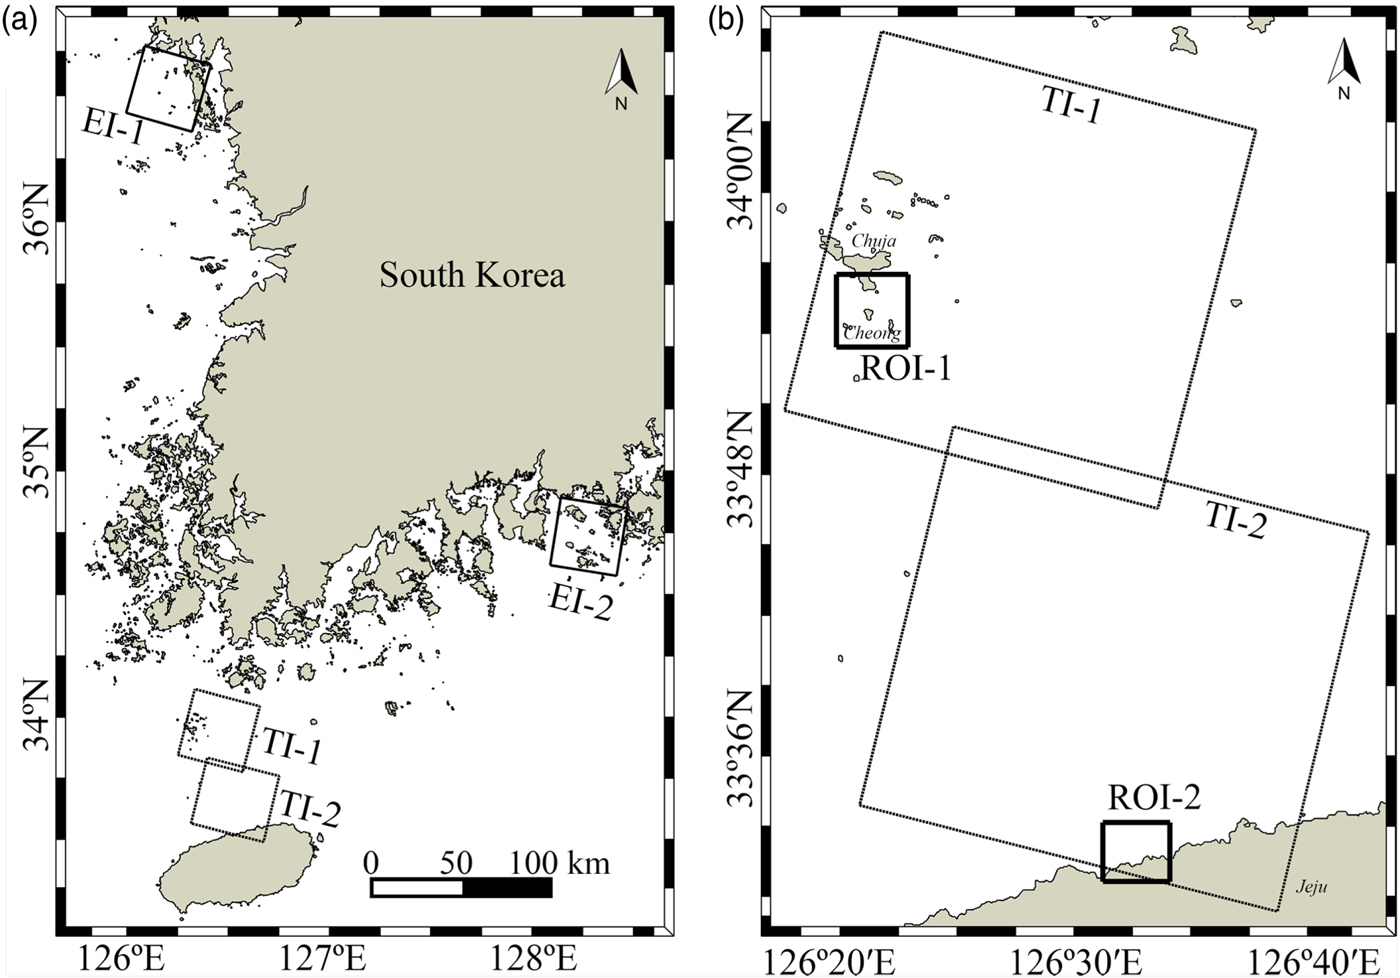
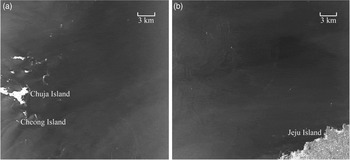
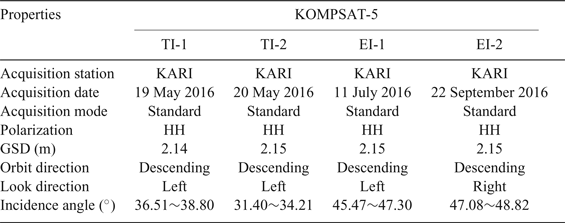
The proposed method of land masking was first applied to two KOMPSAT-5 images of two different coastal areas in the southern portion of the Korean Peninsula which possess many small islands and exposed rocks (TI-1 and TI-2 in Figure 1). Later on, to check whether this procedure could be used as a general method of land masking in the coastal waters of South Korea, the method was applied to some other images of different regions from which only two images (EI-1 and EI-2 in Figure 1(a)) of complicated regions (geographically complicated due to possessing many small islands) are shown here. The TI-1, TI-2, EI-1 and EI-2 images were acquired on 19 May 2016 10:03:56 UTC, 20 May 2016 10:00:33 UTC, 11 July 2016 10:13:08 UTC, and 22 September 2016 09:15:31 UTC, respectively. TI-1 includes mainly Chuja Island, Cheong Island and some exposed rocks (Figure 2(a)), and TI-2 includes some northern portions of Jeju Island (Figure 2(b)). To show the changes occurring in several steps of the proposed method as well as for comparison with other land masking methods, smaller areas from TI-1 and TI-2 images are considered as regions of interest (ROI-1 and ROI-2, respectively in Figure 1(b) as bordered by small rectangles).
Research area for applying the proposed land masking to KOMPSAT-5 SAR images (the boxes in (a)). Two SAR images (TI-1 and TI-2) were used for the land masking algorithm development, and two images (EI-1 and EI-2) for the method evaluation. ROI-1 and ROI-2 in (b) represent the regions of interest used for the algorithm validation.


KOMPSAT-5 is operated by Korea Aerospace Research Institute (KARI). It is the first South Korean satellite which is capable of acquiring X-band (9.66 GHz) SAR Interferometry (InSAR) at a spatial resolution of up to 1 m (Lee, Reference Lee2010). It provides all-weather, day and night SAR images for various purposes including ocean monitoring of the Korean Peninsula (Krebs, Reference Krebs2017). KOMPSAT-5 is operated in dual polarisation modes with 10° to 45° incidence angles, and is at an altitude of 550 km (Krebs, Reference Krebs2017). It is capable of collecting imagery in three different modes, namely High Resolution, Standard and Wide Swath Modes (SI Imaging Services, 2015).
The images used in this study are of Level 1A in Standard Mode, which is considered to be the most common imaging mode. Data at this level is already radiometrically corrected and thus requires only geocorrection (SI Imaging Services, 2015). The main imaging characteristics of this mode are Ground Sample Distance (GSD) less than or equal to 3 m with a minimum swath of 30 km (SI Imaging Services, 2015). The properties of the TI-1 and TI-2 images are azimuth angle −90°, wavelength 0.031034 m, frequency 9.66 GHz, altitude around 557 km and azimuth beam width 0.3512°. Some other important properties of the images used in this study are shown in Table 1.
Properties of the KOMPSAT-5 images used in this study.

2.2. Edge detection and land masking
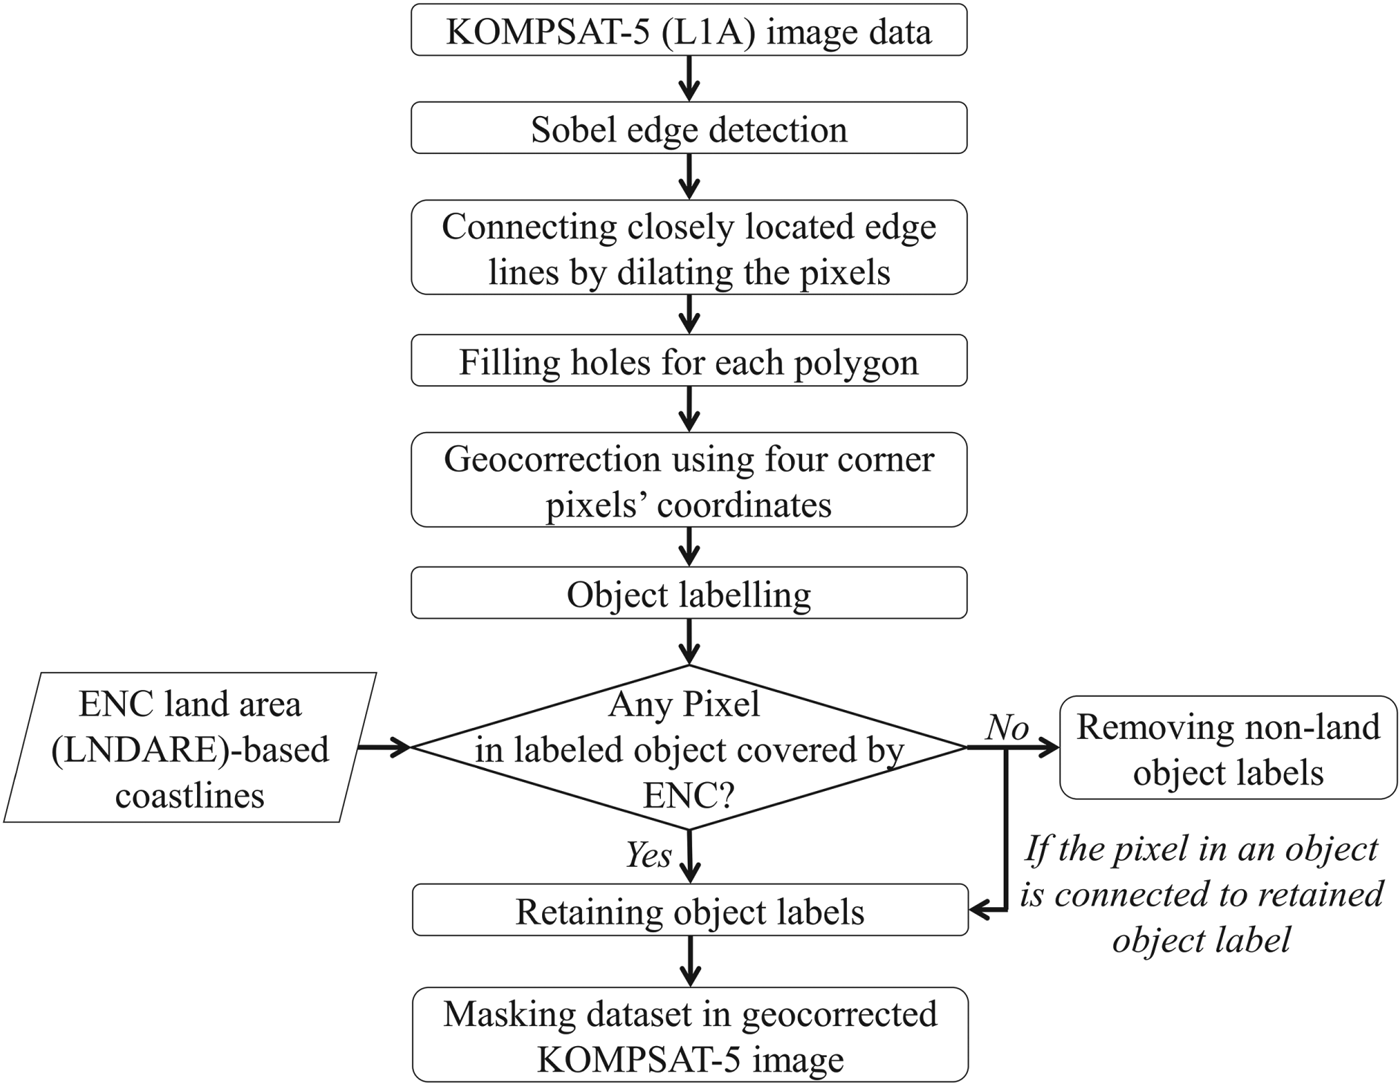
An edge of an object is an image in a region where changes in image intensity are significant (Kodors and Zarembo, Reference Kodors and Zarembo2013; Singh and Kaur, Reference Singh and Kaur2013). Thus, an edge can be defined as a set of connected pixels that lie on a particular boundary between two regions (Singh and Kaur, Reference Singh and Kaur2013). Edges are used to define the ability to measure the transitions in a meaningful way by preserving useful structural information about object boundaries (Canny, Reference Canny1986; Simpson, Reference Simpson1990; Singh and Kaur, Reference Singh and Kaur2013). When edge points are located, complete boundaries can be formed by linking the points (Singh and Kaur, Reference Singh and Kaur2013). Detection of object edges usually consists of three steps: i) filtering to reduce image speckle noise; ii) enhancement to detect changes of intensity in the neighbourhood of a point (pixel) where the gradient magnitudes are computed to indicate the changes of intensity; and, iii) detection to group all elements into two sets of black and white pixels often followed by thresholding (Ramadevi et al., Reference Ramadevi, Sridevi, Poornima and Kalyani2010; Senthilkumaran and Rajesh, Reference Senthilkumaran and Rajesh2009). The key steps during the proposed land masking of KOMPSAT-5 images are shown in a flowchart (Figure 3). A detailed description of each step follows.
Flowchart of major steps in the proposed land masking.

2.2.1. Object Boundary Extraction
To extract the boundaries of all objects both the Sobel (Gao et al., Reference Gao, Zhang, Yang and Liu2010; Zhang et al., Reference Zhang, Yan and Huang2009) and Canny (Canny, Reference Canny1986; Wall et al., Reference Wall, Muller-Karger, Roffer, Hu, Yao and Luther2008) edge detection filters were separately applied to the images for comparison. The Sobel filter detects strong edges in the horizontal and vertical directions, and all the edges are extracted using a threshold value (Shahane et al., Reference Shahane, Choukade and Diyewar2015; Sobel, Reference Sobel1990). If high threshold values are applied, signals from very small islands or exposed rocks would also disappear along with the signals from ships. Therefore, suitable threshold values were determined manually (Liu and Jezek, Reference Liu and Jezek2004) after applying a set of threshold values starting from 0 and gradually increasing by 0.05 intervals until the edges of all objects were obtained. In this study, a threshold value of 3 was found to produce the best results for all images. The produced images were of binary types where the object edges were generated as thin broken lines. However, many lines were also generated inside the objects during this edge extraction which did not hamper the (outermost) edge extraction. In contrast, the Canny edge detection filter works in a multi-stage process where initial smoothing of the image is achieved by using a low-pass Gaussian convolution filter, followed by the use of the derivative of the Gaussian filter for measuring the gradient of the image, then assigning edges to strong and weak categories by sensitivity threshold, and finally keeping the strong edges as well as only those weak edges which are connected to any strong edges (Boland and Murphy, Reference Boland and Murphy2001; Costa et al., Reference Costa, Antonucci, Boglione, Menesatti, Vandeputte and Chatain2013; Reference Costa, Negretti, Vandeputte, Pallottino, Antonucci, Aguzzi, Bianconi and Menesatti2014). In this study, the default value of the standard deviation (square root of two) was used for the Gaussian smoothing filter (Costa et al., Reference Costa, Negretti, Vandeputte, Pallottino, Antonucci, Aguzzi, Bianconi and Menesatti2014). High values for the sensitivity threshold were automatically extracted from the highest value of the gradient magnitude of the image (Costa et al., Reference Costa, Negretti, Vandeputte, Pallottino, Antonucci, Aguzzi, Bianconi and Menesatti2014), and 0.4 times the high threshold value was used as the lower threshold.
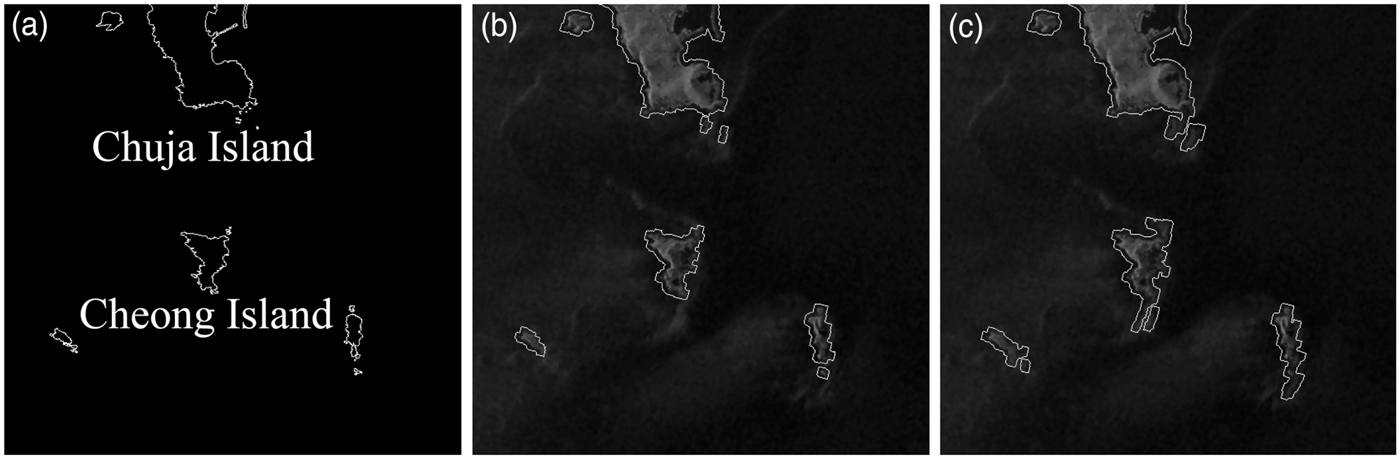
Othman et al. (Reference Othman, Haron and Kadir2009) found that Canny edge extraction produced better edge detection results (thin and smooth edges) in medical images, whereas Kashyap et al. (Reference Kashyap, Vyas, Raghuwanshi and Sharma2015) found better results in boundary extraction of a hand palm image with noise using the Sobel method with a median filter. In this study, the images in some places contain very small islands or exposed rocks near the larger islands. For instance, in Figure 4(a), portions of Chuja Island and nearby exposed rocks can be observed in the ENC-based coastline map. These very small islands or exposed rocks were found to be correctly identified by the Sobel edge extraction method (Figure 4(b)). In contrast, in the Canny edge detection method (Figure 4(c)) some non-land pixels along with the exposed rocks also became fused to the larger islands, because weak edges in the output are included while they are connected to strong edges (Boland and Murphy, Reference Boland and Murphy2001; Naz and Rao, Reference Naz and Rao2014). Therefore, finally the Sobel edge detection method was selected to be used for edge extraction.
Land boundary detection results for ROI-1 (Figure 1) by ENC-based coastline map (a), proposed Sobel-ENC-based land masking (b), and Canny-ENC-based land masking (c).

2.2.2. Objects detection
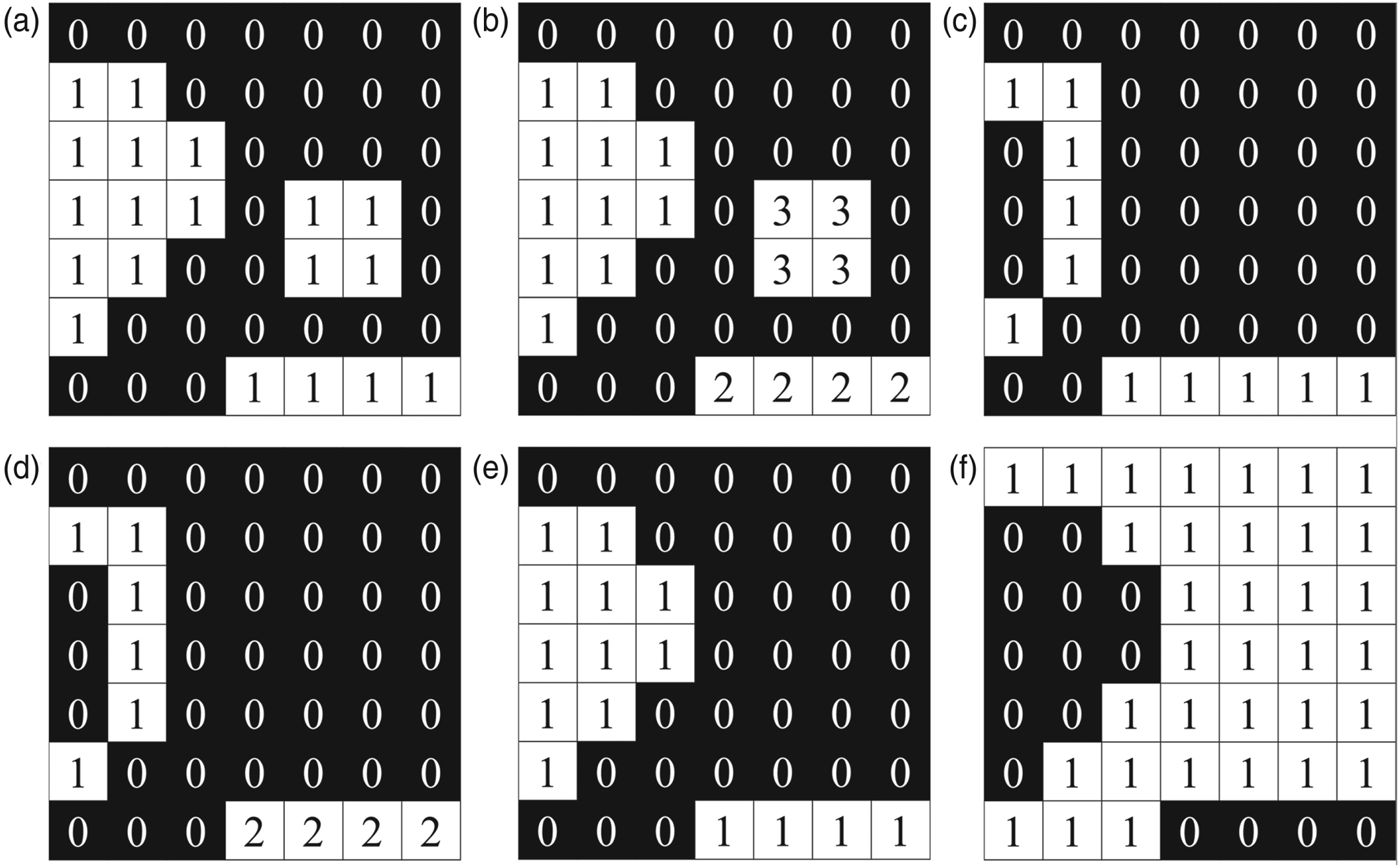
The broken lines detected in the previous step were thickened by dilating the pixels. Thus, closely located edge lines became connected which resulted in formation of many continuous lines on the object areas of which the outermost polygons represent the boundaries. This dilation of pixels also resulted in addition of a buffer zone around the outermost boundaries (for the current study, seven pixels towards the sea). Afterwards, the pixels inside the completed object boundaries were filled up by assigning value 1.0 (similar to that of the boundary pixel values). The changes in pixel values during some crucial steps of the proposed method are schematically presented in Figure 5. From Figure 5(a) it can be seen that all of the detected object pixels contain value 1, and rest of the pixels (black pixels containing value 0) represent sea.
Schematic demonstration of changes in pixel values during some crucial steps of land masking: object detection (a), object labelling (b), ENC-based coastline (c), elimination of non-land object boundaries from (b) figure (d), retained land objects (e), and creating land mask (f).

2.2.3. Geocorrection and object labelling
Geocorrection was applied after detecting all of the objects in an image. It was accomplished using coordinates of the four corners of each image through constructing an affine spatial-referencing matrix. After geocorrection, detected areas were labelled separately. In the schematic example (Figure 5(b)) the detected three object pixels are labelled by three numbers from 1 to 3. For the purpose of the demonstration, it is assumed that the label 3 represents a ship (located near the centre of the image).
2.2.4. ENC land area-based coastlines and other types of coastlines
An ENC contains various types of hydrological data such as land area, coastlines, depths, etc, at very high resolution with global coverage. In this study, ENC-based land area map data was used to obtain the coastline map. The ENC land area (LNDARE) data are encoded as three types of objects, namely point, line and area objects (International Hydrographic Organization (IHO), 2014) from which the point-type data is used. ENC data (released by the Korea Hydrographic and Oceanographic Administration (KHOA), South Korea) was converted to the shape file format and used to extract coastline as polygons. However, for the observation of different coastal regions of the Korean Peninsula we used all six codes of KHOA provided ENCs (http://www.khoa.go.kr/eng/kcom/cnt/selectContentsPage.do?cntId=21050300).
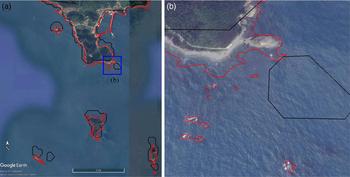
The point-type geolocation information of shape files in the ENC was used to create binary maps similar to the coverage of respective geocorrected KOMPSAT-5 images. ENC coastlines cover coastline information of not only large islands but also very small islands, exposed rocks, sea stacks, etc. The superiority in delineation of very small islands and exposed rocks by an ENC over the freely available coastline data such as GSHHS (Wessel and Smith, Reference Wessel and Smith1996) is depicted in Figure 6 by superimposing those on Google Earth images for the ROI-1 area (see Figure 1(b)). GSHHS is available in shape file format with a higher resolution mode developed and maintained by the University of Hawaii, and the National Oceanic and Atmospheric Administration (NOAA) Laboratory (Pelizzari, Reference Pelizzari2011). We used a Level 1 shape file for shoreline data which contains continental land masses and ocean island shoreline data. Very small obstacles just under the sea surface in the shallow areas may create noise in SAR images. However, using the ENC-based coastline map data only the land areas were masked out. Noticeably, very small rocks which could not be easily detected by other methods of land masking were also masked here, and depth data were also referred to in this process. For a better view, a small area (the blue rectangle) in Figure 6(a) is enlarged as Figure 6(b) from which it can be seen that in comparison to a Google Earth map, a few small exposed rocks in the southern parts of Chuja Island are also detected by the ENC-based coastline map, but not by the GSHHS map. Moreover, a small piece of land is detected as an isolated land mass with a shift towards the southeast. Therefore, in this study the ENC-based maps were used to delineate the land; small islands and exposed rocks were thus masked out properly. As the Sobel edge detection and ENC-based map is combined for land masking, hereafter in this manuscript the proposed method will be referred to as the Sobel-ENC method in order to differentiate it from other common methods of land masking.
Suitability of ENC-based coastline (red polygons) over GSHHS-based coastline (black polygons) as presented by superimposing on Google Earth image (a) for ROI-1 (Figure 1). The enlarged image (b) for the blue box in (a) indicates mismatching for GSHHS-based coastline.

2.2.5. Elimination of non-land object labels
The object-labelled images contained large islands, very small islands, exposed rocks and ships from which the large islands as well as small islands and exposed rocks need to be identified for land masking purposes. The ENC-based coastline comprises logically true data values only for coastline pixels. As the ships in the sea are not covered by the ENC-based coastline data, the object labelled image pixels were multiplied by the ENC-based image pixels in order to eliminate those non-land (ships) labels. In the schematically illustrated ENC-based coastline image (Figure 5(c)), the coastline pixels (white pixels with value 1) do not pass through the area of object number 3 (assumed to be a ship) in Figure 5(b). Thus, multiplying the object labelled image by the ENC-based coastline image results in elimination of the non-land objects (label 3 in Figure 5(d)); thus only labels 1 and 2 are retained. Now these two retained labels' pixels in the object labelled image (Figure 5(b)) are converted to 1 as shown in Figure 5(e). For land masking purposes, the retained object pixel values were finally converted to 0, and the sea pixels were converted to 1 (Figure 5(f)).
2.3. Application of Ship Detection Algorithm
The KOMPSAT-5 images were geocorrected again and the land areas including small islands and exposed rocks were masked out using the produced land mask image. Afterwards, a ship detection algorithm previously developed by the Laboratory for Satellite Oceanography & Marine Safety (LaSOMS), Marine Safety Research Center, KIOST, South Korea was applied to the land masked images. The algorithm takes land masked images as inputs and produces outputs as maps where the detected ships are shown as bordered and coloured objects, as well as saving the information of detected ships as a shape file format.
3. RESULTS AND DISCUSSION
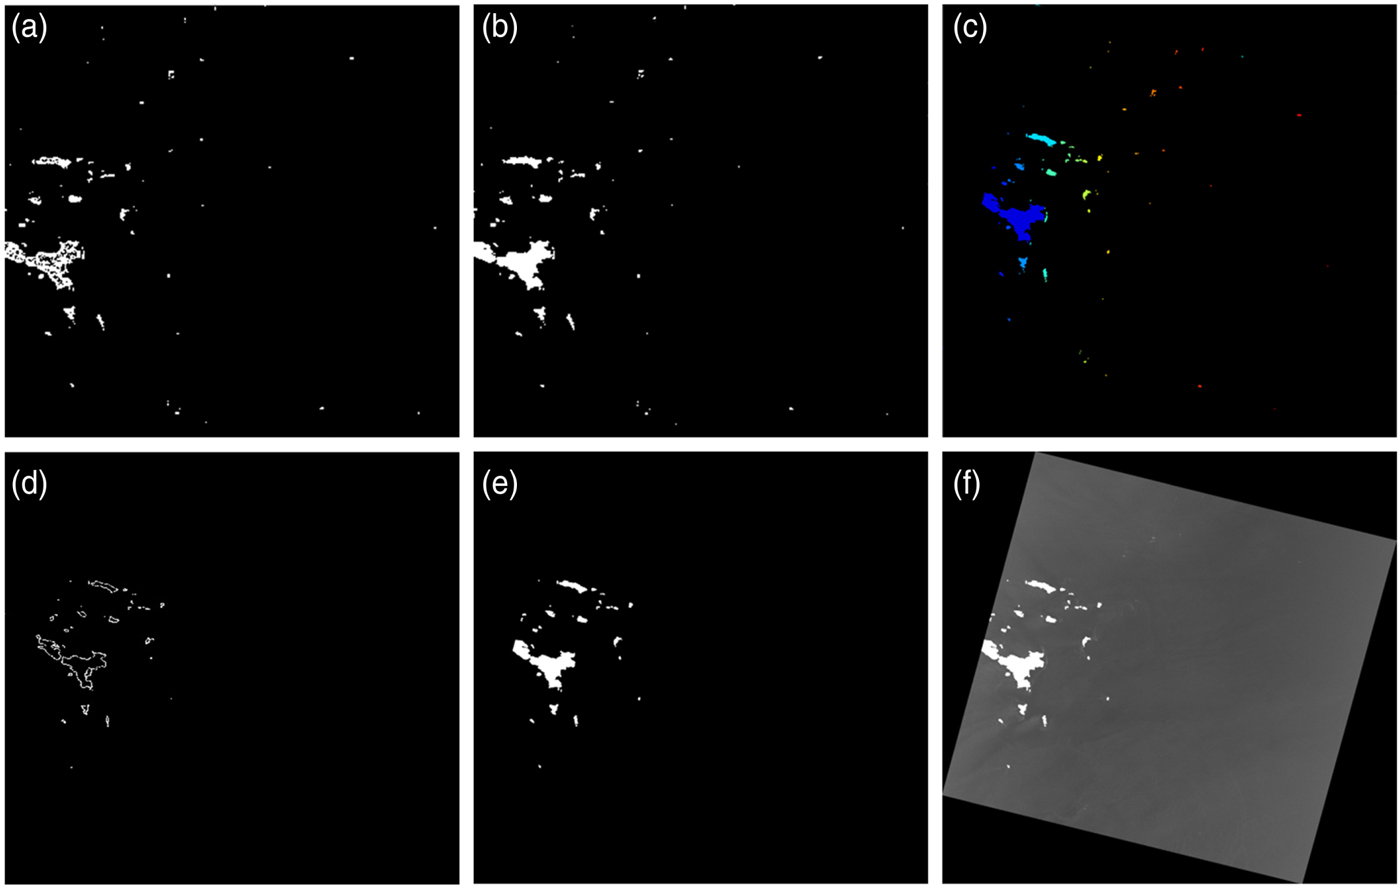
Following the proposed Sobel-ENC method we obtained good results in land masking including masking of very small islands and exposed rocks. Though the proposed procedure was applied to the whole area of the two KOMPSAT-5 images, for better illustration the changes in ROI-1 area during the various steps of land masking are shown in Figure 7. From Figure 7(a) it can be seen that the broken lines are connected as created by applying Sobel edge extraction; thus, complete boundaries of all objects are obtained. In the following step, all of the objects are detected by filling up the areas inside object boundaries (Figure 7(b)). Next, geocorrection was applied, followed by labelling of the detected objects, as shown by assigning different colours (only for illustration purposes) to each of the objects in Figure 7(c). In Figure 7(d) the ENC-based coastline is shown where the lines representing coastlines are thickened for visualisation purposes. The image for land masking is prepared by discarding all of the labelled objects that are not crossed by an ENC coastline. This is done by multiplying the images of Figures 7(c) and 7(d) (changes in pixels values are schematically shown in Figure 5) which resulted in the extraction of only land objects such as large and small islands, and exposed rocks (Figure 7(e)); thus the non-land objects (shades of red and orange colours in Figure 7(c)) were appropriately eliminated. Finally, using retained object label information, the respective KOMPSAT-5 image was properly masked (Figure 7(f)).
Application of TI-1 SAR image to land masking according to the procedure in Figure 3. The images obtained at each step are SAR edges (a), object detection (b), geocorrection and object labelling (c), ENC-based coastline (d), elimination of non-land object labels (e), and land masked image (f).

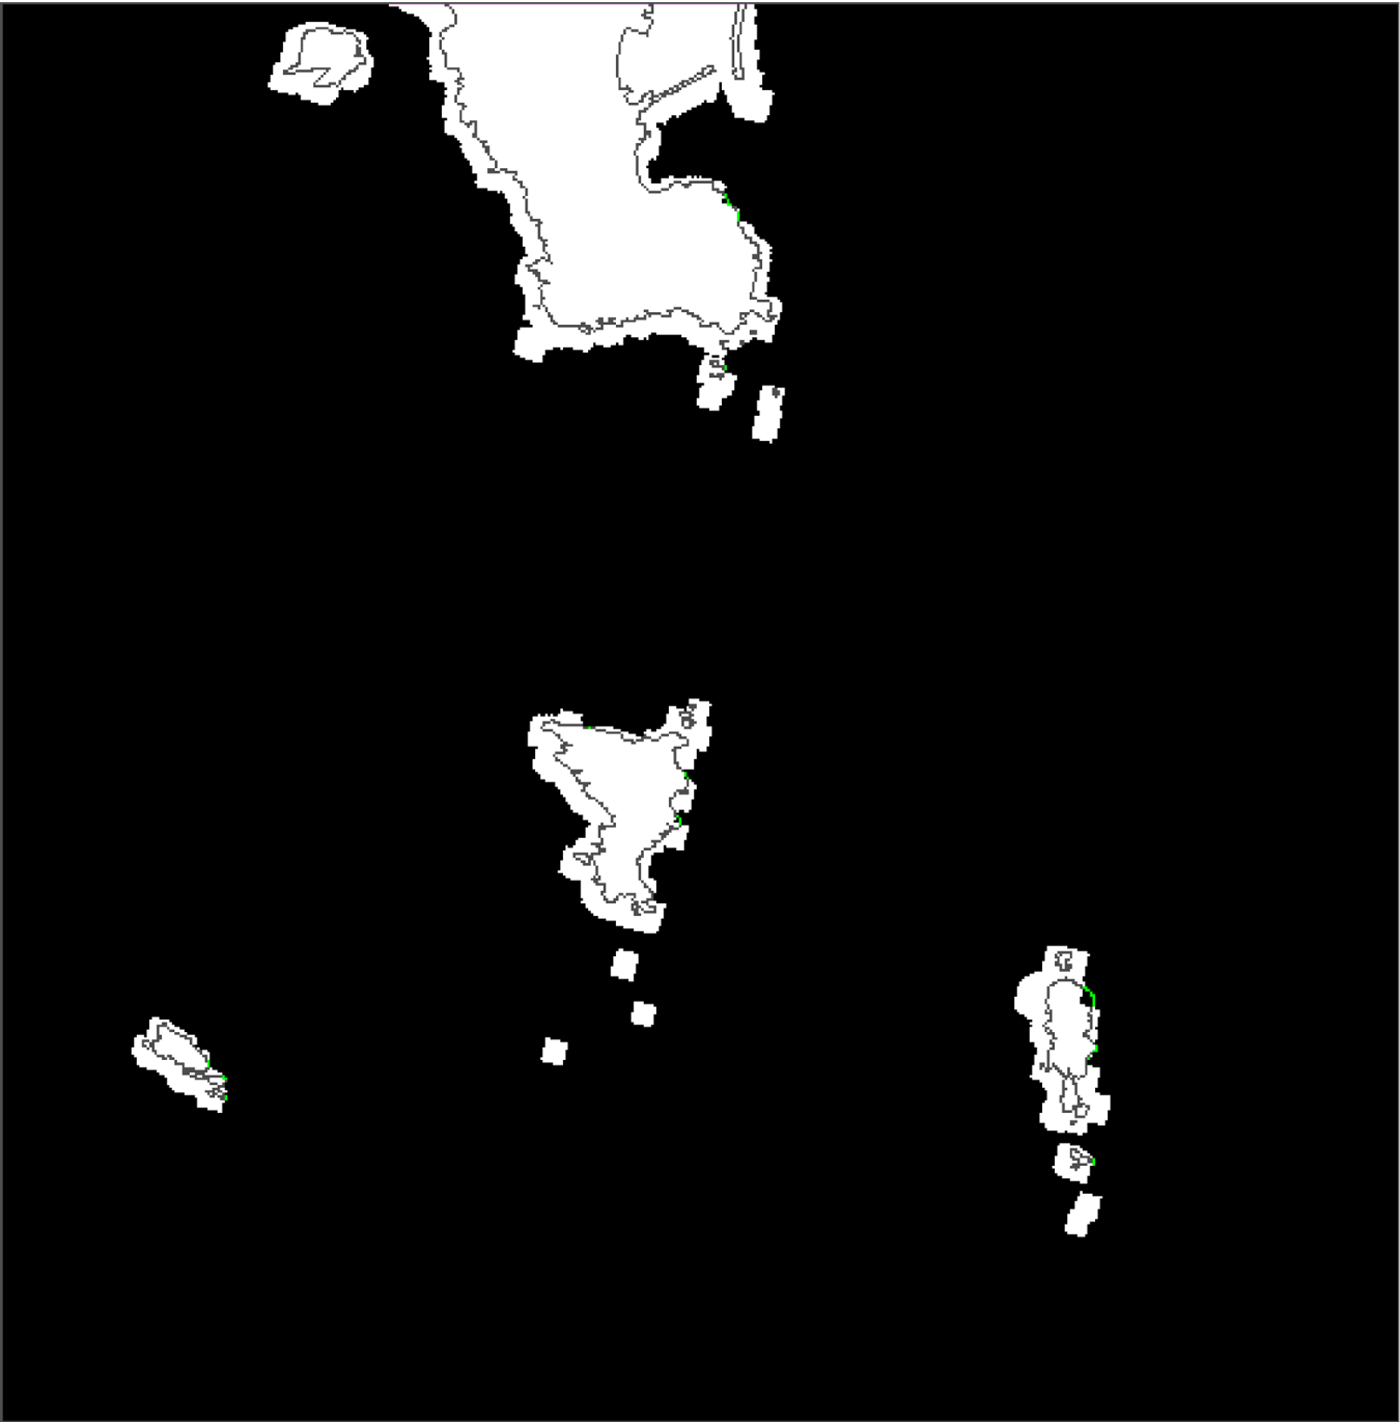
For comparison purposes, ENC-based coastlines are superimposed on the detected objects image for the ROI-1 area (Figure 8). It can be clearly observed that three small objects at the south of the island in the centre of the image and the southernmost small object do not match with the ENC coastline. These objects were removed during the proposed method of land masking through multiplication of ENC by object labelled images (Figure 7(e)).
Comparison of KOMPSAT-5 based land areas (white patches) and ENC coastline (dark grey line) for ROI-1 (Figure 1).

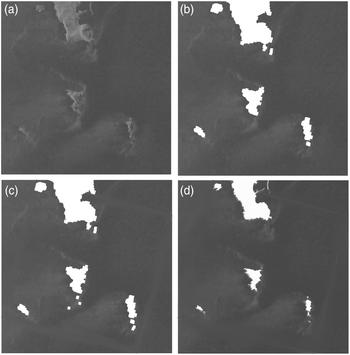
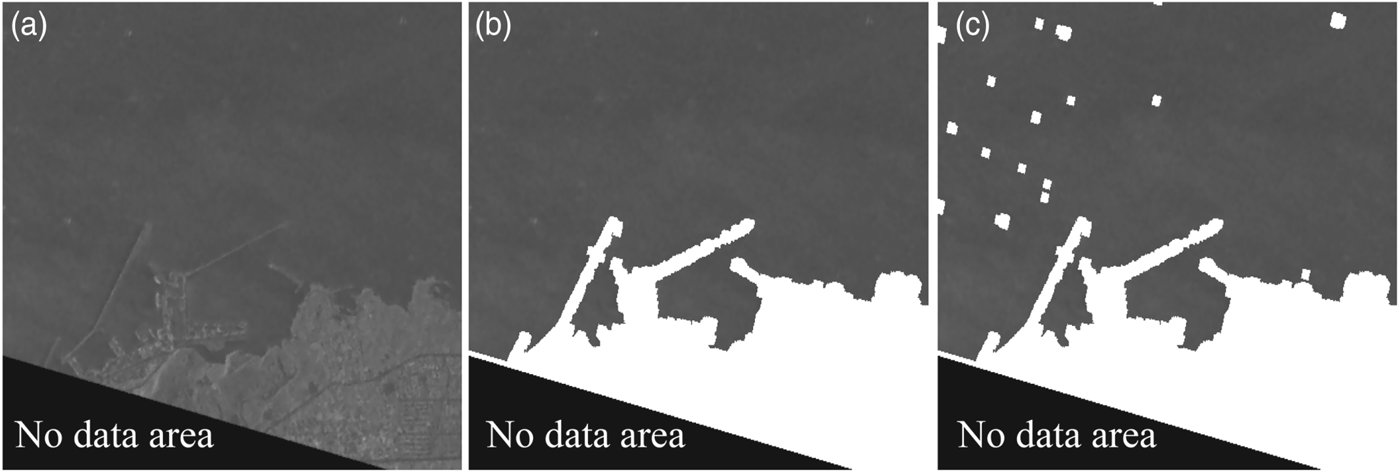
The results of land masking using different types of coastline maps for ROI-1 and ROI-2 are compared in Figures 9 and 10, respectively. Figures 9(a) and 10(a) show the geocorrected KOMPSAT-5 intensity images. From Figure 9(b) it can be seen that the proposed Sobel-ENC method has correctly masked out all land objects. Some speckle noise existed near the southern parts of larger land areas at the centre and south-eastern part of the Sobel method results (Figure 9(c)). When only an ENC map was used for land masking, some objects were not detected at the northern east corner of Chuja Island. In Figure 10 the black areas near the leftmost lower side of the images an outside of TI-2 coverage (refer to Figure 1(b)). It can be seen that the proposed Sobel-ENC method has detected the land (Figure 10(b)), but, in Figure 10(c) we can see that in the Sobel-only method many small objects still exist in the land mask image. Thus, the proposed Sobel-ENC method produced better land masking results.
Land masking results for ROI-1 (Figure 1) using the geocorrected SAR intensity (a). Images (b), (c) and (d) represent Sobel-ENC method application, Sobel only method result, and ENC-based only product, respectively.

Land masking results for ROI-2 (Figure 1) using the geocorrected SAR intensity (a). Images (b) and (c) show Sobel-ENC method application and Sobel only method results, respectively.

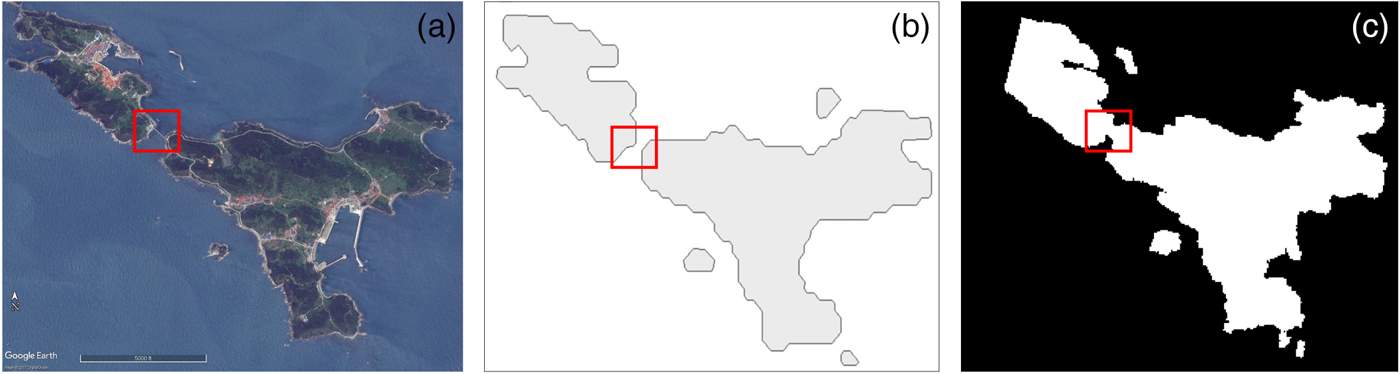
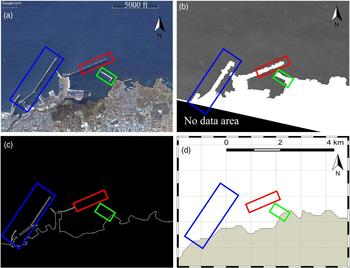
The proposed method of land masking can also mask out newly constructed structures or renovation in existing construction. As an example, a bridge in Chuja Island is properly masked by our method (marked by small rectangle in Figure 11(a)) as well as detected in the ENC-based map (Figure 11(b)), but not detected in freely available GSHHS maps (Figure 11(c)). Similarly, construction of new breakwaters (marked by blue, red and green rectangles) can be observed in the Google Earth image (Figure 12(a)). Similar to the Google Earth image, all of the constructed breakwaters are also detected in our method (Figure 12(b)), though the portions of breakwaters marked by red and green rectangles were not included in the applied version of the ENC map (Figure 12(c)). In contrast, no breakwaters are covered by the GSHHS map (Figure 12(d)).
Validation of the land masking method for ROI-1 (Figure 1). The bridge in the red box of the Google Earth image (a), not covered by the GSHHS map (b), was classified into a man-made structure or land area (c).

Validation of the land masking method for ROI-2 (Figure 1). Some recent changes in coastal constructions (inside colour rectangles), noticed in Google Earth image (a), are visible in the land masked image by proposed Sobel-ENC method (b), but not traced in ENC-based coastline map (c) and GSHHS (d).

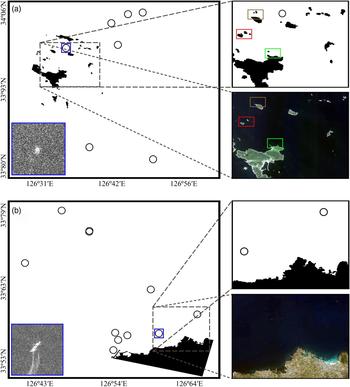
Finally, the masked images of TI-1 and TI-2 were used to detect ships automatically by applying the ship detection algorithm developed by KIOST. The results of ship detection for TI-1 and TI-2 are shown in Figures 13(a) and 13(b), respectively. From each image one smaller area is enlarged and shown at the right of each image. Google Earth images of the same area are also placed at the bottom of the enlarged images. Figure 13(a) contains many small exposed rocks. Therefore, in both of the enlarged and Google Earth images of Figure 13(a), three small areas are bordered by three different colour rectangles to compare whether very small exposed rocks are also masked out through this process. Inside all rectangles of the ship detection result image, very small sea rocks are seen as masked land which are not clearly visible in the Google Earth map (only visible after much zooming). In spite of having small islands and exposed rocks none were detected as ships.
Ship detection results for TI-1 (a) and TI-2 (b) after applying the proposed land masking. The image inset shows a ship in a SAR intensity image (blue boxes in (a) and (b)). From each image one small area is projected (top right) and compared with the Google Earth image (bottom right). There are some discrepancies in the three coloured rectangles between two images that are caused by small rocks and shallow areas.

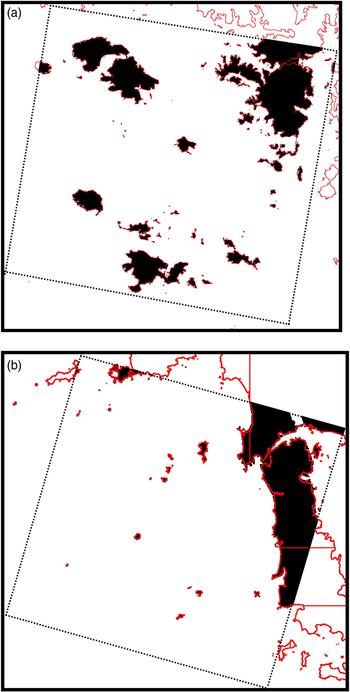
As the proposed method showed better results in ship detection through proper land masking for the TI-1 and TI-2 images, we finally applied the proposed Sobel-ENC method to some other KOMPSAT-5 images. From those land masked images only two images, EI-1 and EI-2, which are geographically complicated (possessing many small islands and exposed rocks) are presented in Figure 14. Here, ENC-based coastlines (red lines) are also superimposed on the land masked image to check whether all of the land areas are correctly masked. It is observed that all of the land, including very small islands and exposed rocks, are also masked. Thus, the proposed method showed the ability to properly detect all land which matched with objects extracted from SAR images.
Land mask images for EI-1 (a), and EI-2 (b) with superimposed ENC-based coastlines (red lines).

4. CONCLUSION
In this study, a new method of land masking for SAR images are proposed. The method is applied on KOMPSAT-5 images of different locations and periods. It is found that all land objects including the small islands and exposed rocks which were connected to land in the ENC can be successfully masked out through the proposed method. Moreover, this method can successfully detect newly developed structures such as bridges and breakwaters, as well as renovation in previously constructed structures better than when using freely available coastline data; thus performing better in ship detection when applying a ship detection algorithm. However, during coastline image preparation, small buffer zones were added to coastlines towards the sea which caused negligible error in land coverage. In general, it can be said that the proposed Sobel-ENC method produces better results in land masking than other methods, and can be applied on KOMPSAT-5 images for ship detection.
ACKNOWLEDGEMENTS
This research work is supported by the projects titled ‘Development of Korea Operational Oceanographic System (KOOS), Phase 2’, ‘Development of Ship-handling and Passenger Evacuation Support System’, and ‘Construction of Ocean Research Stations and their Application Studies’ funded by the Ministry of Oceans and Fisheries, Korea. The Authors greatly acknowledge the data support from Korea Aerospace Research Institute, South Korea.