1. Introduction
Widespread vaccination against the virus that causes COVID-19 disease began in December 2020, and as of the end of March 2021, almost 600 million doses had been distributed.Footnote 1 Concerns have been raised that as vaccinations progress, people will reduce their social distancing, blunting the efficacy of vaccination in reducing the spread of the disease (e.g. Galanti et al., Reference Galanti, Pei, Yamana, Angulo, Charos, Swerdlow and Shaman2021). To the best of our knowledge, this is the first paper attempting to estimate the effects of vaccinating a population on social distancing.Footnote 2
Vaccinations against COVID-19 disease have been shown to substantially reduce the probability that a vaccinated person will exhibit symptomatic infection.Footnote 3 Holding behaviour constant, epidemiological models of disease spread predict that more vaccinations must, then, reduce new infections. However, economic models predict that both vaccinated and unvaccinated people will change their risky behaviours as the proportion of the population which is vaccinated increases (Chen and Toxvaerd, Reference Chen and Toxvaerd2014). Depending on their pattern, these behavioural responses may act to reinforce the protective effects of vaccination, or may reduce the efficacy of vaccination in reducing new infections. Determining their net effect is an empirical problem.
We estimate the effects of an increase in vaccinations per capita on various behavioural measures drawn from Google Mobility reports at the country level, exploiting data on the outcomes of 112 countries across the world. These data are limited in the sense that we only observe country-level averages, so that, among other aggregation issues, we cannot distinguish between changes in average behaviour resulting from changes in the behaviours of vaccinated and unvaccinated people. However, global data are inherently interesting in the sense that we are able to quantify outcomes for the majority of the world’s population, and the staggered rollout of vaccinations across countries allows us to estimate the effects of vaccination by comparing countries which initiated vaccinations sooner and more intensely to those that vaccinated later or less intensely.
The most challenging econometric issue arises because vaccinations were not randomly assigned across countries. To the extent that countries which vaccinated sooner did so because they were experiencing more severe COVID-19 epidemics—or, even more problematically, were expecting more severe epidemics in the future when vaccine contracts were written in the Fall of 2020—statistical models may mistake vaccinations as a cause of behaviour with vaccinations as a consequence of behaviour. That is, we may observe that there are more vaccinations in countries with more severe epidemics because the world successfully triaged vaccinations, not because vaccinations caused disease. Lacking randomisation in vaccinations, we cannot fully resolve this issue. We specify panel data models which mitigate these concerns with various fixed effects and other panel data strategies, consider a variety of specifications of these models to assess robustness, and present estimates of the determinants of the rollout of vaccinations across countries in an effort to assess how the pattern of vaccination rollouts across countries was related to the severity of their epidemics.
We find that countries which vaccinated more of their populations earlier did tend, unconditionally, to be countries experiencing more severe epidemics in late 2020. But, this association essentially disappears once income is held constant: each doubling of GDP per capita was associated with approximately six more vaccinations per capita by the end of our sampling window (19 March 2021), whereas measures of the severity of the epidemic as of or up until the end of November 2020 no longer have any substantial nor statistical ability to predict the vaccination rollout. At least initially, vaccines tended to be rolled out faster in richer, not sicker, countries. It is disturbing that countries in which the most lives could have been saved by vaccination did not, it appears, tend to receive vaccinations first, but these results do lend credibility to estimates of the effects of vaccination on behaviour: factors other than the state of the pandemic primarily drove the initial vaccination patterns.
Our major results include: some measures of social distancing, notably retail visits, fell in quickly-vaccinating countries relative to statistically comparable countries which were not able to vaccinate as quickly, but at the same time, new cases fell in relatively quickly vaccinating countries. We also find evidence that restrictions intended to increase social distancing were relaxed, relatively, in countries in which vaccines were rolled out quickly, suggesting that policy makers view vaccinations and restrictions as substitutes. We conclude by discussing important limitations to these results.
2. Analytical framework
Conventional epidemiological models do not feature endogenous behavioural responses to the risk of infection. Hence, a standard model of the effect of vaccinating some fraction of the population against COVID-19 either would not consider behavioural responses, or would impose behavioural response in an ad hoc fashion.Footnote 4 In contrast, economic epidemiological models focus on how endogenous changes in behaviour alter spread of disease and the impact of interventions designed to limit spread.Footnote 5
A long-standing concern in the economic epidemiology literature revolves around the possibility that vaccinations will cause offsetting behavioural responses which reduce the efficacy of the vaccine in reducing infections or, if behavioural responses are large enough, even perversely cause more infections.Footnote 6 This literature focusses on the case in which an imperfect prophylactic vaccine reduces a vaccinated person’s incentive to reduce costly efforts to avoid infection. People who are not vaccinated, however, may also change their behaviour in response to an increase in the proportion of people around them who are vaccinated.
To fix ideas, consider a very simple, static rational choice model in which a susceptible agent chooses a contact rate c to maximise
 $$ U(c)=B(c)-\gamma Rc-p\left(c,I,V,\overline{V}\right)L\left(\overline{V}\right), $$
where U(c) denotes the utility function, B(c) denotes the benefits the agent obtains from a contact rate of c, R denotes a measure of the stringency of governmental restrictions on social interactions, p(·) denotes the perceived probability of infection which depends on the contact rate, the proportion of the population that is infected, I, the agent’s own vaccination status denoted by an indicator V (which we treat as exogenous) and the proportion vaccinated
 $ \overline{V} $
, and L denotes the loss, in units of utility, of becoming infected. To make the model as simple as possible, assume the functional forms for B(·), L(·) and p(·) that permit us to write,
 $$ U(c)=\mathit{\log}(c)-\left[\gamma R-\left(\beta I-\alpha V-\delta \overline{V}\right)\left({\pi}_0-{\pi}_1\overline{V}\right)\right]c, $$
where all parameters are positive. Here, β is a transmission coefficient which depends on biology and social structure, α represents how the individual perceives that her own vaccination status affects her probability of infection, δ how she perceives population vaccination levels to affect her own probability of becoming infected, and π0 represents the loss due to infection for a narrowly self-interested agent. The loss due to infection decreases at rate π1 as population vaccinations increase, reflecting altruism: particularly since countries tended to prioritise the most vulnerable in distributing vaccines, the agent may perceive that the cost to becoming infected is lower as vaccinations are rolled out because they are less likely to infect and harm or kill other people through their own behaviour.
Assuming the agent ignores any effect her own outcomes have on the population vaccination or infection rates, the model predicts that she will choose contact rate
 $$ {c}^{\ast}\left(I,V,\overline{V}\right)=\frac{1}{\gamma R+\left(\beta I-\alpha V-\delta \overline{V}\right)\left({\pi}_0-{\pi}_1\overline{V}\right)}. $$
Assume that parameters, vaccination rates and infection rates are such that each term in parentheses in the denominator on the right-hand side is positive. Then it is easy to show that the model predicts that, other things being equal, more stringent restrictions, higher disease prevalence, a higher transmission probability, the agent herself not being vaccinated or a higher overall loss to infection (π0) reduce risky behaviour. The effect of the agent’s vaccination status on her probability of becoming infected, though, is ambiguous: if she selects a sufficiently higher contact rate in response to her own vaccination, the total effect will be an increase in her chances of infection.Footnote 7 Vaccinating more of the population around this individual also unambiguously increases her risky behaviour; this effect occurs both because she perceives her own risk to be lower at the margin, and because the costs of becoming infected decrease. Integrating such behavioural responses into models of disease propagation shows that they will generally spur the epidemic relative to models in which behaviour is fixed, although not necessarily in models with heterogeneity or at very high levels of risk (Kremer, Reference Kremer1996).
With these behavioural considerations in mind, we consider an econometric implementation of this simple model in Section 4.
3. Data
3.1. Google Mobility reports
Our main measures of social distancing behaviour are drawn from Google Mobility data. These data and more detail on their construction can be found at: https://www.google.com/covid19/mobility/; https://www.google.com/covid19/mobility/. The version of these data we use for analyses was downloaded 12 April 2021. Using Google Maps searches, these data track visits and lengths of stay to locations categorised as Retail and Recreation, Grocery and Pharmacy, Parks, Transit stations, Workplaces and Residential places.
We consider all five of these categories as measures of social mobility: Retail and Recreation provides a measure of visits to restaurants, cafes, shopping centers, theme parks, museums, libraries and movie theaters. Workplaces data provide information on visits to places of work. Transit stations measures use of public transport hubs such as subway, bus and train stations. Parks tracks visits to ‘places like local parks, national parks, public beaches, marinas, dog parks, plazas and public gardens’. Finally, Residential data provide information on visits to places of residence; we sometimes refer to this outcome as ‘time at home’. We interpret increases in all of these except residential visits as decreases in social distancing, and increases in residential visits as an increase in social distancing.
According to Google, the location accuracy in these data varies by country, but the country fixed effects we include in all models should mitigate this concern. Google reports these data as changes relative to the 5-week period from 3 January to 6 February 2020. We reconstruct the absolute variables up to a constant by calculating one plus the log of the value reported by Google.
3.2. Vaccinations and measures of epidemic progress
To the best of our knowledge, the only comprehensive international data on vaccinations have been compiled by the Our World in Data team.Footnote 8 We use the smoothed data on new vaccinations; the version of these data we use in the analyses was downloaded on 11 April 2021. These data were constructed from a wide variety of official sources, most commonly the Ministry of Health or similar government entity. They do not include vaccinations given during clinical trials. Note that we select number of vaccinations given as our the covariate of interest in all analyses rather than the proportion vaccinated or fully vaccinated: we measure the effect of an additional vaccination, regardless of whether the arm into which it is injected has already received at least one vaccination. We choose this outcome because the data on the number of people vaccinated contain more missing observations.
We also use daily new COVID-19 cases and deaths per capita attributed to COVID-19 as compiled from official sources and reported and smoothed by Our World in Data.
3.3. Other data
The Oxford COVID-19 Government Response Tracker (OxCGRT) policy stringency index is used as a composite measure of policy responses intended to reduce COVID-19 infections. This index can in principle vary between zero and one, and is constructed as a simple average of dummy variables indicating a variety of restrictions imposed with the intention of increasing social distancing, such as school closures and restrictions on gatherings. See Hale et al. (Reference Hale, Angrist and Goldszmidt2021) for further information on the construction of this index.
We obtain information on temperature and humidity from the Air Quality Open Data Platform Worldwide COVID-19 dataset, and take the arithmetic average of readings from multiple stations within a country on a given day.Footnote 9 The version of these data we use in the analysis was downloaded 11 April 2021. These data do not provide comprehensive global coverage. As we demonstrate below, including weather in our models has essentially no effect on the estimates, so we do not include weather in most of our analysis so as to retain as large a sample as possible.
Data on GDP per capita were drawn from the Our World in Data dataset.
3.4. Sample selection
We face a tradeoff in determining the date on which to begin the estimation sample. The vaccination rollout begins in December 2020. Using data from before the rollout provides more information to estimate the parameters other than vaccination effects, and provides a ‘pre-treatment’ period which in effect generates more control groups, but as we shift the first date in our analyses backwards in time we also implicitly impose more assumptions on the temporal stability of the parameters we estimate, and we place more weight on pre-treatment outcomes as controls. We choose 1 December 2020 to begin the estimation sample; the estimates are not sensitive to small changes in this date. The last date we use in the estimation was 19 March 2021, as, due to reporting delays, missing data starts to become a substantial concern after this date. We, then, have 109 days in our estimation sample.
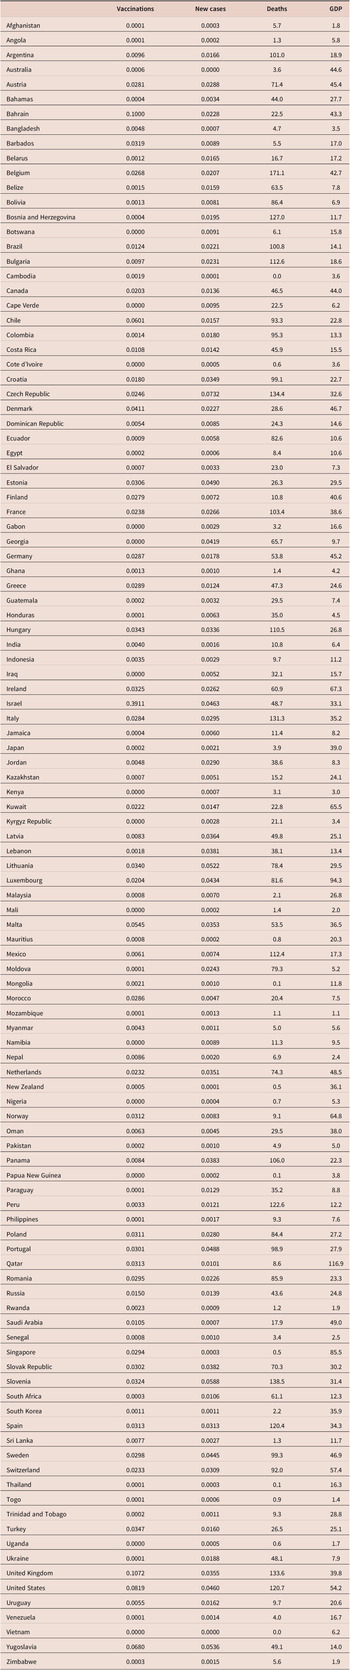
We do not include countries which have no data on vaccinations. These may be countries for which vaccination has occurred but the data are not yet reported, or they may be countries which have not begun vaccinations. In either case, they provide a dubious control group for vaccinating countries. We also exclude countries with no Google Mobility data. After these exclusions, we are left with an estimation sample of 112 countries in the main analyses. We list these countries along with means of selected outcomes in Appendix Table A3. Notably, we cannot use China or India in our analyses due to missing data, so a substantial fraction of the world’s population is missing.
Three countries (Angola, Honduras and Uganda) have a total of four missing observations on the Google Mobility data during the sampling window, and there are a total of 19 observations with zero reported daily new cases. Since we model the logarithm of new cases, we drop these observations. The number of observations included in the models then varies slightly (between 12,185 and 12,204) depending on whether lagged variables are included and on whether the dependent variable is new cases or one of the Google Mobility outcomes.
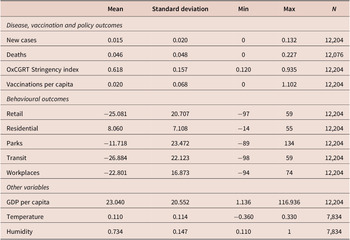
Appendix Table A1 presents descriptive statistics for the key outcomes in our analyses.
4. Econometric methods
4.1. Main models
Consider estimating the simple model of behaviour above, equation (3), which says that a person’s behaviour is a function of their own vaccination status, population vaccinations and disease prevalence. Aggregating across people, the model implies that changes in vaccination rates across populations will affect average behaviour for several reasons: people may change their behaviour when they are vaccinated, they may respond to population vaccination rates given their own status for altruistic reasons, and vaccination affects epidemic dynamics which in turn affect behaviour. We take this model to the data by deploying standard panel econometric models for various behavioural outcomes. Our least restrictive specification takes the form,
 $$ {y}_{it}={\beta}_0+{\beta}_1{V}_{i,t-14}+{\beta}_2{y}_{i,t-14}+{\mathbf{X}}_{it}\gamma +{\alpha}_i+{\varphi}_t+{\lambda}_it+{u}_{it}, $$
where i indexes countries and t indexes time in days: yit denotes a behavioural outcome or new cases of disease, Vit denotes vaccinations per capita, X it is a vector of controls, including policy stringency and in some models weather conditions, αi are country effects, φt are day effects, λit are country-specific linear trends and uit is a disturbance term.
The effects of vaccinations on various behaviours, the parameters β 1, are identified in this model by variation in the timing of the rollout of vaccinations across countries. The country fixed effects remove all variation in both behaviours and vaccination patterns that can be attributed to time-invariant or predetermined outcomes, such as the severity of the epidemic up to the beginning of the vaccine rollout and socioeconomic development. The inclusion of a complete set of day effects sweeps out common time trends without imposing any functional form assumptions, and subsume seasonal effects, day of the week effects and holiday effects. Controlling for weather, as measured by temperature and humidity, removes the concern that we may mistake changes in behaviour and vaccinations that both result from, for example, a particularly inclement day with an effect of vaccinations on behaviour.Footnote 10 Including a lagged value of the dependent variable flexibly controls for nonlinear trends in the dependent variable and, in models in which disease incidence is the outcome, helps reduce bias resulting from countries increasing vaccinations in response to worsening COVID-19 conditions.
The effects of policies designed to reduce social interaction on disease spread are the subject of considerable research.Footnote 11 Controlling for policy stringency implies that we estimate the effects of vaccinations which do not result from changes in policies which themselves are caused by, or correlated with, the vaccination rollout. We assess possible problems with estimating and intepreting the causal effect of vaccinations if policy stringency is also affected by vaccinations below. As the focus of this paper is not to measure the effects of policy on behaviour, we do not attempt to estimate the distinct effects of each of the policy responses from which this index was constructed, but since these estimates may themselves be of interest, we report them along with the estimated effects of vaccinations.
Finally, the country-specific linear trends relax the conditionally parallel trends assumption on which identification would otherwise rest. Much like previous research in other contexts (e.g. Lee and Solon, Reference Lee and Solon2011; Rambachan and Roth, Reference Rambachan and Roth2019), we find that the estimates are sensitive to this assumption; standard two-way fixed models in some cases lead to different qualitative conclusions than models with country-specific trends. Since identification in the models without trends is based on the more restrictive and more implausible assumption that behavioural outcomes across the world would have trended identically if not for the vaccination rollout, we prefer the model with trends.
In models with a lag of the dependent variable, we ignore the endogeneity of this variable due to our relative large-T sample of 109 days. In some models, we also lag the covariate of most interest, vaccinations, and the policy stringency index, by 14 days. We do so to modestly mitigate concerns of simultaneity bias, allow time for vaccinations to be effective, and to allow time for both policies and vaccinations to affect behavioural outcomes, particularly reported new cases.Footnote 12
We estimate standard errors and other measures of sampling variability using the method of Driscoll and Kraay (Reference Driscoll and Kraay1998), with up to 7 days serial dependence (the estimates are not sensitive to this choice of lag). Inference is then robust to general forms of heteroskedasticity, serial correlation, and cross-sectional dependence, mitigating concerns that spatial or temporal dependence bias our standard errors.
In a variety of robustness checks, we assess the sensitivity of these results to various assumptions. Note, however, that our two-way fixed models with many time periods and staggered interventions are subject, even with arbitrary country trends, to the criticism levelled by Goodman-Bacon (Reference Goodman-Bacon2018), Callaway and Sant’Anna (Reference Callaway and Sant’Annaforthcoming), and other recent papers that such models implicitly use inappropriate control groups and recover at best variance-weighted averages of heterogeneous treatment effects. However, to the best our knowledge, methods to circumvent these issues when the treatment is continuous have not yet been developed. Restricting our sample to countries which have started vaccinations by the end of our sampling period may reduce this bias.
4.2. Determinants of vaccinations and simultaneity bias
Note that we do not control for time-varying measures of epidemic severity due to the potential of simultaneity bias. The estimates of the effects of vaccines should then be considered reduced forms that reflect both the direct effects of vaccination and indirect effects occurring due to changes in disease spread. The same concern applies to vaccination rates, and our estimates of the effects of vaccination rates are biased to the extent that governments procured more vaccinations during the initial rollout if they anticipated a worsening of the epidemic at the same time. Such a mechanism implies that vaccinations are endogenous in model (4) due to simultaneity, that is, that vaccinations may ‘reverse cause’ behaviour and disease incidence. However, as discussed in Section 5.1, the pattern of the initial rollout was largely determined by contracts written months earlier, suggesting that this may not be a major concern.
To provide suggestive evidence on the extent to which the pattern of rollouts reflected disease severity, we present estimates of models investigating the determinants of the rollout of vaccinations across countries. We construct a cross-sectional dataset of country characteristics and two measures of epidemic severity as of early December 2020, immediately preceding the initiation of vaccinations: the total of number of COVID-19 deaths (per capita) up to that time, and the mean number of new cases per day (per capita) during November 2020. We use total COVID-19 deaths per capita up until 1 December 2020 as a measure of the cumulative effects of the epidemic on the country up to that date, and the number of new cases per day as a measure of the severity of the epidemic immediately prior to the initial rollout of vaccines in the following month. Standard errors in these cross-sectional models are robust only to heteroskedasticity.
5. Results
5.1. The rollout of vaccinations across nations
Why did some nations rollout vaccinations faster than others? The panel data models we present below hinge on the assumption that the variation remaining in the speed of the vaccination rollout, after sweeping out fixed effects and covariates, is exogenous. That is, some nations distributed more vaccinations than others for reasons unrelated to those affecting how risky behaviours would have evolved in the absence of a vaccine rollout. In this section, we present some suggestive evidence that at least the initial rollout of vaccines was largely unrelated to the severity of the epidemic in each country, which in turn suggests that the regression-adjusted correlations we present between vaccinations and the outcomes we consider largely reflect the consequences of vaccinations, not the causes of vaccinations.
The institutional background is consistent with the proposition that the world largely failed to triage vaccinations. Vaccinations began to be distributed in December 2020 based on contracts between manufacturers and governments signed months earlier, which implies that subsequent changes in the severity of a country’s epidemic likely had little or no effect on the magnitude of its rollout. Media reports suggest the rollout was largely determined by income, by political savvy and idiosyncratic pharmaceutical approval processes, and by the happenstance of the locations of manufacturers. For example, the New York Times reported on 15 December, the week of the initial rollout, that ‘rich countries have “cleared the shelves” of vaccines’ (Twohey et al., Reference Twohey, Collins and Thomas2020). After noting that India had secured a relatively large number of doses from Novavax, the Times article quotes the CEO of that company explaining why that occurred: ‘India gets priority because it’s my home country’.
The lag between government contracts for vaccine purchases and delivery also suggests that the global pattern of the vaccine rollout could not have been largely determined by variation in epidemic severity in late 2020 and early 2021. Even by the end of August 2020, government contracts for more than one billion doses had been signed, and by December 2020 developed countries had preordered about 10 billion doses more.Footnote 13 Governments and charitable organisations have, however, also contracted with manufacturers in an effort to provide more timely access to vaccinations, notably through COVID-19 Vaccines Global Access (COVAX). But, this initiative had not, by the end of our estimation window (19 March 2021), provided a substantial number of doses, and aims to reach only about 3.3 per cent of the total population of each participating country by the end of the first half of 2021 (Gavi: The Vaccine Alliance, 2021).
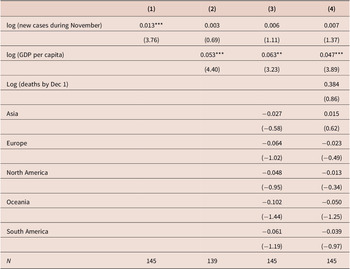
Consider first the correlates of the timing and intensity of the rollout of vaccinations across nations. In Table 1, we present estimates of a variety of models of total vaccinations by 19 March 2021.
Correlates of vaccinations across countries

Note: Ordinary least square (OLS) estimates using country-level cross-section. The dependent variable is vaccinations per capita as of 19 March 2021. The omitted continent is Africa. New cases in are expressed as a mean per 100 capita per day and deaths as total deaths to date per million capita. Parentheses report t-statistics based on robust standard errors. Asterisks denote statistical significance at the 0.05, 0.01 and 0.001 levels.
Column (1) of Table 1 presents estimates of the simplest specification including only our measure of epidemic severity immediately prior to the beginning of the vaccine rollout, mean cases per day during November 2020. The statistically significant estimate (t = 3.8) suggests that, unconditionally, countries with more severe epidemic tended to distribute more vaccinations during the initial rollout, although the effect is quite small: each doubling of new cases in November is associated with about
 $ (0.013)(0.69)\approx 0.01 $
more vaccinations per capita, that is, 1 more vaccination per 100 people.
Column (2) of Table 1 adds income as a control. The unconditional association between vaccinations and epidemic severity essentially disappears after controlling for income, as the estimated coefficient falls to only 0.003 with an associated t-statistic of 0.7. But income strongly predicts vaccinations: the point estimate suggests each doubling of GDP per capita is associated with about
 $ (0.05)\left(\mathit{\log}2\right)\approx 0.04 $
, or 4 more vaccinations per 100 people. Put another way, the results suggest that if country A’s epidemic was worse than country B’s immediately prior to the rollout, country A did tend to vaccinate faster than B, but if country A and B have the same average income and country A’s epidemic was worse than B’s, they vaccinated at similar rates. It is income, not disease severity, which drove the initial rollout pattern, according to these estimates.
Column (3) adds continent effects to the model, thereby comparing countries only to their continental neighbours. Using only within-continent variation has little effect on the results. The point estimate on income increases in magnitude modestly to 0.06 and remains highly statistically significant, whereas the estimated coefficient on new cases in November remains small and statistically insignificant. We report the estimated continent effects since they may be of interest: there is little evidence that, conditional on income and epidemic severity, countries on different continents vaccinated at substantially different rates.
Finally, in column (4) we add an additional measure of COVID-19’s damage: total deaths attributed to COVID-19 as of 1 December 2020. The point estimate is a little less than 0.4, suggesting a moderately strong relationship between deaths and vaccinations, but it is very statistically insignificant (t = 0.86, p = 0.39). Hence, neither deaths to date, nor the contemporaneous severity of the epidemic as measured by new cases, predict the rollout of vaccinations.
Taken together, these results suggest that the rollout of vaccinations across nations favoured the richest countries, not the countries experiencing the most severe epidemics given their incomes. However, the lack of association between the state of the epidemic and the rollout of vaccines does lend some suggestive credibility to the estimates to follow of the effects of vaccinations on behaviour, as they do not suggest that the pattern of vaccinations is consistent with vaccinations being triaged to the hardest-hit populations.
5.2. Effects of vaccinations on behaviours and disease incidence
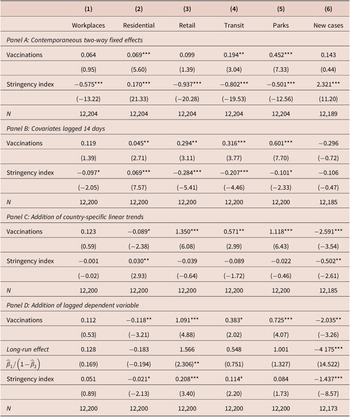
We vary the specification of the model across the panels of Table 2 to assess sensitivity. In all models, the outcomes are in logs, vaccinations are per capita, and the policy stringency index is bound on the unit interval. An estimated coefficient on vaccinations, then, can be interpreted as the predicted effect of increasing vaccinations from zero to a number equal to the entire population (which, since we measure vaccinations rather than people vaccinated, does not mean the entire population is vaccinated), whereas the coefficient on policy stringency can be interpreted as the predicted effect of a country ‘switching on’ all policies tracked by OxCGRT.
Estimates of panel data models of behaviours and new cases

Note: All outcomes are in logs. Vaccinations are per capita and the policy stringency index is bound on the unit interval. Each panel reports a separate specification. The panel consists of 112 countries and 109 days, with some missingness. Complete sets of day and country effects are included in all models; panel titles note additional structure. Parentheses report t-statistics based on Driscoll–Kraay standard errors robust to arbitrary serial and spatial correlation. Asterisks denote statistical significance at the 0.05, 0.01 and 0.001 levels.
First consider Panel A, which presents two-way fixed effects estimates of day t vaccinations and policy stringency on day t outcomes. The estimates suggest policy stringency is highly contemporaneously correlated with more social distancing: that is, fewer visits to workplaces, retail, transit and parks, but more residential visits. These estimates are all substantively large and highly statistically significant. However, policy stringency is strongly contemporaneously associated with more new cases, which likely reflects causation from new cases to policy stringency rather than a perverse effect of policy. Vaccinations in this model are statistically significantly associated with more transit and parks visits, but also more residential visits, and not associated statistically nor substantially with new cases. These estimates, however, assume that effects of policy occur instantly, which is particularly implausible for new cases, which take time to incubate and detect. Further, these estimates are identified off the assumption that all countries’ outcomes would trend in parallel if it were not for changes in the covariates.
We begin to relax these assumptions in the estimates presented in Panel B of Table 2, which also deploys two-way fixed effects, but lags both vaccinations and policy stringency by 2 weeks. The estimates are sensitive to this change: the estimated effects of policy stringency on the Google Mobility behaviours both increase and decrease across outcomes, and particularly of note, the positive association between new cases and policy stringency disappears: the point estimate flips sign and is not statistically significant. We interpret this result as confirmation that the apparently perverse effect reported in Panel A does reflect the endogeneity of policy to disease spread. The effects of vaccinations in this model are similar to those in Panel A.
We then relax the parallel trends assumption in Panel C by including country-specific secular trends, such that identification is achieved by estimating deviations around these trends as the vaccination rollout occurred. The inclusion of these trends has substantial effects on the estimates. Policy stringency statistically significantly increases residential visits, although the effect is rather small in magnitude: a 0.1 increase in policy stringency increases residential visits by 0.3 per cent (t = 2.9). The point estimates on the other Google Mobility outcomes also suggest stringency increases social distancing, although they are not statistically significant. The estimated effect of stringency on new cases suggests policies are effective at reducing disease spread: a 0.1 increase in the stringency index causes about 5 per cent lower incidence (t = 2.6).
The estimates of vaccinations in Panel C also differ markedly from the more restrictive estimates in Panels A and B. These estimates strongly suggest people responded to the rollout of vaccinations by reducing social distancing: distributing vaccinations equal to 10 per cent of a country’s population leads to: a 0.9 per cent decrease in residential visits (t = 2.4), a 13.5 per cent increase in retail visits (t = 6.1), a 5.7 per cent increase in transit visits (t = 3.0) and a 11.2 per cent increase in visits to parks (t = 6.4). Finally, more vaccinations lead to diminished disease spread: distributing vaccinations equal to 10 per cent of a country’s population reduces new cases by a very large 26 per cent (t = 3.5), according to this model.
Panel D presents the results of the least restrictive of our specifications, which includes both country-specific trends and a 2-week lag of the dependent variable. Here, interpretation of the estimates becomes more difficult as the point estimates reflect short-run effects, whereas long-run effects can be calculated by plugging the estimating coefficients into
 $ \frac{\beta_1}{1-{\beta}_2} $
, in the notation of equation (4), that is, the estimated effect over one minus the estimated coefficient on the lag of the dependent variable. These long-run effects, with inference based on the Delta method, are also displayed in the table, but as we do not think that the epidemic can reasonably be modelled as fluctuating around a long-run steady state equilibrium, we interpret them with skepticism. Qualitatively, the results in Panel D for both vaccinations and policy stringency are very similar to those in Panel C.
5.3. Parameter stability over time
The concern that our estimates are biased by vaccinations being routed to countries in which they are most needed may become more compelling as time passes. Vaccinations rerouted to areas with epidemic flare-ups bias our estimates: this mechanism will make it appear that vaccinations cause new cases (or are less effective than they are at reducing new cases) and, given that people respond to outbreaks by increasing social distancing, make it appear that vaccinations increase social distancing (or reduce social distancing less than they actually are). Further, the linear trends assumption which helps identify our models becomes more tenuous as the sampling window increases.
To investigate the stability of our estimates over time, we estimated rolling regressions. Always starting 1 December 2020, we estimate the model in Table 2 Panel C (with day and country effects and country-specific trends), ending the sample on 1st February, then, separately, on 2nd February, and so on, until 19th March. We note that changes in the estimates as we increase the sample size do not necessarily indicate that the causal effect of vaccinations is itself changing over time, as we would expect estimates to change with sample size due to sampling variability.Footnote 14 But if we interpret estimates only using earlier data as less biased than those also using later data, then we wish to assess whether we would draw qualitatively different conclusions depending on when we end the sampling window.
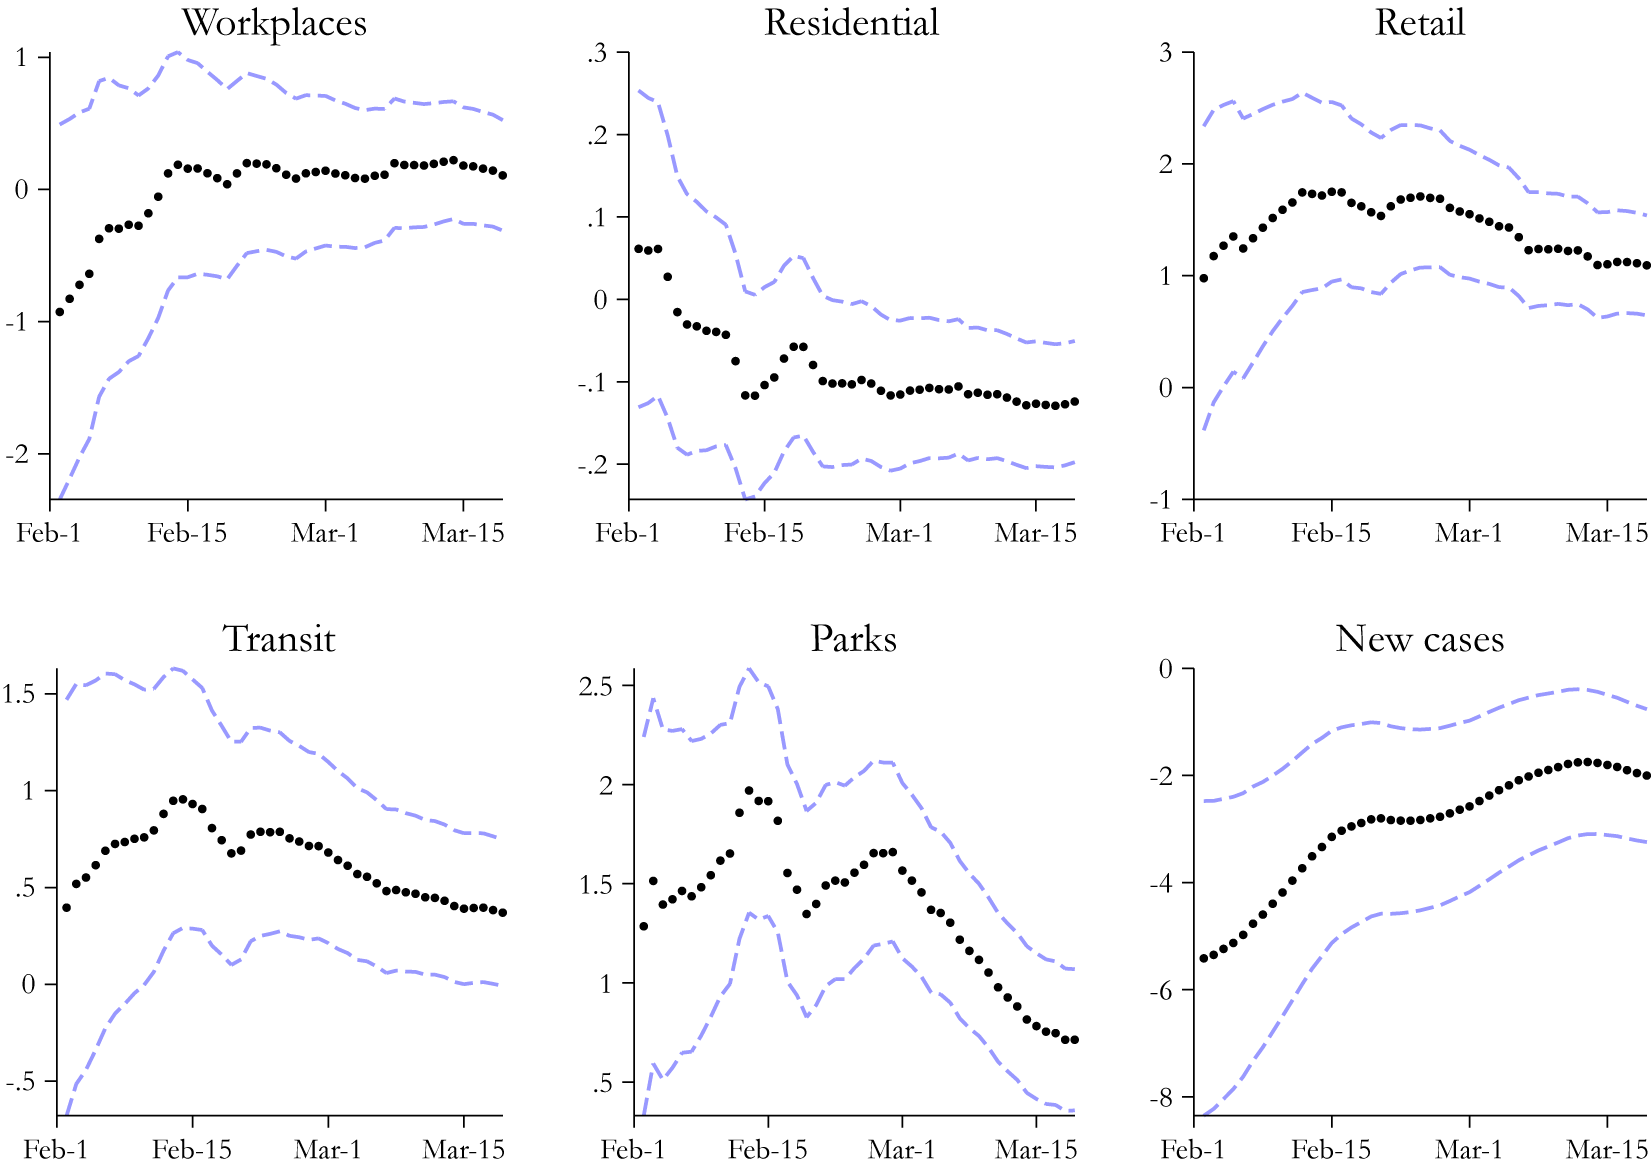
The rolling regression results are displayed in Figure 1. Many of the results change little as we increase the sampling window: the estimated effect on workplace visits diminishes in magnitude but is never statistically significant, whereas the effects on retail and transit visits change little. However, the effect of vaccinations on residential visits is initially very small and positive, but switches sign and increases in magnitude as the sampling window increases, only obtaining statistical significance when we use almost the entire sample. For all outcomes except new cases, the qualitative results are largely unaltered by varying the sampling window.
(Colour online) Rolling regression estimates. Figure shows each model estimated in Table 3, Panel C (models include country-specific time trends along with complete sets of day and country effects) estimated from the beginning of the sampling window (1 December 2020) to the date shown on the x-axis. Note the scale of the y-axis varies across subfigures. The dashed blue lines are 95 per cent confidence intervals

The effect of vaccinations on new cases is sensitive to when we end the sampling window. Vaccinations appear to have a very large effect on new cases during the early rollout, but this effect diminishes markedly in magnitude over time. A researcher using data from 1st December to 1st February would conclude that a 10 percentage point increase in vaccinations per capita decreases new cases by 60 per cent (t = 4.4). Conversely, a researcher using data from 1st December to 19th March would draw the conclusion we present in Table 2 Panel C: this effect falls in magnitude to −26 per cent (t = 3.5). Figure 1 demonstrates that this decline in magnitude is monotonic as the sampling window is increased. This result is consistent with increasing simultaneity bias resulting from increasingly successful vaccine triage, or with a declining causal effect of vaccinations. A declining effect may in turn result from successful within-country allocation of vaccines to people more likely to become infected, such that as an increasing proportion of the population is vaccinated, the marginal vaccinated person’s reduction in infection probability decreases.
5.4. Heterogeneous effects
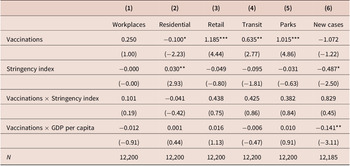
In Table 3, we investigate whether the effects of vaccinations differed with observed country characteristics, simply by interacting vaccinations with our measures of policy stringency and GDP per capita. For ease of interpretation, the continuous covariates are first demeaned, such that the coefficients on the main effects should be interpreted as the effect at the global mean of each continuous covariate, and the coefficients on interactions should be interpreted as how this effect itself varies with the interacted regressor.
Heterogeneity across policy stringency and income

Note: Ordinary lease square (OLS) estimates of models of Google Mobility behavioural outcomes and new COVID-19 cases. All outcomes are in logs and covariates are lagged 14 days. Complete sets of day and country effects and country-specific linear time trends are included in all models. Parentheses report t-statistics based on Driscoll-Kraay standard errors robust to arbitrary serial and spatial correlation. Asterisks denote statistical significance at the 0.05, 0.01 and 0.001 levels.
Evaluated at sample means, the estimates in Table 3 display a similar pattern as the main estimates discussed above: vaccinations decrease both social distancing and new cases, although the effect on new cases is not statistically significant. There is little evidence that vaccinations are more or less effective in changing behaviour or new cases in countries with more stringent policies, as none of the interactions between policy and vaccinations are statistically significant. Similarly, only one of the interactions between vaccination and income are statistically significant: column (6) in Table 3 suggests that vaccinations are more effective in reducing new cases in richer counties. An increase in GDP per capita of $1,000 USD decreases the estimated effect of vaccination by 0.14 units (t = 3.1), relative to the estimated effect at the mean of −1.06 units. That is, in wealthy countries, a given increase in vaccinations per capita decreased new infections more than in poorer countries.
5.5. Robustness
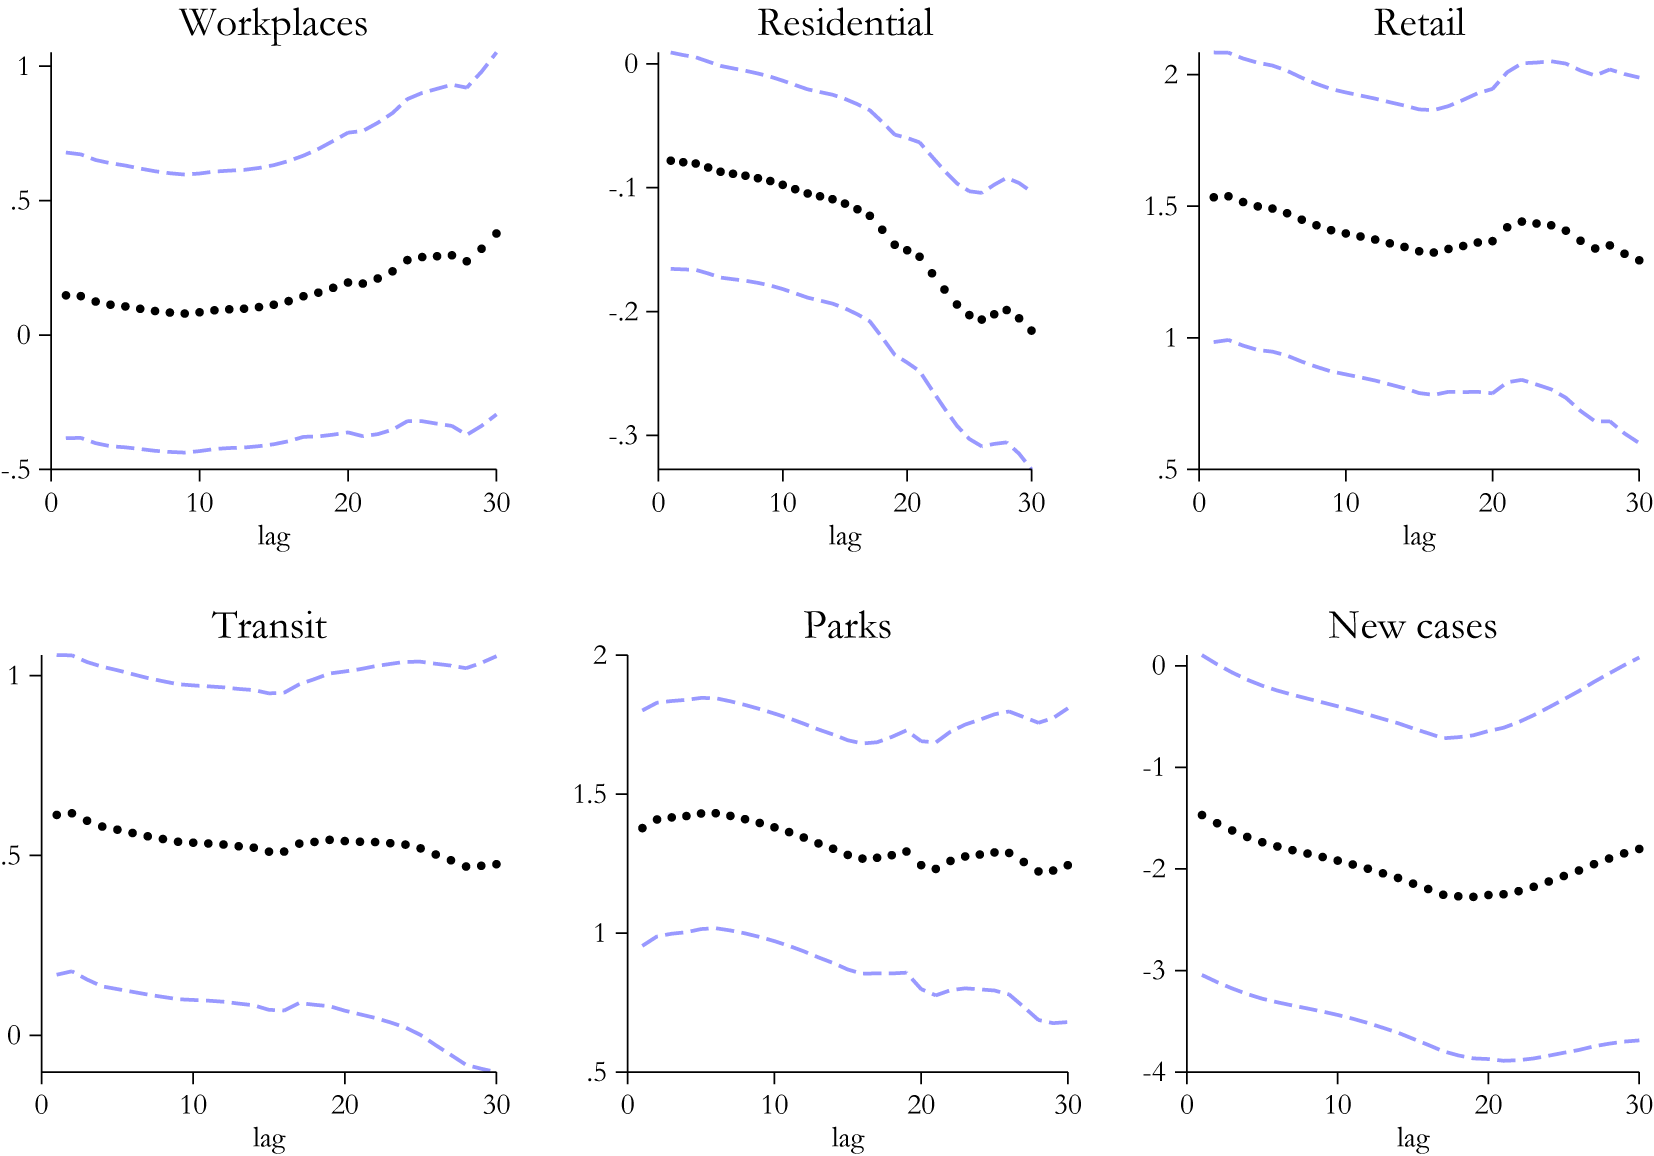
We further investigate the robustness of these results by varying the lag length on vaccinations. Instead of somewhat arbitrarily choosing 2 weeks, we vary the lag length from one to 30 days, and estimate the dynamic model with country-specific trends for each outcome at each lag length. The resulting 180 regression coefficients are presented in graphical form in Appendix Figure A1. The results of this exercise indicate that the major results discussed above are reasonably robust to lag length. The estimates of the effect of vaccination on workplace visits never obtain statistical significance, and we would draw the same qualitative conclusions over the effects of vaccinations on the remaining outcomes of interest regardless of lag length. That said, the magnitude of the effect of vaccination on residential visits increases as we consider longer lags, whereas the magnitude of the effect on new cases is largest for lags of between about 10 and 20 days.
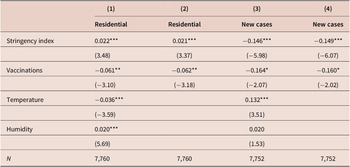
As another robustness check, we consider whether controlling for weather conditions would affect our results. Weather may affect both disease transmission directly, may affect vaccinations, and may affect social distancing, so omitting weather may lead to a spurious relationship between behaviour and vaccinations. We do not include weather as a covariate in all models because of missing data. In Appendix Table A2, we estimate the specification with country-specific trends and a lag of the dependent variable on the subset of 79 countries for which we have weather (as measured by temperature and humidity) data. We restrict attention to residential visits and new cases as key behavioural outcomes. In columns (1) and (3), we estimate models including weather controls, and in columns (2) and (4), we present versions of the models presented in Table 2 but restricted to the sample for which we have weather data. The results clearly show that the weather outcomes statistically significantly predict both behaviour and new cases, but controlling for weather has essentially no effect on the estimated coefficients on vaccinations, which change only in the third decimal place.
5.6. Effect of vaccinations on policy stringency
Do policy-makers relax restrictions as more vaccinations occur? We estimate equation (4) with policy stringency as the outcome of interest to investigate this question. As with the models of behavioural outcomes, we include complete sets of country and day effects, and we include country-specific time trends. We consider two specifications, one including a 2-week lag of the dependent variable, and one without this lag.
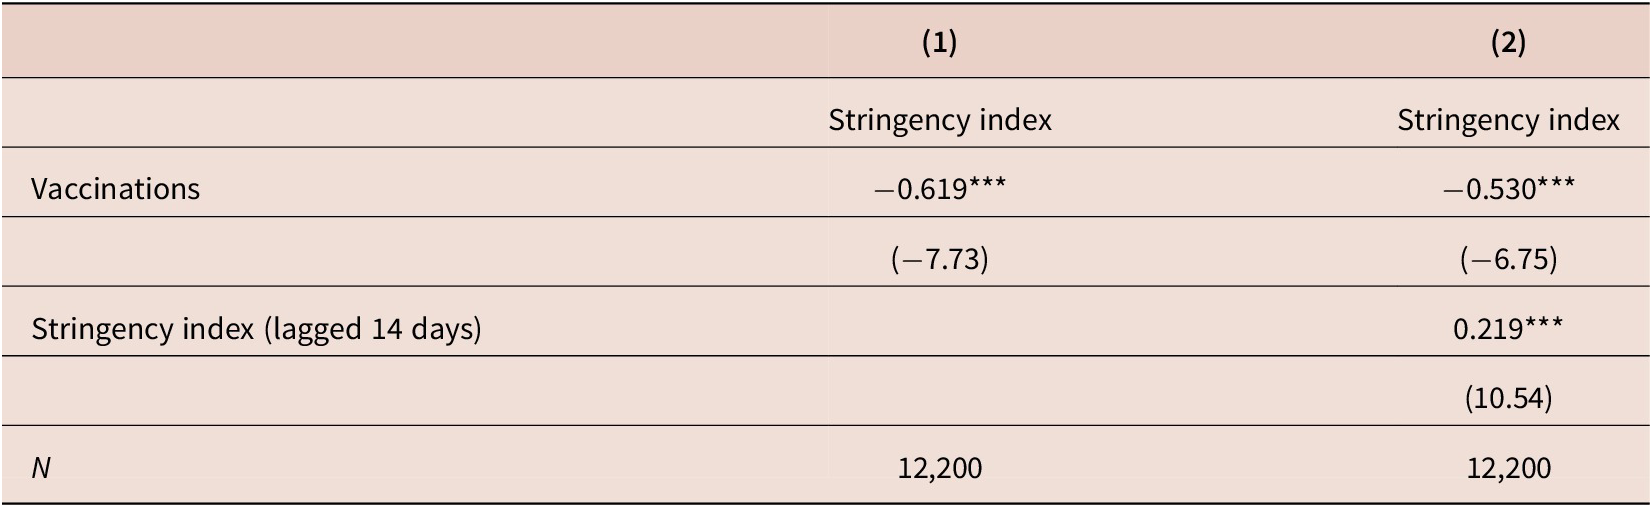
Table 4 presents the results. The estimate in column (1) suggests that there is a large and highly statistically significant effect of vaccinations on policy stringency. The point estimate means that distributing a number of vaccines equal to 10 per cent of a country’s population decreases policy stringency by about 0.06 units (t = 7.7). Put another way, the descriptive statistics displayed in Appendix Table A2 show that the average stringency observed globally over our sampling window was about 0.62 and ranged between 0.12 and 0.94. The estimate in column (1) of Table 4 suggests that, if the most severely restrictive country distributed a number of vaccinations equal to its population, then its policy makers could be expected to decrease stringency to 0.34 (0.94–0.6), decreasing its stringency from the most severe to one of the least severe. Column (2) of Table 4 adds lagged stringency as a control, but the results are very similar.
Effect of vaccinations on policy stringency

Note: The dependent variable is the policy stringency index, on the unit scale. Complete sets of day and country effects are included in all models, along with country-specific linear trends. Parentheses report t-statistics based on Driscoll–Kraay standard errors robust to arbitrary serial and spatial correlation. Asterisks denote statistical significance at the 0.05, 0.01 and 0.001 levels.
These effects are both substantively and statistically significant and comprise suggestive evidence that the rollout of vaccinations would have had larger effects on disease transmission if policy stringency had not (relatively) declined in quickly vaccinating countries. That policy stringency responds to the timing of the vaccination rollout also presents a potential problem for our main estimates presented in Table 4: if policy stringency is on the causal path from vaccinations to behavioural outcomes and disease incidence, ‘collider bias’ may afflict our estimates of the effects of vaccination (see e.g. Pearl, Reference Pearl2013). We assessed the sensitivity of the estimates presented in Table 2 to this mechanism by re-estimating each model without including policy stringency as a covariate. The estimates on the effects of vaccination change little, suggesting that this form of bias is not a serious concern.
6. Conclusions
We conclude by summarising the main results and discussing their limitations. The evidence suggests that the rollout of vaccinations across nations resulted in:
-
1. A decrease in average social distancing, particularly so for visits to retail establishments.
-
2. Decreased new COVID-19 cases, perhaps particularly so during the earliest stages of the rollout and in relatively high-income countries.
-
3. Relaxation of government social distancing restrictions.
However, these results are subject to a number of important limitations.
First, while we present suggestive evidence that the rollout cannot be predicted by COVID-19 vaccinations in the month preceding the beginning of the rollout once income is held constant, and we deploy a battery of fixed effects and other panel data approaches to minimise concerns over endogeneity and uncontrolled common causes of disease spread and vaccination response, our estimates are nonetheless biased to the extent that the vaccination rollout responded to rapidly changing epidemic conditions across countries. In particular, to the extent that vaccinations are a response to changes in disease rather than a cause, our estimates will be biased in the direction of finding that population vaccination is less effective than it actually is in reducing disease spread. We find that the apparent effect of vaccinations falls as we increase the end of the sampling window from the beginning of February to late March, which, among other possible explanations, is consistent with increasing bias from increasingly successful vaccine triage across nations.
Second, we are only able to observe country-level averages, which presents a number of challenges. We cannot distinguish between the behavioural effects of vaccination on the vaccinated, and effects of population vaccination on a given person conditional on that person’s vaccination status. So, for example, we have no way of disentangling a decrease in social distancing in response to more rapid vaccine distribution resulting from altruistic or narrowly self-interested motives. Moreover, since we observe only average behaviour, we cannot estimate any effects on the distribution of behaviour within countries, such as an increase in the dispersion of social distancing.
Third, we found that our estimates are sensitive to the specification of our models. Models with only contemporaneous outcomes lead to quite different conclusions than those relating current behaviour or disease incidence to policies and vaccination prior to 2 weeks. Models with only country-specific linear trends sometimes lead to different conclusions than models without these trends. We focus attention on models preferred for theoretical reasons, that is, models with lags of the covariates and which relax the parallel trends assumption, but highlight that these choices matter.
Finally, in this paper, we have sought to increase understanding of the interaction between vaccinations, policy and behaviour. We have not studied the reasons why governments have rolled out vaccines at the pace that they have. This pace will in practice be constrained by vaccine availability and by a country’s ability to deliver vaccines, which in turn depends on factors such as health care systems, demographics and geography (McKee and Rajan, McKee and Rajan, Reference McKee and Rajan2021). Data on vaccine stockpiles are difficult to come by, as governments are reluctant to share this information publicly. In turn, vaccine delivery capacity is difficult to measure. We therefore leave these issues for further research.
We conclude that overall there is some evidence in the country-level data that countries which successfully vaccinated more quickly experienced both less social distancing and diminished spread of disease as a result of these vaccinations. We suggest future research using microdata, when they become available, which may be able to shed more light on these questions.
Acknowledgements
We thank participants at the ‘What can “economics” and “epidemiology” learn from each other?’ workshop held by the National Institute of Economic and Social Research 12 February 2021, for many helpful comments.
Descriptive statistics

Note: Behavioural outcomes from Google Mobility represent percentage changes relative to a baseline period in February 2020. GDP per capita is in thousands of 2019 U.S. dollars.
Assessing effect of controlling for weather

Note: Estimates of residential visits and new cases, where both outcomes are in logs. In all models, the sample is restricted to observations with weather data available. Country-specific linear trends and complete sets of day and country effects are included in all models. Parentheses report t-statistics based on Driscoll–Kraay standard errors with up to 1 week arbitrary serial correlation. Asterisks denote statistical significance at the 0.05, 0.01 and 0.001 levels.
Countries in estimation sample with selected summary statistics

Note: Table lists each country in the estimation sample along with vaccinations and mean new cases and total vaccinations per hundred capita per day, and total deaths to date per million capita. GDP is expressed in thousands of 2019 U.S. dollars.
(Colour online) Sensitivity of estimates to lag length. Figure shows each model estimated in Table 2. Panel C, varying the lag of vaccinations per capita between 1 and 30. Note the scale of the y-axis varies across subfigures. The dashed blue lines are 95 per cent confidence intervals