


Introduction
It is now generally accepted that, due to climate change, the Arctic polar sea ice is melting (Reference SolomonSolomon and others, 2007), with the summer Arctic sea-ice extent decreasing (Reference Serreze, Holland and StroeveSerreze and others, 2007) and the remaining summer sea ice thinning (Reference Kwok and RothrockKwok and Rothrock, 2009). Large interannual variations in pack-ice properties have been observed along the Canadian east coast as documented by the Canadian Ice Service (http://ice-glaces.ec.gc.ca/IceGraph103/) and in the Canadian Beaufort Sea (Reference Galley, Key, Barber, Hwang and EhnGalley and others, 2008; Reference Fissel, Marko and Martínez de SaavedraFissel and others, 2009). Along the southern Labrador coast, the decadal variability present in the early part of the 1968–2011 time series of maximum winter ice extent has been followed by a steady decline in maximum ice extent since the early 1990s. Reference Fissel, Marko and Martínez de SaavedraFissel and others (2009) found that air temperatures in the Canadian Beaufort Sea have clearly risen by 2–4°C, and large trends of reduced ice cover were seen in late summer ice concentrations for the Alaskan and Canadian Beaufort Sea regions (–6% to – 1 1% per decade). Reference Galley, Else, Howell, Lukovich and BarberGalley and others (2012) showed that for the Amundsen Gulf and southern Canadian Beaufort Sea the duration of landfast ice has decreased by several weeks per decade as both the onset of landfast ice occurs later and the break-up occurs earlier.
Sea-ice field programs conducted over the Canadian coastal pack ice have monitored snow and ice properties with helicopter-borne sensors, ice beacons and moorings. Helicopter-borne observation systems have been developed since the 1980s (e.g. Reference Kovacs, Valleau and HolladayKovacs and others, 1987; Reference Haas, Lobach, Hendricks, Rabenstein and PfafflingHaas and others, 2009) and the same sensors are presently mounted within a cigar-shaped mounting tube attached either beneath a Bell 206L helicopter or in front of a Messerschmitt BO105 helicopter. Off the Labrador coast, Bell 206L helicopters are used and chartered from Canadian Helicopters Limited (Fig. 1). The helicopter-borne electromagnetic (EM)–laser system (called ‘Ice Pic’) measures ice-plus-snow thickness and ice surface roughness (Reference Peterson, Prinsenberg and HolladayPeterson and others, 2003).
Canadian Helicopter Ltd Bell 206L helicopter showing the fix-mounted sensor equipment. The EM sensor is located in the outer section and the video-laser in the middle section of the cigar-shaped mount.

This paper presents the ice properties observed by the helicopter-borne EM–laser system during ice surveys in the Amundsen Gulf (located in the Canadian Beaufort Sea) and over the Labrador Shelf and shows how the different winter atmospheric conditions were responsible for the observed variability in mobile pack-ice properties. The data presented in this paper and related publications are available at http://www.bio.gc.ca/science/research-recherche/ocean/ice-glace/index-eng.php.
Instrumentation
The helicopter-borne EM–laser system, called the ‘Ice Pic’, consists of an EM sensor with transmitter and receiving coils (transmitter frequencies of 1.7, 5.0, 11.7 and 35.1 kHz) and a laser altimeter. The laser altimeter data provide ice surface roughness profiles and the height of the EM sensor above the pack ice. The laser is an ADM 3-Alpha Geophysical unit built by Optech Inc. and has a listed accuracy of 1.5 cm. The laser measures the distance to the pack-ice surface, and the EM sensor the distance to the ocean surface water, it being the nearest conductor. Together they provide snow-plus-ice thicknesses. The data are collected during low-flying survey tracks at an altitude of 5–6 m. The sampling rate for the ice thickness and ice roughness data is 10 Hz, corresponding to a spatial sampling interval of 3–4 m for the normal helicopter survey speed of 80 mp (∼130kn h−1)h. The data are available in real time to the operator from a computer strapped in the back seat of the helicopter. The bulk conductivity of the sea ice is also available in real time for the operator and provides information on the presence of multi-year versus first-year ice. The ‘Ice Pic’ has its own GPS sensor and provides it with the required power. It is a Garmin GPS18 and has a listed horizontal distance accuracy of <15 m for 95% of the time when provided a clear view of the GPS satellites.
Several studies have validated the EM ice-plus-snow thicknesses by comparing them successfully with ice and snow thicknesses measured at holes drilled through the first-year ice (Reference Peterson, Prinsenberg and HolladayPeterson and others, 2003; Reference Prinsenberg, Peterson and HolladayPrinsenberg and others, 2008). Over first-year level ice, EM helicopter ice thickness data have an accuracy of ∼5–10cm; larger differences are expected over rough deformed first-year ice and multi-year ice (Reference Haas, Jochmann, Loeset, Bonnemaire and BjerkasHaas and Jochmann, 2003; Reference Peterson, Prinsenberg and HolladayPeterson and others, 2003; Reference Prinsenberg, Peterson and HolladayPrinsenberg and others, 2008; Reference Johnston and HaasJohnston and Haas, 2011). The main intended use of the EM-laser system was to monitor pack-ice properties along the Canadian east coast where predominantly rough first-year pack ice occurs. With these conditions in mind, the EM thicknesses are limited to 12–15 m even though EM thicknesses of 30–40 m should be measurable when relatively flat glacial or multi-year sea ice is encountered. Since 2004, the EM system has also been used successfully over first-year and multi-year pack ice of the Canadian Beaufort Sea in both winter and summer surveys.
Owing to footprint size considerations, helicopter-borne EM ice thickness data are not expected or intended to capture the details of individual extreme multi-year ice draft features (Reference Johnston and HaasJohnston and Haas, 2011), but instead provide spatially averaged thickness estimates along long flight-lines. When drillhole data from rough first-year and multi-year ice are averaged over the diameter of the EM footprint, they are similar to the EM ice thickness data (Reference Peterson, Prinsenberg and HolladayPeterson and others, 2003; Reference Prinsenberg, Peterson and HolladayPrinsenberg and others, 2008; Reference Johnston and HaasJohnston and Haas, 2011). The footprint size, which is dependent on altitude, is 20–25 m for 2 m thick ice for the fix-mounted EM sensors flown at 5–6 m altitude. Even though most of the return EM signal strength comes from the central 50% of the footprint, the correspondingly smaller ‘half-footprint’ diameter of 10.0–12.5 m becomes an issue when the floe sizes are of similar dimensions, such as those found in the wave-broken marginal ice zone (MIZ) off the Labrador coast. However, as observations will show, the floes within the pack ice in the wave-broken MIZ along the Labrador coast were compacted so that the EM-derived ice thickness is not biased by low ice concentration.
Observations
Large interannual pack-ice variability caused by atmospheric forcing variabilities has been documented for two areas where repeated surveys have taken place: one in the Amundsen Gulf of the Canadian Beaufort Sea for the winters of 2004 and 2008 and one over the Labrador Shelf for the winters of 2009 and 2011. The 2004 Amundsen Gulf data (Fig. 2a) were observed during the Canadian Arctic Shelf Exchange Study (CASES) project (Reference Fortier, Barber, Fortier, Barber and MichaudFortier and Barber, 2008), and the 2008 data during the international Circumpolar Flaw Lead (CFL) project (Reference BarberBarber and others, 2010). The ice observations are shown as modal thicknesses overlain on satellite imagery and as ice thickness histograms (in 0.1 m thickness bins) with associated flight-track maps. The modal ice thickness along the survey tracks was computed using a window size of 299 points (∼1.4km) and represents the most frequently occurring ice thickness class, which in most cases is level ice. The number of points is essentially arbitrary, but is suitable for characterizing the main features visible in the synthetic aperture radar (SAR) image. The same colour bar range is used for all images so that the difference in modal ice thicknesses between the years as well as their spatial variability for each individual year can be visualized easily. Both the images and flight-track maps are plotted with the vertical axis up to north and the horizontal axis right to east and labeled numerically with degrees north latitude and west longitude. To infer map length scale, it should be noted that 1° latitude of the vertical axis represents 111 km.
Maps showing the survey areas (a) in the southern Canadian Beaufort Sea and (b) over the Labrador Shelf with north up along the vertical axis. The Beaufort Sea map (a) shows the Amundsen Gulf and has two survey areas marked by squares: the left shows the winter survey of 2004 and the right shows the winter survey of 2008. For the two Labrador Shelf surveys (b) the same area was surveyed (square). Note that 1° latitude on the vertical axis represents 111 km, indicating that the survey areas are ∼220 km × 220 km.
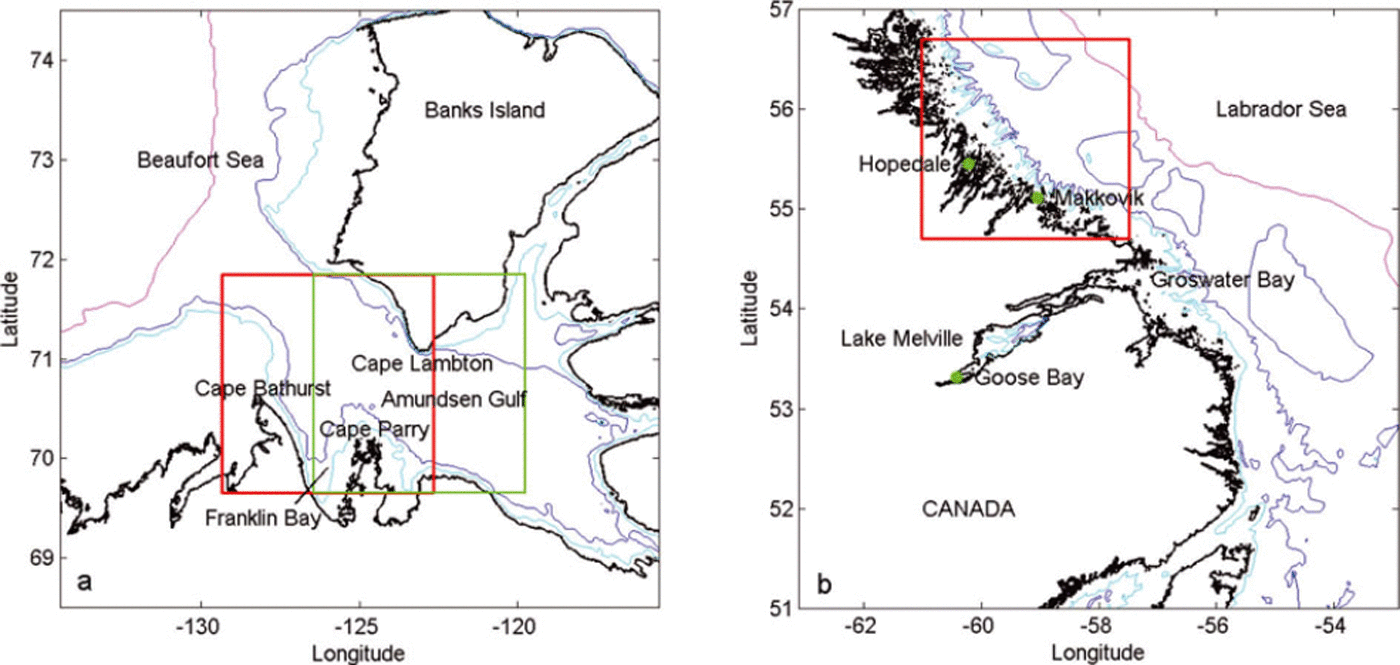
For the Amundsen Gulf 2004 survey, the mobile pack-ice data were observed over a total survey distance of 325 km between 26 April and 8 May 2004, with most of the data discussed observed during 6–8 May. For the Amundsen Gulf 2008 survey, the data were observed over a total survey distance of 390 km between 16 and 23 April 2008, 3 weeks earlier than the 2004 observations. Some additional ice growth could have occurred in 2008 but can be ignored due to the large difference seen in ice thicknesses between the two years. Both Labrador Shelf ice datasets for the winters of 2009 and 2011 were observed during the same period: the 2009 data were observed over a total survey distance of 380 km between 18 and 21 March 2009, and the 2011 data over a total survey distance of 220 km between 19 and 20 March 2011 (Fig. 2b).
Although the ice thickness datasets are referred throughout the paper to winter conditions for a particular year and area, they are in reality snapshots of pack-ice conditions over short time periods, approximately when landfast ice thicknesses approached their winter maxima (Reference BilelloBilello, 1980; Canadian Ice Centre, 1992). For the Amundsen Gulf, landfast ice at Cape Parry reaches its maximum thickness by the third week of May when the snowpack on the ice starts to melt, based on data for the period 1959–90 (Canadian Ice Centre, 1992). Similarly for the Labrador Shelf, the landfast ice observations at Hopedale for the period 1960–84 show that landfast ice along the Labrador Shelf reaches its maximum thickness by the middle of April. Thus the EM offshore ice thickness datasets were observed 3–4 weeks prior to when the maximum landfast ice thickness occurs. The additional ice growth of 8–10 cm over the additional 3–4 weeks, as seen from the mean landfast ice thicknesses (Canadian Ice Centre, 1992), is small as ice growth of thick ice in late winter retards since the growth rates are inversely proportional to the ice thickness. Thus the additional ice growth is small and is assumed not to alter the interannual variability being addressed by the EM ice thickness observations.
Amundsen Gulf pack-ice variability (2004 versus 2008)
As shown in Figure 2a, the Amundsen Gulf is enclosed by land on three sides and is open to the Canadian Beaufort Sea in the west. A large fraction of the first-year ice grown within the Amundsen Gulf exits along the southern coast of Banks Island, while ice from the Beaufort Sea, including multi-year ice, enters the Gulf along Canada’s mainland coast (Reference Peterson, Prinsenberg and HolladayPeterson and others, 2008; Reference Galley, Key, Barber, Hwang and EhnGalley and others, 2008). The Amundsen Gulf often contains a polynya, defined by the World Meteorological Organization (1970) as an area of open water or partially ice-covered ocean where under the region’s climatic conditions a complete ice-covered ocean is expected (Reference Smith, Muench and PeaseSmith and others, 1990). The ice flux between the Canadian Beaufort Sea and the Amundsen Gulf is highly variable and dependent on the wind forcing and the available space in the Canadian Beaufort Sea. There is a mean annual positive ice flux from the Amundsen Gulf into the Arctic Ocean (Reference KwokKwok, 2006; Reference Galley, Key, Barber, Hwang and EhnGalley and others, 2008) and in 2004 an ice arch formed for part of the winter between Cape Lambton on Banks Island and Cape Parry on the Canadian mainland, as can be seen in the SAR image of the Amundsen Gulf for 2004 (Fig. 3). The 2004 EM data have been described in detail by Reference Peterson, Prinsenberg and HolladayPeterson and others (2008). During the 2008 winter, the ice arch was farther east, as can be seen in the 2008 SAR image (Fig. 4). West of the 2004 ice arch, flaw leads form due to easterly and southerly winds as ice moves out of the Gulf and into the Beaufort Sea. Both SAR images are RADARSAT-1 SCWA (HH) images and cover an area of 240 km × 240 km.
RADARSAT-1 (HH) image acquired on 7 May 2004 showing the Amundsen Gulf overlain with ice thickness observations collected on 6–8 May 2004. The modal thickness according to the colour scale is plotted at the location of the flight path. The horizontal model line was collected earlier in the survey on 21 April. The RADARSAT image covers an area of 240 km × 240 km. The green line shows the coastlines of Banks Island (top) and of Cape Parry and Cape Bathurst (bottom).

RADARSAT-1 (HH) image acquired on 19 April 2008 showing the Amundsen Gulf overlain with ice thickness observations collected on 19, 22 and 23 April 2008. The modal thickness according to the colour scale is plotted at the location of the flight path. The RADARSAT image covers an area of 240 km × 240 km with north being up along the vertical axis. The green line shows the coastlines of Banks Island (top) and of Cape Parry (bottom).

The SAR images (Figs 3 and 4) overlain with modal EM ice thicknesses show several differences in overall pack-ice conditions that were present at the times of the winter 2004 and 2008 surveys. The area covered during the 2008 survey is located slightly farther east than in 2004, since the icebreaker used as a helicopter base overwintered in the Amundsen polynya in 2008, while in 2004 it was south of the polynya in the landfast ice of Franklin Bay. The overall differences between the pack ice shown by the images overlain with modal thicknesses are that the pack ice within the Amundsen Gulf in 2008 was much thinner than in 2004 and the ice arch seen in 2004 between Banks Island and the Canadian mainland was farther east near the eastern shore of the Amundsen Gulf. It is possible that the combination of more southeasterly winds and thinner ice prevented the ice arch from solidifying in place during the warmer winter of 2008.
In 2004, young ice was present only in the western half of the image, while consolidated and immobile pack ice was present in the eastern half of the image, anchored in place by an ice arch stretching between the southern tip of Banks Island south to Cape Parry on Canada’s mainland (Fig. 3). The flaw lead west of the ice arch (bright in image) continued along the southwestern shore of Banks Island. The bright SAR regions were caused by frost flowers that were produced on young thin ice during rapid ice growth and were observed from the helicopter during low surveying flights at 5–6 m altitude. The bright SAR areas fade over time as snow accumulates on the ice and absorbs the underlying salt contained in the frost flowers, forming a surface slush layer on the young ice. Thicker mobile pack ice with numerous small leads occurred west of the flaw lead.
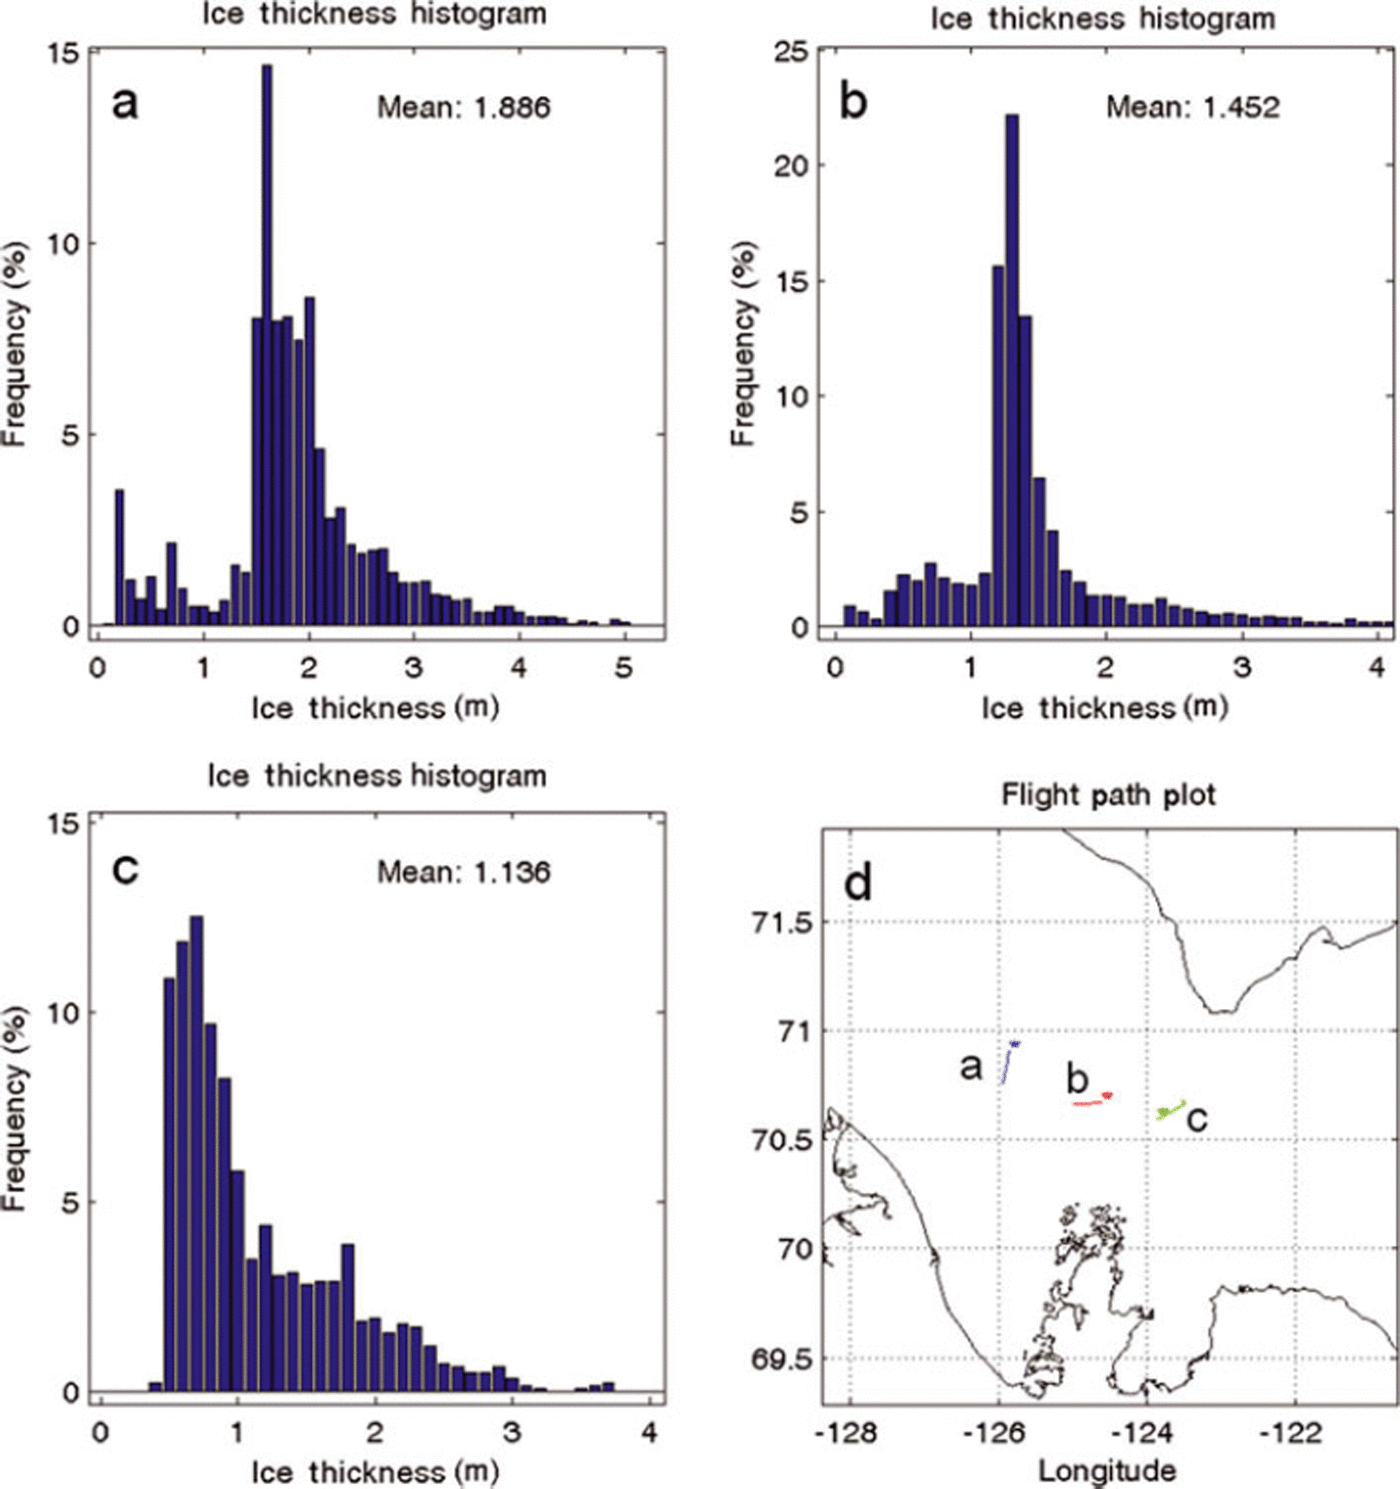
Three ice thickness histograms (Fig. 5) show the change in ice properties as the 2004 ice arch was approached from the west; the histograms can be converted to probability density functions (PDFs) by dividing the frequency by the thickness interval (0.1 m). The histograms cover short track sections of 2–3 km as shown in the location map (Fig. 5). Away from the ice arch the histogram (Fig. 5a) shows that the pack ice had a modal thickness of 1.6 m and a mean ice thickness of 1.9 m; however, some thin leads were present (0.3 m). Halfway to the ice arch the histogram (Fig. 5b) shows that the modal ice thickness had decreased to 1.35 m and the mean ice thickness to 1.5 m. Within the flaw lead west of the ice arch (Fig. 5c) the modal ice thickness was 0.65 m and the mean ice thickness 1.1m. In the smaller leads, ice thicknesses were generally 0–20cm. Landfast ice survey lines in Franklin Bay (Reference Peterson, Prinsenberg and HolladayPeterson and others, 2008) showed that the modal ice thickness was 2.0 m and the mean thickness was 2.3 m due to the additional ice deformation within the pack ice. The 2.0 m snow-plus-ice thickness was the same as the mean values of landfast ice thickness of 1.83m and 17cm of snow observed at the landfast ice station of Cape Parry (Canadian Ice Centre, 1992), indicating that the winter of 2004 can be taken as being a near-normal winter. Ice thicknesses >2.0m should thus be taken as representing deformed ice.
(a–c) Ice thickness histograms observed in 2004 along small line sections of 2–3 km length showing the ice thickness variability as the ice arch at location c is approached from the west. (d) Map showing the location and extent of the lines.
In 2008, consolidated ice was only found close to shore or in small bays in the northern and southern parts of the image (Fig. 4). Numerous young leads were visible as bright features throughout the image and indicated that the pack ice was mobile with a large percentage of open water and thin ice regions. An ice arch, such as present in 2004, did not remain stationary during the 2008 CFL survey. The large flaw lead southeast of Banks Island appears dark, which represents open water (Fig. 4). As shown by the modal colour plot, the EM ice thicknesses observed in the central bright lead area were generally <0.2 m, while those on either side of the lead were >0.9 m, corresponding to medium to thick first-year ice. South of Banks Island, an 18km wide lead covered with 0.6m thick ice was compressed against Banks Island by onshore southerly winds, resulting in a landfast 1.5 km wide rubble field with a mean EM thickness of 8m, made up of 0.6m thick ice blocks of the flaw lead (Reference Prinsenberg, Peterson and HolladayPrinsenberg and others, 2009). A small section of landfast ice inshore of the rubble field showed a thickness of 1.6 m, much less than the landfast ice thicknesses of Franklin Bay seen in 2004.
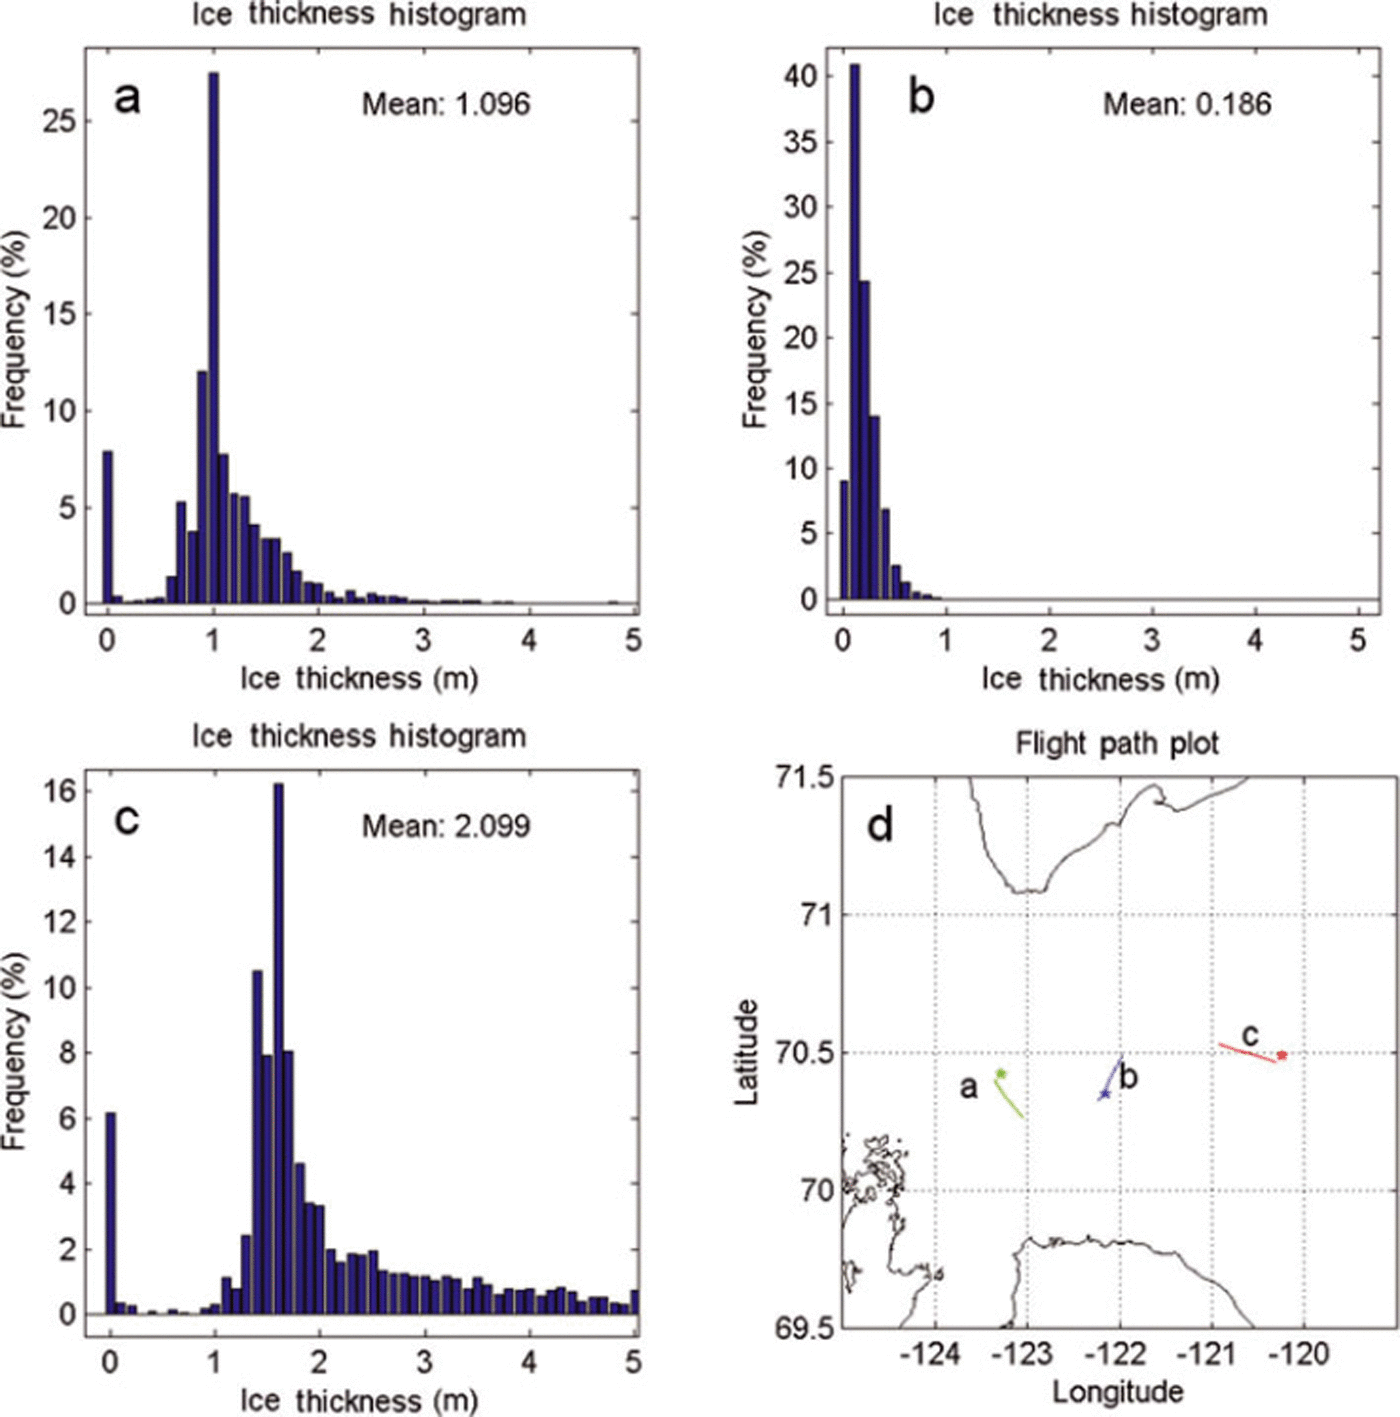
Three ice thickness histograms of short flight-track sections of 2–3km (Fig. 6) show samples of the 2008 winter ice properties for the regions east and west of the thin ice area compared with the central thin ice area (Fig. 6b). West of the thin ice area, the pack ice had a 1.0m modal thickness and a mean ice thickness of 1.1 m; however, some open water in the form of leads was present 8% of the time along the survey track. East of the thin ice area (Fig. 6c), the pack ice had a 1.5 m modal ice thickness and a mean ice thickness of 2.1 m. This histogram has a large percentage of deformed ice (thicknesses >2m), suggesting this pack ice underwent ice deformation episodes (dynamic ice growth). Again leads are present for 6% of the time along the track. For the thin ice area (Fig. 6b), the modal thickness was 0.15 m, the mean thickness was 0.2 m and leads occurred 9% of the time.
(a–c) Ice thickness histograms observed in 2008 along small line sections of 2–3 km length showing the ice thickness variability of the pack ice surrounding the thin ice area at location b. (d) Map showing the location and extent of the lines.
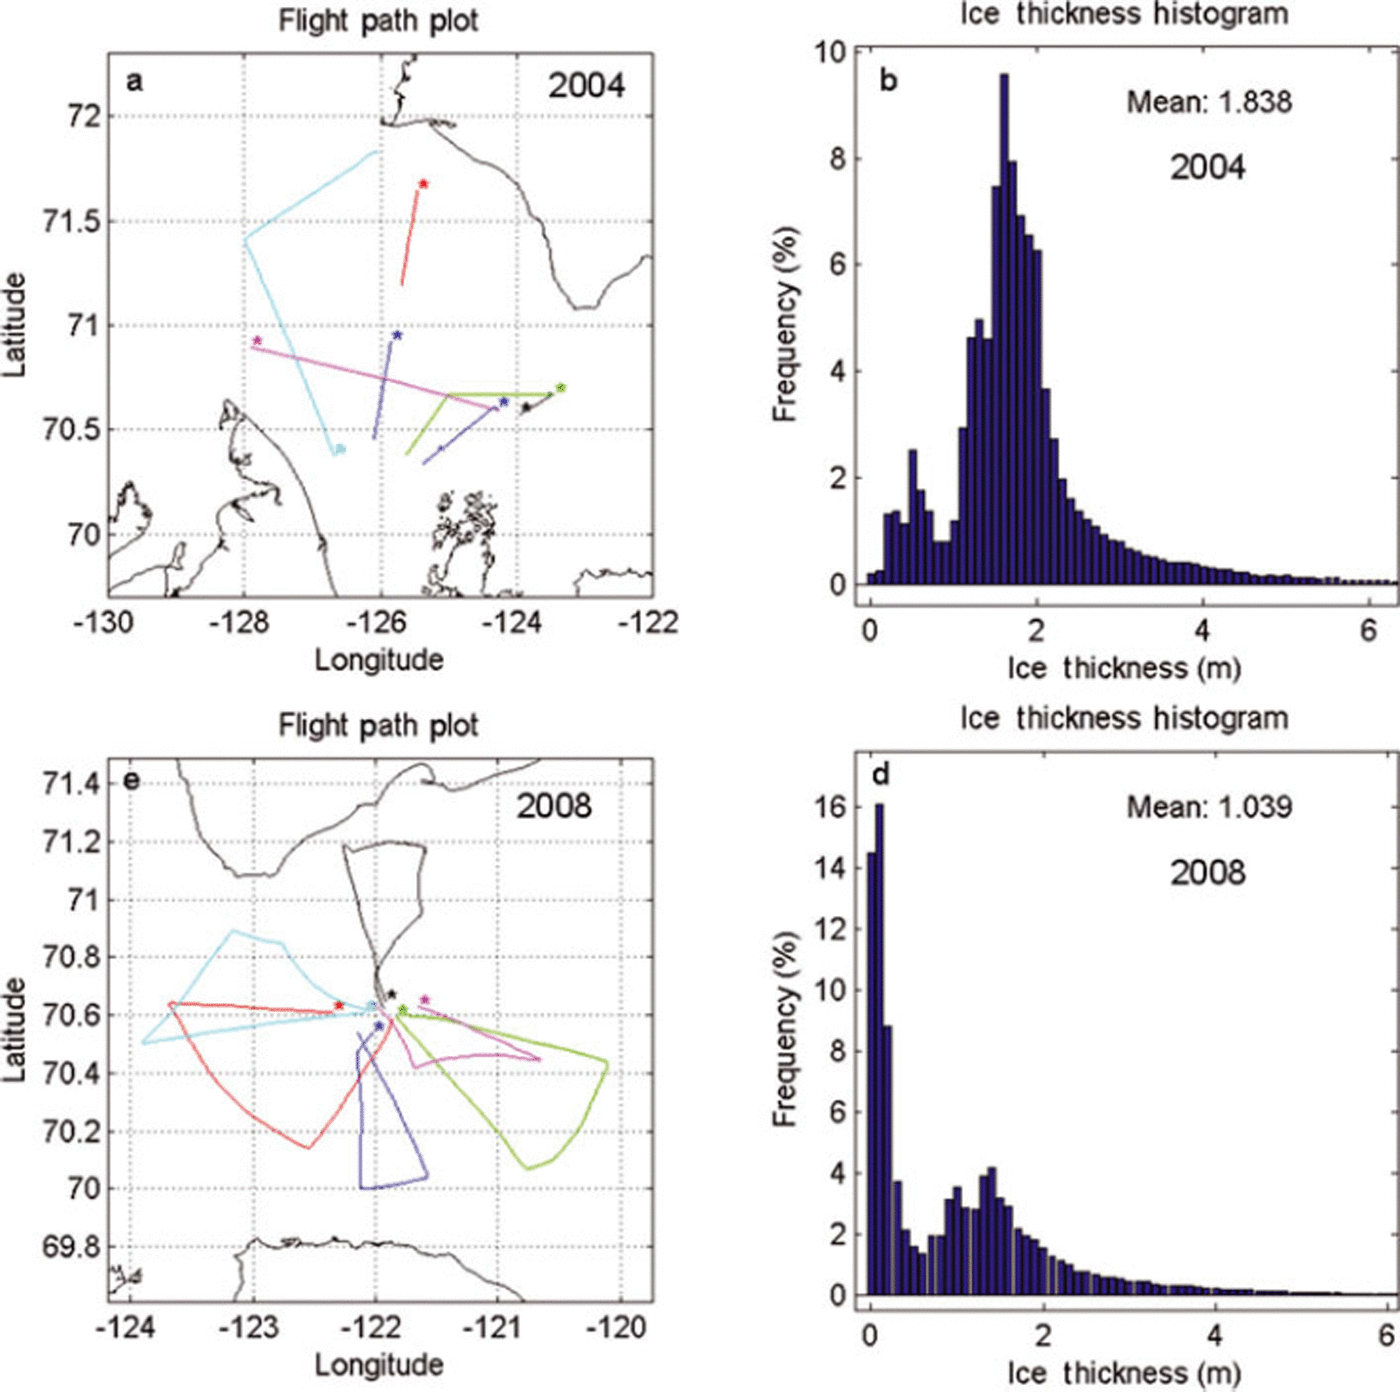
The EM snow-plus-ice thickness data shown as overlays on the 2004 and 2008 SAR images are shown as summation histograms in Figure 7, along with the flight-track maps. The main difference between the two years is the proportion of thin ice and open water (ice <0.2 m). In 2008, there was thin ice and open water along the survey tracks 30% of the time, compared to only 0.4% in 2004. Both histograms show two thick ice classes separated in both years by 40 cm with a shift to thinner ice in 2008 relative to 2004. In 2004, the ice class peaks were centred at 1.3 and 1.7 m, while in 2008 they were centred at 1.0 and 1.4 m. A thinner ice class peak at 0.6m was also present in 2004. The modal class peaks are interpreted as resulting from thermodynamic ice growth when large regions of open water became available for new ice growth due to ice export from the polynya area. The thinner ice class peaks are younger than the thicker ice class peaks. Most of the ice thicknesses beyond ∼2.0 m in 2003/04 and ∼1.8 m in 2007/08 are assumed to be caused by deformation (rafting and ridging).
Flight tracks (a, c) and ice thickness histograms (b, d) of EM profile data collected in the Amundsen Gulf during the winters of (a, b) 2004 and (c, d) 2008.
The thinner ice in 2008 can be explained partially by the fact that the 2008 winter was warmer in general and the pack ice could not have attained as great a maximum thickness as in 2004 through thermodynamic ice growth alone. Monthly mean air temperatures from November to April were 1–5°C warmer during 2007/08 compared with 2003/04 (Table 1). The data were obtained from the Environment Canada website http://climate.weatheroffice. gc.ca/climateData/canada_ehtml. Interannual winter severity can be described by a freezing degree-days (FDDs) index, which simply sums up the daily temperatures of the particular winter. Owing to higher January and February air temperatures, the 2007/08 winter was less severe (FDD index ∼4300) than the 2003/04 winter (FDD index ∼5000), which represented a near-normal winter compared with the climatic normal FDD index of 4850 (http://climate.weather-office.gc.ca/climate-normals).
Monthly mean air temperatures at Cape Parry (Environment Canada) and westward NCEP/NCAR reanalysis wind component at 70°N, 122.5°W (Reference KalnayKalnay and others, 1996)

FDD units have also been used in simple FDD ice growth models (Reference AndersonAnderson, 1961; Reference BilelloBilello, 1961; Reference Brown and CotéBrown and Cote, 1992) to estimate the ice thickness (h i) evolution of Arctic landfast stations from the sum of the daily air temperatures T a

where FDD* is defined for sea ice as Σ(–1.8–Ta), with –1.8°C being the freezing temperature of sea ice. C 1 and C 2 are constants that depend on local snow conditions, which vary greatly in FDD models for the landfast ice stations along the Canadian east and Arctic coasts (Reference PrinsenbergPrinsenberg, 1992) and are verified by snow and ice observations by the Canadian Ice Service (1992). The observed 30 year mean ice thickness at Cape Parry was 183 cm, with a standard deviation of 22cm and a mean snow-cover depth of 19cm. For Cape Parry, the difference in ice thicknesses simulated by the FDD model for 2004 and 2008 was only 8–10cm, far less than the 30 cm difference seen in the observed thicknesses for the ice class peaks of the offshore EM data. Therefore the difference in ice class peaks of 2004 versus 2008 cannot be explained solely by thermodynamic growth. Some additional reasons such as snowpack variability, dynamic ice growth or delay in the onset of pack-ice freezing need to be considered and such an investigation can be better addressed with a fine-grid regional ice–ocean model.
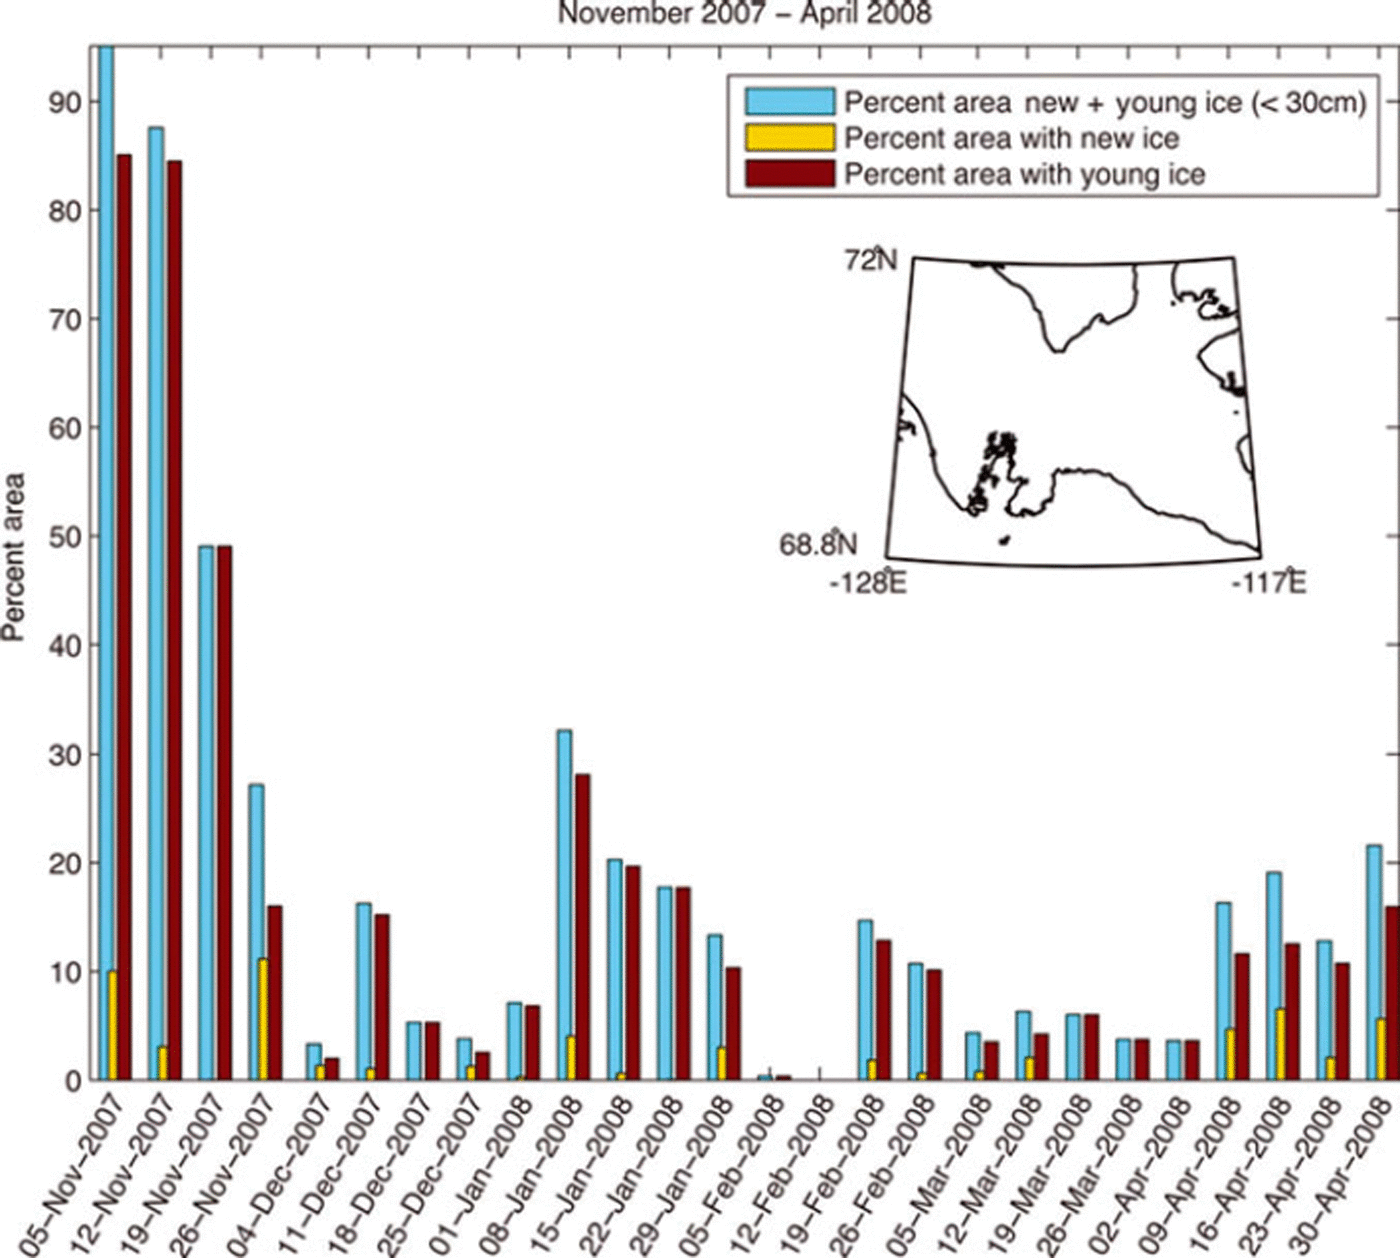
To compare the offshore winds of 2004 and 2008 (Fig. 8), the National Centers for Environmental Prediction/National Center for Atmospheric Research (NCEP/NCAR) reanalysis (Reference KalnayKalnay and others, 1996) surface wind velocities were obtained from the US National Oceanic and Atmospheric Administration (NOAA) website (NOAA/OAR/ESRL PSD, http://www.esrl.noaa.gov/psd) for a gridpoint just south of Banks Island (71.25°N, 121.25°W). The 2004 winds show that westerlies persisted from early winter to well into the 2004 calendar year (to Julian day 30) and brought low temperatures to the region. Variable winds from the southeast then appeared between Julian days 30 and 60, bringing higher temperatures to the region. Strong persistent easterly wind events did not start again until Julian day 87. For 2008, variable northeasterly to southeasterly wind events occurred after Julian day 0, bringing normal temperatures to the region. Some large persistent southeasterly to northeasterly wind events occurred at Julian days 42 and 52 and again at Julian days 92–100. Easterly winds between Julian days 42–52 were responsible for the relatively high February temperatures shown in Table 1. Easterly wind events are highlighted in Figure 8 by grey-coloured boxes and represent time periods when ice fluxes from the Amundsen Gulf should occur. Similarly for 2008, wind events on Julian days 42–55 and 91–107 represent extended time periods when open-water conditions were formed and new ice growth produced ice classes that were thinner than the surrounding pack ice in the Gulf throughout the winter. For the winter of 2008, weekly ice charts are available to show that this process indeed occurred (Fig. 9). For the extended periods of time when easterly winds occurred, an increased percentage of thin ice area was shown to exist on the weekly ice charts of Julian days 50 and 57 for the first period of extended easterly winds and again for the weekly ice charts starting with Julian day 100 (Fig. 9). When ice growth in the FDD model was initialized at these extended wind periods, the thinner ice class peaks of 1.1 and 0.2m were attained, similar to what is seen in the ice thickness histogram shown in Figure 7. Thus, the combined influence of higher air temperature conditions, which reduced ice growth, and increased easterly wind periods, which increased ice transport from the region, resulted in reduced pack-ice conditions and lower ice class peak thicknesses.
Time series of 6 hour surface wind velocities for 1 January to 30 April (Julian days 1–120) shown as stick plots for a grid station at 71° N, 121° W south of Banks Island in the eastern Canadian Beaufort Sea: (a, b) winter 2004; (c, d) winter 2008. Boxed areas represent persistent easterly wind events stimulating periods of westward ice flux out of the Amundsen Gulf.

Percentage area of thin ice in the Amundsen Gulf derived from weekly Canadian Ice Service ice charts for the winter of 2007/08.
Labrador Shelf pack-ice variability (2009 versus 2011)
A similar dataset was observed over the Labrador Shelf during the winters of 2009 and 2011. These data have been published elsewhere (Reference Prinsenberg, Peterson, Holladay and LalumierePrinsenberg and others, 2011, Reference Prinsenberg, Peterson, Holladay and Lalumiere2012a,Reference Prinsenberg, Peterson, Holladay and Lalumiereb). The seasonal pack ice over the Labrador Shelf is restricted to the coastal continental shelf and considered a MIZ. The pack ice is strongly affected by the wave field generated in the adjacent ice-free Labrador Sea and by the southward-flowing Labrador Current centred along the continental slope. Along with the prevailing northwesterly winter winds, the pack ice moves southwards along the coast (Reference PetersonPeterson, 1987) and reaches its most southerly ice extent in mid-April (http://ice-glaces.ec.gc.ca/IceGraph103/).
SAR images for 2009 and 2011 are overlain with modal EM ice thicknesses in Figures 10 and 11, respectively. Figure 10 shows the ice thickness data observed between 18 and 21 March 2009 overlain on an HH RADARSAT-2 image of 19 March (10.15 UTC). The 200 km × 200 km 2009 SAR image (Fig. 10) shows several distinct SAR brightness and texture ice signature regions. Offshore there is a bright SAR homogeneous region, inshore of which is a region with a mixture of dark areas and moderately bright areas. Farther inshore (at 55.4°N, 59.48 W) are other bright regions where remnants of frost flowers and small-scale roughness features on thin ice were seen. Just before the landfast ice area, several large dark areas appear, representing open water and scattered frazil-ice areas. The landfast ice inshore of these dark areas is clearly distinguishable; some rougher ice regions (brighter SAR) are present closer to the ice edge, and smoother landfast regions (darker SAR regions) are present closer to the coast, anchored and protected by the numerous offshore islands (Reference Prinsenberg, Peterson, Holladay and LalumierePrinsenberg and others, 2011, Reference Prinsenberg, Peterson, Holladay and Lalumiere2012a).
RADARSAT-2 image (200 km × 200 km) from 19 March 2009 overlain with ice thickness data collected on 18–21 March 2009 (©RADARSAT-2 data and products, ©MacDonald, Dettwiler and Associates Ltd (2010) - all rights reserved).

RADARSAT-1 image (200km × 200km) from 21 March 2011 overlain with ice thickness data collected on 19–20 March 2011 (©RADARSAT-2 data and products, ©MacDonald, Dettwiler and Associates Ltd (2011) - all rights reserved).

Differences in 2009 winter modal ice thicknesses shown as overlays on the SAR images are presented in more detail in Figure 12 as ice thickness histograms of short track section plots for the Makkovik survey line (second line from southeast corner). The histograms show that inshore the pack ice has a modal thickness of 0.4m and a mean ice thickness of 0.7m. Leads are present as shown by the 5% frequency of the 0.0 m ice thickness bin. The histogram of the middle section (Fig. 12b) shows that this section of the pack ice consists of two ice classes with modal thicknesses of 2.0 and 4.0 m. Leads are also present for 3% of the time (0.0 and 0.1 m thickness bins). Offshore where the 2009 SAR image shows a bright homogeneous pack-ice region, the line section histogram (Fig. 12c) shows that the pack ice there has a modal thickness of 1.25 m with some thicker rafted ice that caused the mean ice thickness to reach 1.8m. The offshore pack ice appeared to be compressed against the inshore pack ice as no thickness in the 0.0 m thickness bin was seen to indicate the presence of leads. The ice thicknesses for the offshore region were less variable and did not attain the higher extreme thicknesses seen in the middle pack-ice region (Fig. 12b). The outer landfast ice area was generally brighter in the SAR image and was thicker and rougher, while the landfast ice closer to the coast was darker in the SAR image with low homogeneous ice thicknesses (Reference Prinsenberg, Peterson, Holladay and LalumierePrinsenberg and others, 2011). Just off the landfast ice areas, the modal ice thicknesses for both the bright and dark inshore SAR areas of the mobile pack ice were low and the ice appeared to be the youngest in the sampled area.
(a–c) Ice thickness histograms from three small line sections of the Makkovik survey line from 20 March 2009. (d) Map showing the location and extent of the lines.

Photographs were taken along the survey tracks with handheld cameras and with the video fix-mounted camera and are available from http://www.bio.gc.ca/science/re-search-recherche/ocean/ice-glace/index-eng.php. Figure 13a and b show two photographs from the Makkovik survey line taken at 5–6m altitude during the 2009 survey while EM thickness data were being collected. Figure 13a shows the wave-broken ice floes in the offshore bright SAR image region. Floes are small (5–10 m), with some showing large freeboards indicating that the pack ice was a mixture of thick and thin ice, as shown in the ice thickness histogram for the area (Fig. 12c). Figure 13b shows the rough large floes seen in the middle section of the pack ice in 2009, the ice thickness histogram of which is shown in Figure 12b. Although no leads are shown in this photograph, leads were present between large composite floes in this region. Theories indicate that ice thickness, ice strength and swell wavelength determine the floe size distribution of pack ice in the MIZ that is affected by wave action (Reference Toyota, Takatsuji and NakayamaToyota and others, 2006). Modelling of wave-broken ice in the MIZ was undertaken by Reference Dumont, Kohout and BertinoDumont and others (2011); although the model was applied to the Fram Strait region where the ice is stronger than off the Labrador coast, the general process is the same.
Photographs from the Makkovik survey line taken in (a, b) 2009 at low altitude (5m) and in (c, d) 2011 from 140 m altitude. The 2009 photographs were taken at the inshore side of line section c in Figure 12, showing the wave-broken floes (a), and at the inshore side of line section b in Figure 12, showing the large thick consolidated ice floes (b). The 2011 photographs were taken at the inshore side of line section c in Figure 14, showing the wave-broken floes (c), and at the inshore side of line section b in Figure 14, showing the large consolidated ice floes (d).

The HH RADARSAT-1 image of 21 March 2011 (1012Z) overlain with the modal ice thickness data (Fig. 11) shows the ice thickness data observed over the mobile pack ice off the Labrador coast between 19 and 20 March 2011. The data along the most westerly survey track (left) were observed on 19 March and those along the remaining three tracks on 20 March, the day before the image was acquired. The eastern two offshore tracks were shortened relative to those surveyed in 2009 due to unsafe flying conditions, not to helicopter range. Similar to the 2009 image (Fig. 10), the 2011 SAR image shows distinct SAR ice signature regions. Offshore there is again a bright SAR homogeneous image region of small wave-broken ice floes. Inshore of this there is a region with a mixture of dark areas and moderately bright areas where larger floes and leads are present. Farther inshore there are bright SAR regions generated by small-scale pack-ice surface roughness on large floes. Here also small floes occur, generated by the mobile pack ice shearing against the landfast ice. Just before the landfast ice area, several large dark areas appear representing open-water and scattered frazil-ice areas.
The variability of ice features within the 2009 SAR image is shown in detail by ice thickness histograms of short track section plots in Figure 14 for the Makkovik line, the second line from the southeast corner shown in Figure 11. The histograms show that inshore the pack ice has a modal thickness of 0.65 m and a mean ice thickness of 0.9 m. Leads are present as shown by the 3% frequency of the 0.0 m ice thickness bin. The middle section histogram (Fig. 14b) shows that this section of the pack ice consists of similar ice to the inshore section, having a modal thickness of 0.75 m and a mean thickness of 0.9 m, but consists of larger floes as seen in Figure 13d. Offshore where the 2009 SAR image shows the bright homogeneous SAR pack-ice region, the line section histogram (Fig. 14c) shows the pack ice here has a modal thickness of 0.6 m and a mean thickness of 0.7 m. The pack-ice thickness observations in 2011 show very little variation between the three track sections even though the SAR ice signatures varied. As in 2009, the offshore pack ice was compressed against the inshore pack ice as no leads appeared to be present (0.0 m ice thickness bin in Fig. 14c). None of the three histograms show quantities of ice thicker than 3 m as were present in the winter of 2009.
(a–c) Ice thickness histograms from three small line sections of the Makkovik survey line from 19 March 2011. (d) Map showing the location and extent of the lines.
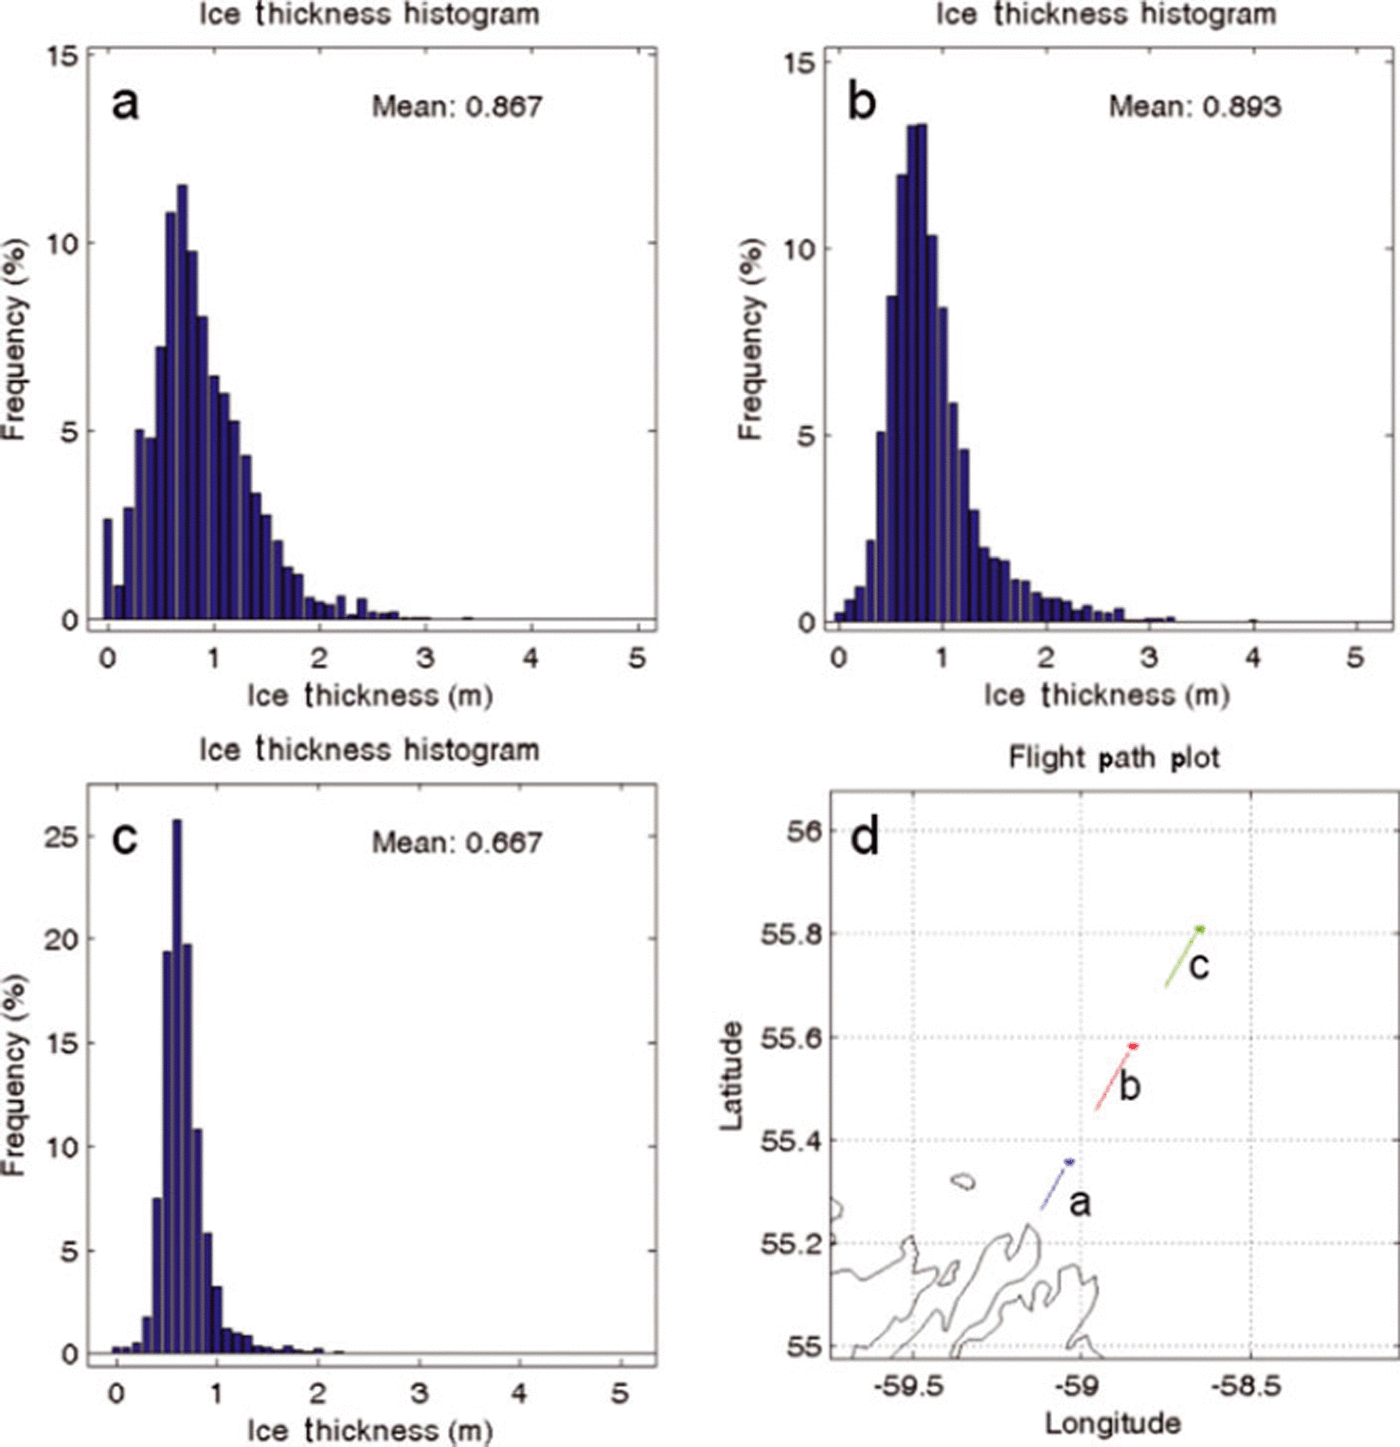
The photographs shown in Figure 13c and d were taken along the Makkovik survey line in 2011 from a helicopter altitude of ∼130m. Figure 13c was taken over the offshore pack ice and shows the wave-broken floes, while Figure 13d is from the middle of the pack ice where some large floes intermixed with smaller floes were present. The track section histograms (Fig. 14) indicate that the pack ice in both photographs has the same thickness, being broken up by waves in one case and comprising large floes in the other. This is very similar to the 2009 pack-ice conditions as shown in the photographs in Figure 13a and b. However, for the 2009 observations the pack ice is thicker, having a second thickness component of 4 m.
As seen in the SAR images and track section ice thickness histogram plots, the pack ice off the Labrador coast varied greatly between the winters of 2009 and 2011. Combining the ice thickness data for each winter in a single histogram (Fig. 15), several significant differences between the ‘normal’ winter of 2009 and the warmer winter of 2011 can be recognized. Relative to 2009, the mean ice thicknesses in 2011 were reduced by half, decreasing from 1.6 to 0.8 m. Similarly, the modal ice thickness decreased by 40 cm from 1.0–1.1m in 2009 to 0.6–0.7 m in 2011. Another difference was the presence of ridged ice with thickness >3m. Very little ridging appeared to be present in 2011 even on the larger consolidated floes. In 2009 a thinner ice class of 0.1–0.3 m ice was predominant along the coast, even though the pack ice farther offshore was much thicker in 2009 than in 2011. Thus, by considering ice thickness histograms alone and ignoring the reduced ice extent in 2011, the ice volume off the mid-Labrador Shelf in 2011 would have been half of that present in 2009.
Flight tracks (a, c) and ice thickness histograms (b, d) of EM profile data collected off the Labrador coast over the mobile pack ice during (a, b) March 2009 and (c, d) March 2011.

Some EM ice thickness data were also observed while passing over the coastal landfast regions. The landfast modal ice thickness, including the thick snow layer in 2009, was 1.6m, much thicker than the 0.75m observed in 2011 (http://www.bio.gc.ca/science/research-recherche/ocean/ice-glace/index-eng.php), and thus reflects a reduction in ice thickness similar to that seen in the offshore mobile pack ice. FDD ice growth models have been used extensively to simulate the observed ice growth and decay patterns of the Labrador Shelf landfast ice (Reference BilelloBilello, 1980; Reference PrinsenbergPrinsenberg, 1992). However, for the offshore mobile pack ice it is not known when the observed pack ice started to grow, so FDD models can only estimate the difference in thermodynamic ice growth, not the absolute thickness. For a reduction of 500 FDDs for the winter of 2011 (December to mid-March) relative to 2009 the model simulated an ice thickness reduction of 0.2 m (from 0.9 to 0.7 m), less than the reduction of 0.4m seen in EM observations.
The ice charts of 19 March (http://ice-glaces.ec.gc.ca/Archive10/) correctly indicate that the 2009 landfast ice was thicker and classified as 70–120cm thick, while in 2011 it was classified as six-tenths with 30–70cm thickness and four-tenths with 70–120 cm thickness. For the offshore pack ice, the ice charts of 19 March show the most frequently occurring ice in the 70–120cm ice class for 2009 and in the thinner 30–70 cm ice class for 2011. Even though these ice class bins are very large, the modal ice thicknesses on the ice charts are similar to those from the EM ice thickness observations.
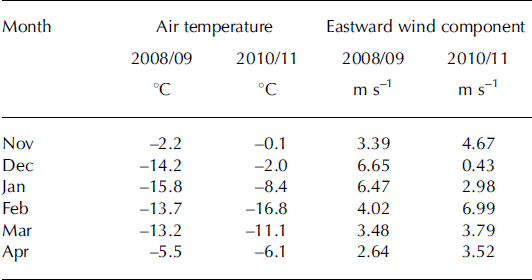
Table 2 shows monthly mean air temperatures for the winters of 2008/09 and 2010/11 from a meteorological shore station at Hopedale located at the northwest corner of the survey area (Fig. 2b), as well as the NCEP eastward surface wind component from the NCEP reanalysis dataset for the nearest gridpoint along the mid-Labrador coast. As shown in Table 2, the winter of 2010/11 was warmer than the winter of 2008/09, which had near-normal air temperatures. The eastward wind component indicates the direction of the wind force acting on the ice, with positive values being a wind force pushing the ice southeastwards along the Labrador coast. The lower eastward wind components of December and January in the winter of 2010/11 relative to the winter of 2008/09 caused a reduction in thicker ice being brought into the Labrador coastal areas from northern latitudes. During these reduced airflows from the west, higher air temperatures occurred, thereby reducing the local ice growth. The short cold period in February 2011 along with the strong eastward winds could not offset the lack of ice growth and ice transport over the period from November through January and resulted in a reduction in ice thicknesses for the winter of 2010/11 relative to the winter of 2008/09.
Monthly mean air temperatures at Hopedale and eastward wind component at 558 N, 60°W for the 2008/09 and 2010/11 winters
Conclusion
Ice surveys using helicopter-borne EM–laser sensors have observed detailed ice thickness data on the pack ice in Canadian coastal waters. Repeated winter ice surveys in the Amundsen Gulf and over the Labrador Shelf covering the same offshore region provided a means to investigate the variability of pack-ice properties caused by changes in the mean atmospheric conditions.
For the Amundsen Gulf in the eastern Canadian Beaufort Sea, peaks in ice thickness histograms shifted for the warmer winter of 2008 by 40 cm to thinner ice classes relative to the near-normal winter of 2004. The 2008 histogram also had a larger spatial fraction of open water and thin ice (0.1–0.2 m) compared with the winter of 2004. The thinner ice class peaks in 2008 can be explained partially by reduced local thermodynamic ice growth during the warmer winter of 2008. But in addition, winds from the southeast were more persistent throughout the winter of 2008, exporting more ice from the Amundsen Gulf. This caused open-water areas where a higher fraction of younger thinner ice grew, resulting in the thinner ice class peaks.
Similar atmospheric controls were observed for the pack ice of the Labrador Shelf. The mean and modal ice thicknesses of the warmer winter of 2011 were much less than those of the near-normal winter of 2009, with a mean offshore ice thickness of 0.71 m in 2011 relative to 1.68 m in 2009. The thinner ice in 2011 can be explained in part by the fact that the 2011 winter was warmer, reducing local ice growth. The higher air temperatures are caused by above-‘normal’ winds from the southeast which reduce the transport of thicker ice from northern latitudes to the Labrador Shelf and thus further reduce the observed ice thicknesses.
As stated, one-dimensional thermodynamic ice growth as estimated by FDD models cannot alone account for the observed reduced ice thickness in both regions. Thus although the reduction in FDD units relative to the freezing temperature of sea water (–1.8°C) was 15% for the Amundsen Gulf and 30% for the Labrador Shelf, the reduction in ice thickness simulated by FDD models is much less than that observed. The wind effect on the observed ice thicknesses also needs to be taken into account. A three-dimensional regional ice–ocean coupled model that can incorporate both effects is thus required to simulate the observed pack-ice variabilities presented in this paper.
Acknowledgements
We thank Canadian Helicopters Limited (CHL) personnel from Goose Bay and the Canadian Coast Guard personnel from the CCGS Amundsen for their assistance during the survey. We also thank Dave Barber, leader of the CFL program, and Louis Fortier, leader of the CASES program, for supporting the field programs run from the CCGS Amundsen as part of the ArcticNet program. This work was supported by the Canadian Program of Energy Research and Development (PERD), the Canadian Space Agency (CSA) program and the Environmental Science Revolving Fund (ESRF).



