1. Introduction
The following problem comes from Peter Cameron’s book, [Reference Cameron4, p.154]:
n people stand in a circle. Each player looks down at someone else’s feet (i.e., not at their own feet). At a given signal, everyone looks up from the feet to the eyes of the person they were looking at. If two people make eye contact, they scream. What is the probability
 $q_n$
, say, of at least one pair screaming?
The purpose of this note is to put this problem in its natural probabilistic setting, namely that of a random mapping whose core is a derangement, for which many properties can be calculated simply. We focus primarily on the small components, but comment on other limiting regimes in the discussion.
We begin by describing the usual model for a random mapping. Let
 $B_1,B_2,\ldots,B_n$
be independent and identically distributed random variables satisfying
 $\mathbb{P}(B_i = j) = 1/n$
,
 $j \in [n]$
, where
 $[n] = \{1,2,\ldots,n\}$
. The mapping
 $f \colon [n] \to [n]$
is given by
 $f(i) = B_i$
. Components of the mapping are formed by iteration: i and j are in the same component if some iterate of i equals some iterate of j; each component is a directed cycle of rooted, labeled trees. An example with
 $n = 20$
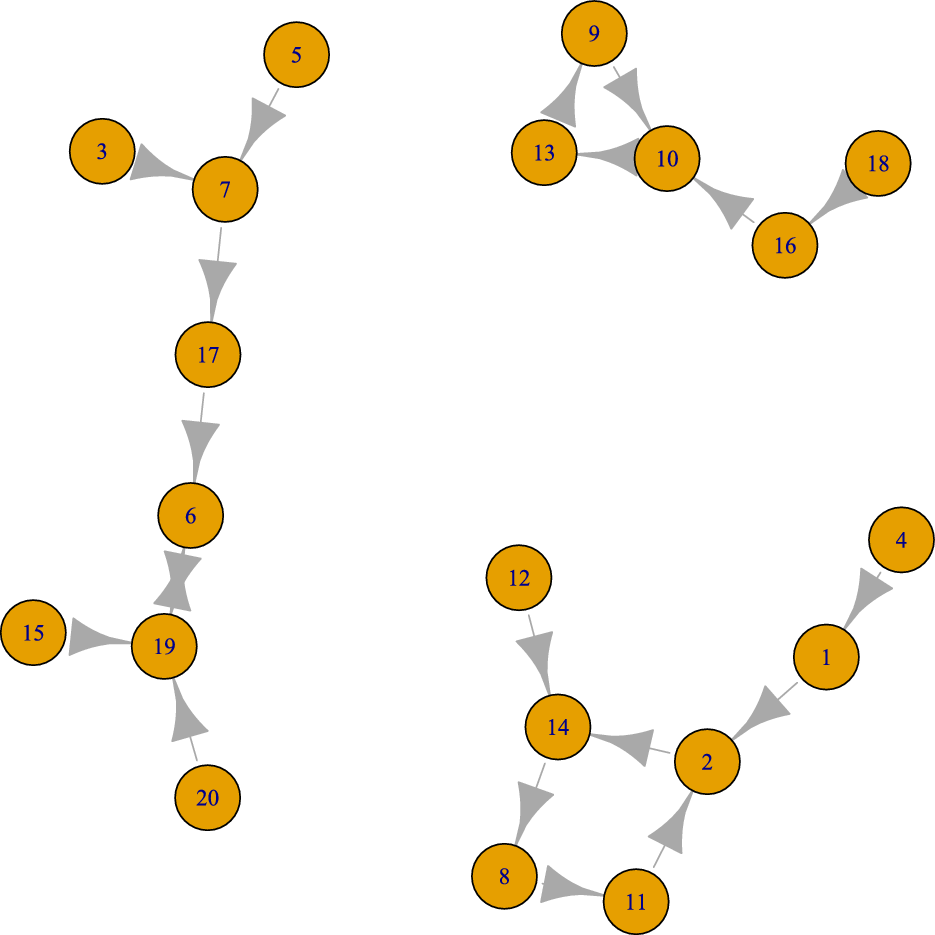
, displayed in Fig. 1, is given in Table 1. Elements 12 and 4 are in the same component because
 $f(12) = 14 = f(f(f(4)))$
.
A mapping graph on
 $n = 20$
vertices with no singleton cycles. This one has three components, of sizes 5, 7, and 8. There are none elements in cycles, which have lengths 3, 4, and 2 respectively. Figure produced by the R igraph package [Reference Csardi and Nepusz5].
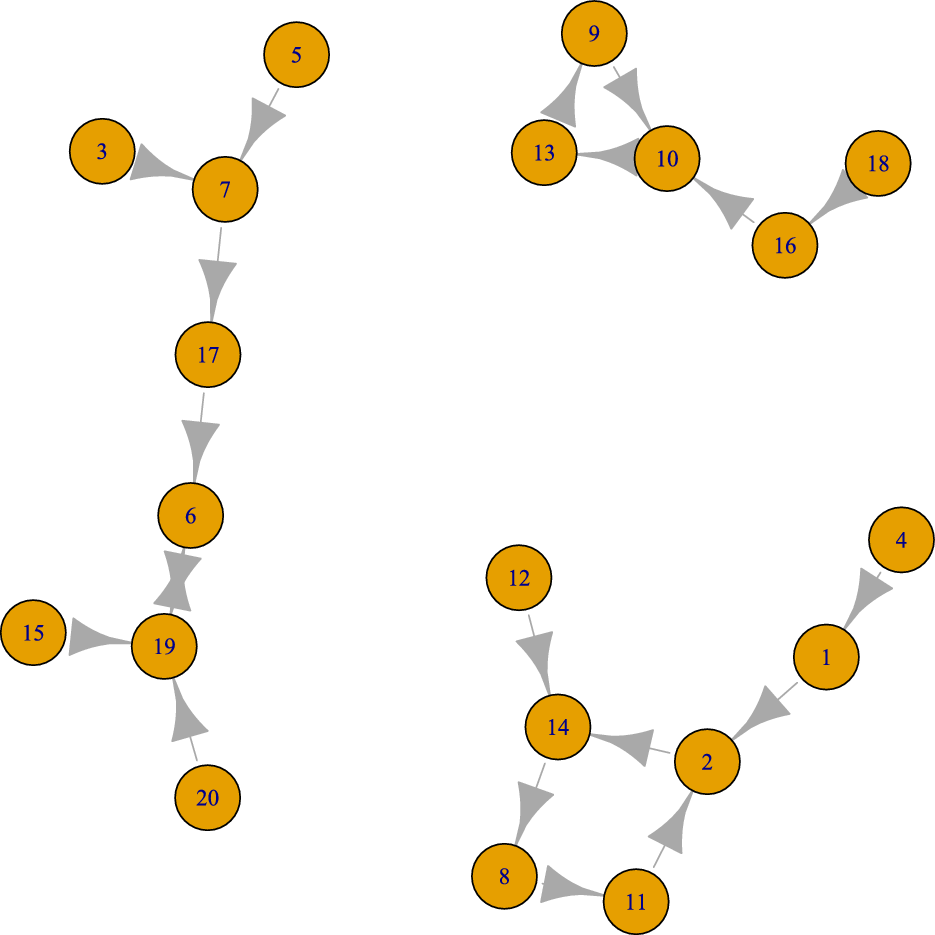
Example mapping for
 $n = 20$
(see Fig. 1).

1.1. The components of a random mapping
Denoting the number of components of size j by
 $C_j(n)$
,
 $j\;=\;1,2, \ldots, n$
, [Reference Harris10] showed that the probability that a random mapping has
 $a_j$
components of size j is
 \begin{equation} \mathbb{P}(C_j(n) = a_j, j\;=\;1,\ldots,n) = \textbf{1}\left\{\sum_{j\;=\;1}^n j a_j = n\right\}\, \frac{n!e^n}{n^n} \prod_{j\;=\;1}^n \frac{\lambda_j^{a_j}}{a_j!},\end{equation}
where
 \begin{equation} \lambda_j = \frac{\mathrm{e}^{-j}}{j} \sum_{i\;=\;0}^{j-1}\frac{j^i}{i!} = \frac{1}{j}\,\mathbb{P}(\textrm{Po}(j) < j),\end{equation}
 $\textrm{Po}(\mu)$
denoting a Poisson random variable with mean
 $\mu$
. In particular, the probability that a mapping of size n has a single component is
 \begin{equation*} s_n \;:\!=\; \mathbb{P}(C_n(n) = 1) = \frac{n! \mathrm{e}^n}{n^n} \, \lambda_n.\end{equation*}
It follows readily from (1) that
 \begin{equation} \mathbb{E} C_j(n) = \frac{n!}{n^n} \frac{(n-j)^{n-j}}{(n-j)!} \mathrm{e}^j \lambda_j = s_j \,\binom{n}{j} \left(\frac{j}{n}\right)^j \left( 1 - \frac{j}{n}\right)^{n-j} , \qquad j\;=\;1,2,\ldots,n.\end{equation}
A probabilistic interpretation of (3) is given in [Reference Donnelly, Ewens and Padmadisastra7]. Kolchin [Reference Kolchin11] established that
 $(C_1(n),C_2(n),\ldots) \Rightarrow (Z_1,Z_2,\ldots)$
, where the
 $Z_i$
are independent Poisson random variables with means
 $\mathbb{E} Z_i = \lambda_i$
. Many other properties of random mappings may be found, for example, in [Reference Donnelly, Ewens and Padmadisastra7].
1.2. The core of a random mapping
Here we record some properties of the core of a random mapping, the set of elements that are in cycles. Results (4)–(6) are classical; see, for example, [Reference Bollobás3, p. 366]. The number
 $N_n$
of elements in the core has a distribution given by
 \begin{equation}\mathbb{P}(N_n = r) = \frac{r}{n}\prod_{l=0}^{r-1}\left(1 - \frac{l}{n}\right) = \frac{r}{n} \frac{n_{[r]}}{n^r}, \qquad r=1,\ldots,n,\end{equation}
where
 $n_{[j]} = n(n-1)\cdots (n-j+1).$
The mean of
 $N_n$
is
 \begin{equation*}\mathbb{E} N_n = \sum_{l=0}^{n-1} \frac{(n-1)_{[l]}}{n^l},\end{equation*}
and it follows directly from (4) that
 $N_n/\sqrt{n}$
converges in distribution to a random variable with density function
 $x \mathrm{e}^{-x^2/2}$
,
 $x >0$
. We write
 $C_j^*(n)$
for the number of cycles of size j in the core of a random mapping, and let
 $C'_{\!\!j}(r)$
be the number of cycles of size j in a uniform random permutation of r objects. The joint law of the
 $\mathcal{L}(C_j^*(n))$
is given by
 $\mathcal{L}(C_j^*(n)) = \sum_{r=1}^n \mathbb{P}(N_n = r) \mathcal{L} (C'_{\!\!j}(r))$
, since, conditional on
 $N_n = r$
, the random mapping restricted to its core is a uniformly distributed permutation on those r elements. It follows that
 \begin{equation}\mathbb{E} C_j^*(n) = \frac{1}{j} \frac{n_{[j]}}{n^j}, \qquad j\;=\;1,\ldots,n.\end{equation}
For fixed j,
 $\mathbb{E} C_j^*(n) \to 1/j$
and
 \begin{equation}(C_1^*(n),C_2^*(n),\ldots) \Rightarrow (Z_1^*,Z_2^*,\ldots) ,\end{equation}
where the
 $Z_j^*$
are independent Poisson random variables with mean
 $\mathbb{E} Z^*_j = 1/j$
.
2. The Screaming Toes random mapping
We turn now to the Screaming Toes setting. Label the players
 $1, 2, \ldots, n$
, and suppose player i looks at the feet of player
 $B_i$
. Because players choose whose feet to look at randomly, subject to not looking at their own, we see that the
 $B_i$
are independent, but no longer identically distributed:
 \begin{equation} \mathbb{P}(B_i = j) = 1/(n-1), \qquad j \in [n]\setminus \{i\}.\end{equation}
We form components by iteration, just as in the standard case; components now describe how the players are looking at each other. The cycles in the core of the mapping indicate sets of players, say
 $i_1, \ldots,i_r$
, for which
 $i_1 \to i_2 \to \cdots \to i_r \to i_1$
(where
 $\to$
denotes ‘looks at the feet of’), and the trees attached to any of the cyclic elements describe the sets of players who look from one to another, and finally to someone in a cycle. Each component has a single cycle, so that the number of components is the number of cycles in the core, and each cycle must have length at least two. The core of the mapping can have no cycles of length 1, and there are
 $p(n) = (n-1)^n$
such mappings. Figure 1 provides an illustration.
We study the cycles in the core and the structure of the components of the Screaming Toes mapping. We find the probability (18) that there are k screaming pairs (for
 $k = 1, 2, \ldots, \lfloor n/2 \rfloor)$
, identify the structure of the random mapping itself, and derive some basic properties of the component sizes.
Note that the resulting combinatorial structure is not the same as a random mapping conditioned on having no singleton components, because such a conditioned structure may still have singleton cycles in its core; rather, the core of a Screaming Toes mapping is a derangement. We denote by
 $D_j(n)$
the number of components of size j, and
 $D_j^*(n)$
the number of cycles of length j in the core.
2.1. The distribution of the component sizes
We adopt the general approach from [Reference Arratia, Barbour and Tavaré2, Chapter 2]. A component of size
 $i \geq 2$
has
 $j = 2, 3, \ldots, i$
elements in its core. A straightforward modification of the counting argument given in [Reference Bollobás3, Theorem 14.33 and Lemma 5.17] that leads to (2) then shows that the number of components of size i is given by
 \begin{equation*}\widetilde{m}_i \;:\!=\; \sum_{j\;=\;2}^i \genfrac(){0pt}{}{i}{j}\, (j-1)! \, j i^{i-j-1} = (i-1)! \sum_{j = 2}^i \frac{i^{i-j}}{(i-j)!} .\end{equation*}
It follows that, for
 $i \geq 2$
,
 \begin{equation*}\widetilde{m}_i = (i-1)! \, \mathrm{e}^i \, \sum_{l=0}^{i-2} \frac{\mathrm{e}^{-i} i^l}{l!} = (i-1)! \, \mathrm{e}^i \, \mathbb{P}(\textrm{Po}(i) < i-1).\end{equation*}
The joint law of
 $(D_2(n),\ldots,D_n(n))$
is therefore given by
 \begin{equation}\mathbb{P}(D_j(n) = a_j, j\;=\;2,\ldots,n) = \textbf{1}\left\{\sum_{j\;=\;2}^n j a_j = n\right\}\,\frac{x^{-n} n!}{(n-1)^n}\,\prod_{j\;=\;2}^n \left(\frac{\widetilde{m}_j x^j}{j!}\right)^{a_j} \frac{1}{a_j!} \end{equation}
for any
 $x > 0$
. Since the distribution in (8) is independent of x, we are free to choose it and we make the choice
 $x = \mathrm{e}^{-1}$
, which results in the structure being logarithmic in the terminology of [Reference Arratia, Barbour and Tavaré2, p. 51]. We therefore define
 \begin{equation}\widetilde{\lambda}_j = \frac{\widetilde{m}_j \mathrm{e}^{-j}}{j!} = \frac{1}{j}\,\mathbb{P}(\textrm{Po}(j) < j-1), \qquad j\;=\;2,3,\ldots ,\end{equation}
which should be compared to (2). The probability that a mapping of size n has a single component is
 \begin{equation*}\widetilde{s}_n = \mathbb{P}(D_n(n) = 1) = \frac{\mathrm{e}^n n!}{(n-1)^n}\,\widetilde{\lambda}_n,\end{equation*}
and
 $\widetilde{s}_n \sim \mathrm{e} \sqrt\frac{\pi}{2}\,n^{-1/2} \approx 3.4069\, n^{-1/2}$
,
 $n \to \infty$
.
2.1.1. Moments
The falling factorial moments of the component counts are readily calculated from (8), to obtain
 \begin{equation}\mathbb{E}(D_2^{[r_2]} \cdots D_b^{[r_b]}) = \widetilde{\lambda}_2^{r_2} \cdots \widetilde{\lambda}_b^{r_b} \,\mathrm{e}^m n_{[m]} \frac{(n-m-1)^{n-m}}{(n-1)^n} \end{equation}
for
 $r_2, \ldots,r_b \geq 0$
satisfying
 $m = 2r_2 + \cdots + b r_b \leq n$
. It follows that, for
 $ j = 2,3,\ldots,n$
,
 \begin{equation}\mathbb{E} D_j(n) = \widetilde{\lambda}_j\, \mathrm{e}^j\, n_{[j]} \frac{(n-j-1)^{n-j}}{(n-1)^n} = \widetilde{s}_j \binom{n}{j} \left(\frac{j-1}{n-1}\right)^j\, \left( 1 - \frac{j}{n-1}\right)^{n-j}, \end{equation}
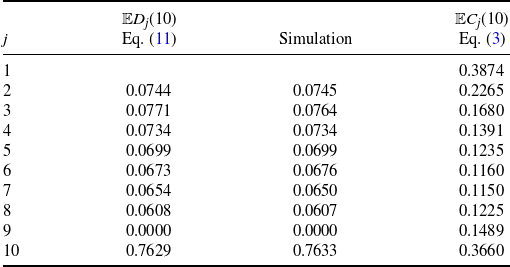
which also admits a simple probabilistic justification. A numerical example is given in Table 3. The covariances may be found from (10): for
 $i+j \leq n$
,
 \begin{equation*}\mathbb{E} D_i(n) D_j(n) = \widetilde{s}_i \widetilde{s}_j \binom{n}{i,j} \left(\frac{i-1}{n-1}\right)^i \left(\frac{j-1}{n-1}\right)^j \left(1 - \frac{i+j}{n-1}\right)^{n-i-j},\end{equation*}
the value being 0 when
 $i+j > n$
. The expected value of the number of components
 $\widetilde{K}_n = D_2(n) + \cdots + D_n(n)$
is
 \begin{equation} \mathbb{E} \widetilde{K}_n = \sum_{j\;=\;2}^n \widetilde{\lambda}_j\, \mathrm{e}^j \, n_{[j]} \frac{(n-j-1)^{n-j}}{(n-1)^n}.\end{equation}
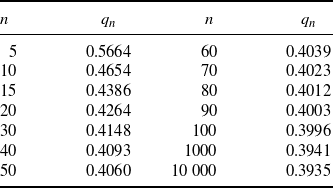
The probability
 $q_n$
from (23) of at least one screaming pair for various values of n.

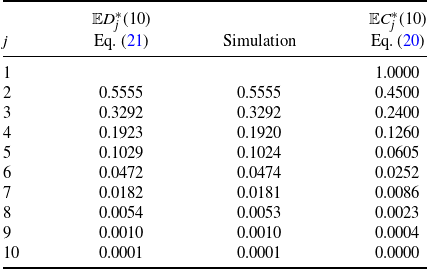
Mean number of components of sizes 1(1)10 for
 $n = 10$
for the Screaming Toes mapping, simulated values from
 $10^6$
realisations using the method in Section 4.1, and the corresponding means for a standard mapping.

2.1.2. Limit distributions
Following [Reference Arratia, Barbour and Tavaré2, p.48], the joint law of an assembly such as the Screaming Toes mapping
 $(D_2(n),\ldots,D_n(n))$
may also be represented as that of
 $(\widetilde{Z}_2,\ldots,\widetilde{Z}_n)$
conditional on
 \begin{equation}T_{1n} \;:\!=\; 2\widetilde{Z}_2 + 3 \widetilde{Z}_3 + \cdots + n\widetilde{Z}_n = n,\end{equation}
where the
 $\widetilde{Z}_i$
are independent Poisson random variables with
 $\mathbb{E} \widetilde{Z}_j = \widetilde{\lambda}_j$
,
 $j \geq 2$
, given in (9), and it follows from [Reference Arratia, Barbour and Tavaré2, Chapter 3], or directly from (10), that the counts of small components have, asymptotically, independent Poisson distributions with means
 $\mathbb{E} \widetilde{Z}_j$
given above.
3. The core of the Screaming Toes mapping
The core of our mapping is composed of derangements, permutations with no fixed points. We use
 $^\prime$
to denote derangements, so that
 $D_j^\prime(n)$
is the number of cycles of length j in a random uniform derangement of size n. We write
 \begin{equation*}d_n \;:\!=\; n! \sum_{j\;=\;0}^n \frac{(-1)^j}{j!}\end{equation*}
to denote the number of derangements of n objects; the probability that a random permutation is a derangement is
 $\mathbb{P}(C_1(n) = 0) = d_n / n!$
.
We record two results for future use:
 \begin{equation}\mathbb{E} D_j^\prime(n) = \frac{1}{j} \frac{n!}{d_n} \frac{d_{n-j}}{(n-j)!}, \qquad j = 2,3,\ldots,n , \end{equation}
and, for a random permutation of r elements,
 \begin{equation}\mathbb{P}(C_1(r) = 0, C_2(r) = k) = \left(\frac{1}{2}\right)^k \frac{1}{k!} \sum_{l = 0}^{\lfloor r/2 \rfloor - k} (-1)^{l} \left(\frac{1}{2}\right)^{l}\frac{1}{l!} \frac{d_{r - 2 l -2k}}{(r - 2 l-2k)!}.\end{equation}
The result in (15) follows, for example, from [Reference Arratia, Barbour and Tavaré2, (1.9)], and the well-known (14) is derived in the context of
 $\theta$
-biased random derangements (with
 $\theta = 1$
) in [Reference da Silva, Jamshidpey and Tavaré6].
In the next section we look in more detail at the cycles in the core of the mapping. In particular, we find in Theorem 1 the distribution of the number
 $D_2^*(n)$
of 2-cycles in the core; this provides the answer to our original problem, since
 $q_n = \mathbb{P}(D_2^*(n) > 0)$
.
3.1. The number of 2-cycles in the core
We begin with some properties of the number
 $N_n$
of elements in the core of a standard random mapping. If we define
 $\pi_k = \prod_{l=0}^{k} \left( 1-\frac{l}{n}\right) = (n-1)_{[k]}/n^k$
, then
 $n \pi_k = (n-k) \pi_{k-1}$
for
 $k = 1, 2, \ldots, n-1$
. Hence,
 $\pi_{k-1} - \pi_k = k\pi_{k-1}/n$
, and it follows from (4) that, for
 $j = 1, 2, \ldots, n,$
 \begin{equation}\mathbb{P}(N_n \geq j) = \sum_{k=j}^n \frac{k \pi_{k-1}}{n} = \sum_{k=j}^n (\pi_{k-1} - \pi_k) = \pi_{j-1} - \pi_n = \pi_{j-1}.\end{equation}
To find the distribution of the number
 $D_2^*(n)$
we make use of the following result.
Lemma 1. For any
 $n \geq 2$
and
 $m = 1,2,\ldots,n$
,
 \begin{equation}\left(\frac{n}{n-1}\right)^n \,\sum_{r = m}^n \frac{r}{n} \frac{n_{[r]}}{n^r} \frac{d_{r - m}}{(r - m)!} = \frac{n_{[m]}}{ (n-1)^{m}} .\end{equation}
Proof. We have
 \begin{alignat*}{2}\sum_{r = m}^n \frac{r}{n} \frac{n_{[r]}}{n^r} \frac{d_{r-m}}{(r-m)!} & = \sum_{r = m}^n \frac{r}{n} \frac{n_{[r]}}{n^r} \sum_{j = 0}^{r-m} \frac{(-1)^j}{j!} & & \\& = \sum_{j\;=\;0}^{n-m} \frac{(-1)^j}{j!} \, \sum_{r = m+j}^n \frac{r}{n} \frac{n_{[r]}}{n^r} & & \\& = \sum_{j\;=\;0}^{n-m} \frac{(-1)^j}{j!} \,\mathbb{P}(N_n \geq m+j) \qquad & \textrm{ from } & ({4}) \\& = \sum_{j\;=\;0}^{n-m} \frac{(-1)^j}{j!} \,\frac{n_{[m+j]}}{n^{m+j}} & \textrm{ from } & ({16}) \\& = \frac{n_{[m]}}{n^m} \, \sum_{j\;=\;0}^{n-m} \frac{(-1)^j}{j!}\,\frac{(n-m)!}{(n-m-j)!}\frac{1}{n^j} & & \\& = \frac{n_{[m]}}{n^m} \,\sum_{j\;=\;0}^{n-m} \genfrac(){0pt}{}{n-m}{n-m-j} \left(-\frac{1}{n}\right)^j & & \\& = \frac{n_{[m]}}{n^m} \left(1 - \frac{1}{n}\right)^{n-m} . & &\end{alignat*}
It follows that the left-hand side of (17) is
 \begin{equation*}\left(\frac{n}{n-1}\right)^n \, \frac{n_{[m]}}{n^m} \left(\frac{n-1}{n}\right)^{n-m} = \frac{n_{[m]}}{(n-1)^m},\end{equation*}
which establishes Lemma 1.
Theorem 1. For
 $k=0,1,\ldots,\lfloor n/2 \rfloor,$
 \begin{equation}\mathbb{P}(D_2^*(n) = k) = \left(\frac{1}{2}\right)^k \frac{1}{k!} \sum_{l = 0}^{\lfloor n/2\rfloor - k} (-1)^l \left(\frac{1}{2}\right)^l \frac{1}{l!}\,\frac{n_{[2l+2k]}}{(n-1)^{2l + 2k}}.\end{equation}
Proof. Let
 $\widetilde{N}_n$
be the number of elements in the core of a Screaming Toes mapping. Its distribution may be found by considering the number of elements
 $N_n$
in the core of a standard random mapping and conditioning on it having no fixed points in its core; the probability of this event is
 $(1 - 1/n)^n$
. Since
 $\widetilde{N}_n = r$
if
 $N_n = r$
and the r elements are a derangement, we have
 \begin{equation} \mathbb{P}(\widetilde{N}_n = r) = \mathbb{P}(N_n = r) \frac{d_r}{r!} \big/ \left( \frac{n-1}{n}\right)^n = \left(\frac{n}{n-1}\right)^n \frac{r}{n} \frac{n_{[r]}}{n^r} \frac{d_r}{r!}, \quad r = 2, 3, \ldots,n. \end{equation}
The law of the number of 2-cycles in the core is therefore given by
 \begin{equation*}\mathbb{P}(D_2^*(n) = k) =\sum_{r=2k}^n \mathbb{P}(\widetilde{N}_n = r) \times \mathbb{P}(\textrm{random derangement of size }r\textrm{ has }k \textrm{ 2-cycles}).\end{equation*}
Noting that
 $\mathbb{P}(\textrm{random derangement of size }r\textrm{ has }k \textrm{ 2-cycles}) = \mathbb{P}(C_2(r) = k \mid C_1(r) = 0)$
and using (15), we obtain, after some simplification,
 \begin{align*}\mathbb{P}(D_2^*(n) = k) & = \left(\frac{n}{n-1}\right)^n \frac{2^{-k}}{k!}\, \sum_{r=2 k}^n \frac{r}{n} \frac{n_{[r]}}{n^r}\, \sum_{l = 0}^{\lfloor r/2 \rfloor - k} (-1)^{l} \left(\frac{1}{2}\right)^{l}\frac{1}{l!}\, \frac{d_{r - 2 l -2k}}{(r - 2 l-2k)!} \\& = \frac{2^{-k}}{k!}\,\sum_{l = 0}^{\lfloor n/2 \rfloor - k} (-1)^{l} \left(\frac{1}{2}\right)^{l}\frac{1}{l!} \left(\frac{n}{n-1}\right)^n \sum_{r=2l+2k}^n \frac{r}{n} \frac{n_{[r]}}{n^r} \frac{d_{r - 2 l -2k}}{(r - 2 l-2k)!}.\end{align*}
The right-most sum on the last line reduces to
 $n_{[2l+2k]}/(n-1)^{2l + 2k}$
by using the identity in (17), completing the proof.
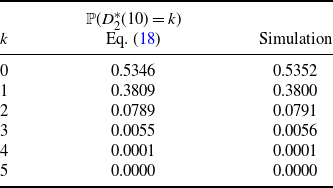
A numerical example is given in Table 4.


3.1.1. Expected number of cycles of length j
It is well known that the expected number of cycles of length j in a standard random mapping core is
 \begin{equation}\mathbb{E} C_j^*(n) = \sum_{r = j}^n \frac{r}{n} \frac{n_{[r]}}{n^r} \frac{1}{j} = \frac{1}{j} \mathbb{P}(N_n \geq j) = \frac{1}{j} \frac{n_{[j]}}{n^j}, \qquad j\;=\;1,\ldots,n;\end{equation}
see (16) for the last step. For the Screaming Toes mapping, the expected number of cycles of length j is, from (14) and (19),
 \begin{align}\mathbb{E} D_j^*(n) & = \left(\frac{n}{n-1}\right)^n\, \sum_{r = j}^n \frac{r}{n} \frac{n_{[r]}}{n^r} \frac{d_r}{r!}\, \frac{1}{j} \frac{r!}{d_r}\frac{d_{r-j}}{(r-j)!} \nonumber \\& = \left(\frac{n}{n-1}\right)^n\, \frac{1}{j} \sum_{r = j}^n \frac{r}{n} \frac{n_{[r]}}{n^r} \frac{d_{r-j}}{(r-j)!} \nonumber \\& = \frac{1}{j} \frac{n_{[j]}}{(n-1)^j}, \end{align}
the final equality coming from (17). Some numerical values are given in Table 5.
Mean number of cycles of sizes 1(1)10 in the core for
 $n = 10$
for the Screaming Toes mapping, simulated values from
 $10^6$
realisations of the method in Section 4.3, and the corresponding means for a typical random mapping.

Remark 1. Since the number of components is equal to the number of cycles in the core,
 $\mathbb{E} \widetilde{K}_n$
may also be computed from (21), to obtain
 \begin{equation}\mathbb{E} \widetilde{K}_n = \sum_{j\;=\;2}^n \frac{1}{j} \frac{n_{[j]}}{(n-1)^j},\end{equation}
which should be compared to (12). The equivalence of (12) and (22) is illustrated for the case of
 $n = 10$
in Tables 3 and 5.
3.2. Did anyone scream?
Cameron’s original problem was to show that the probability that someone screams is
 \begin{equation}q_n \;:\!=\; \sum_{l = 1} ^ {\lfloor n/2 \rfloor} \frac{(-1)^{l-1} n_{[2l]}}{2^l l! (n-1)^{2l}},\end{equation}
and to find the limiting behaviour of
 $q_n$
as
 $n \to \infty$
. We can identify
 $q_n$
because
 $\mathbb{P}(\textrm{someone screams}) = 1 - \mathbb{P}(D_2^*(n) = 0)$
, so, from Lemma 3.1,
 \begin{equation*}q_n = \mathbb{P}(D_2^*(n) > 0) = \sum_{l = 0}^{\lfloor n/2\rfloor} (-1)^{l-1} \left(\frac{1}{2}\right)^l \frac{1}{l!} \,\frac{n_{[2l]}}{(n-1)^{2l}},\end{equation*}
recovering (23). Representative values of
 $q_n$
are given in Table 2.
Finally, a word about the limiting value of
 $q_n$
. From Theorem 1,
 $D_2^*(n)$
converges in distribution to a Poisson random variable with mean
 $\frac{1}{2}$
. In particular,
 $\lim_{n \to \infty} q_n = 1 - \mathbb{P}(\textrm{Po}\big(\frac{1}{2}\big) = 0) = 1 - \mathrm{e}^{-1/2} \approx 0.3935$
.
4. Simulating the component counts
It is often useful to be able to simulate combinatorial objects, for example to study the distributions of cycle lengths and component sizes for moderate values of n, where the asymptotics might not be good, or when asking more detailed questions where explicit answers are hard to come by. In our setting, there are (at least) two approaches to this.
4.1 A rejection method
The first is useful for studying the component counting process
 $(D_2(n),\ldots,D_n(n))$
, by exploiting a modification of the simulation approach in [Reference Arratia, Barbour, Ewens and Tavaré1, Section 4]. For any
 $\theta > 0$
, (8) gives the distribution of
 $(D_2(n),\ldots,D_n(n))$
as
 \begin{align*}\mathbb{P}(D_j(n) = a_j, j\;=\;2,\ldots,n) & \propto \textbf{1}\Bigg\{ \sum_{j\;=\;2}^n j a_j = n\Bigg\}\, \prod_{j\;=\;2}^n \left(\frac{\omega_j}{j}\right) ^{a_j} \frac{1}{a_j!} \nonumber \\& = \textbf{1}\Bigg\{ \sum_{j\;=\;2}^n j a_j = n\Bigg\}\, \prod_{j\;=\;2}^n \left(\frac{\omega_j}{\theta}\right)^{a_j}\, \prod_{j\;=\;2}^n \left(\frac{\theta}{j}\right)^{a_j} \frac{1}{a_j!} \nonumber \\& = \prod_{j\;=\;2}^n \left(\frac{\omega_j}{\theta}\right)^{a_j}\, \textbf{1}\Bigg\{ \sum_{j\;=\;2}^n j a_j = n\Bigg\}\,\prod_{j\;=\;2}^n \left(\frac{\theta}{j}\right)^{a_j} \frac{1}{a_j!},\end{align*}
where
 $\omega_j = j \widetilde{\lambda}_j = \mathbb{P}(\textrm{Po}(j) < j-1)$
is given by (9). We note that
 $\omega_j \leq \theta = \frac{1}{2}$
for
 $j = 2, 3, \ldots$
. The last factorisation shows that if we simulate
 $(a_2,\ldots,a_n)$
from the distribution
 \begin{equation}\mathbb{P}_\theta(a_2,\ldots,a_n) \propto \textbf{1}\Bigg\{ \sum_{j\;=\;2}^n j a_j = n\Bigg\}\,\prod_{j\;=\;2}^n \left(\frac{\theta}{j}\right)^{a_j} \frac{1}{a_j!}\end{equation}
and accept
 $(a_2,a_3,\ldots,a_n)$
with probability
 $h(a_2,\ldots, a_n) = \prod_{j\;=\;2}^n \left( \frac{\omega_j}{\theta} \right)^{a_j}$
, then the accepted values have the distribution of
 $(D_2(n),\ldots,D_n(n))$
.
The method relies on efficient simulation from the distribution in (24), which gives the probability of observing
 $a_j$
cycles of size j,
 $j = 2, 3, \ldots, n$
, under the Ewens sampling formula [Reference Ewens8] with parameter
 $\theta$
, conditional on observing no cycles of length 1. For more information on this law in the context of
 $\theta$
-biased derangements, see [Reference da Silva, Jamshidpey and Tavaré6].
We implement the algorithm in a slightly different way, by simulating
 $(a_1,\ldots,a_n)$
from the regular Ewens sampling formula with parameter
 $\theta = \frac{1}{2}$
, and accepting
 $(a_2,\ldots,a_n)$
with probability
 \begin{equation}h(a_1, a_2,\ldots, a_n) = \textbf{1}(a_1 = 0) \prod_{j\;=\;2}^n \left( \frac{\omega_j}{\theta} \right)^{a_j}.\end{equation}
There are many ways to generate observations from the Ewens sampling formula with an arbitrary parameter
 $\theta$
, for example by using the Chinese restaurant process or the Feller coupling; we exploit the latter, and point the reader to the discussion in [Reference Arratia, Barbour, Ewens and Tavaré1] about the relative efficiency of these methods.
4.2. Estimating the acceptance probability
To compute the asymptotic acceptance probability, we note that
 \begin{equation*}\mathbb{P}(\mbox{accept an observation}) = \mathbb{E} \Bigg( \textbf{1}(C_1(n) = 0)\, \prod_{j\;=\;2}^n ( 2 \omega_j)^{C_j(n)} \Bigg),\end{equation*}
where
 $(C_1(n),\ldots,C_n(n))$
has the Ewens sampling formula with parameter
 $\theta = \frac{1}{2}$
. The Poisson limit heuristic shows that this is asymptotically
 \begin{align}\mathrm{e}^{-1/2}\,\prod_{j\;=\;2}^\infty \mathbb{E} (2\omega_j)^{Z_j}& = \mathrm{e}^{-1/2}\, \prod_{j\;=\;2}^\infty \exp\left( - \frac{1}{2j} \left( 1 - 2\omega_j \right) \right) \nonumber \\& = \mathrm{e}^{- 1/2}\, \exp \Bigg( - \sum_{j = 2}^\infty \frac{1}{j} \left(\frac{1}{2} - \mathbb{P}(\textrm{Po}(j) < j-1)\right)\Bigg) = \frac{1}{\mathrm{e}} \,\frac{1}{\sqrt{2}\,}, \end{align}
the last result following because the algorithm is effectively generating a standard random mapping, and accepting that mapping if its core is a derangement; from (19), this asymptotically has probability
 $\frac{1}{e}$
. In
 $10^6$
simulations of the case
 $n = 10$
the acceptance rate was estimated to be 0.247, in reasonable agreement with the limiting value of approximately 0.260 from (26).
Remark 2. There is an appealing connection between the exponent in the right-hand term in (26),
 \begin{equation}\sum_{j = 2}^\infty \frac{1}{j} \left(\frac{1}{2} - \mathbb{P}(\textrm{Po}(j) < j-1)\right) ,\end{equation}
and Spitzer’s theorem [Reference Spitzer12], which is described in detail in [Reference Feller9, Theorem 1, p. 612]. This may be used to evaluate the corresponding value for a standard mapping,
 \begin{equation*}\sum_{j = 1}^\infty \frac{1}{j} \left(\frac{1}{2} - \mathbb{P}(\textrm{Po}(j) < j)\right) = \frac{1}{2} \log 2,\end{equation*}
as given for example in [Reference Arratia, Barbour, Ewens and Tavaré1, (19)] and [Reference Donnelly, Ewens and Padmadisastra7]. It follows that (27) is
 \begin{align} \frac{1}{2} \log 2 -\left(\frac{1}{2} - \frac{1}{\mathrm{e}}\right) + \sum_{j\;=\;2}^\infty \frac{1}{j} \mathbb{P}(\textrm{Po}(j)=j-1) & = \frac{1}{2} \log 2 -\left(\frac{1}{2} - \frac{1}{\mathrm{e}}\right) + 1 - \frac{1}{\mathrm{e}} \nonumber \\ & = \frac{1}{2} (1 + \log 2), \end{align}
the sum being the probability that a random variable having a Borel distribution with parameter 1 is at least 2. This provides the formal justification of (26).
4.3. Simulating component and core sizes
A rejection method can be used to study details of the cycle sizes in the core of a mapping, by generating an observation r from the distribution of
 $\widetilde{N}_n$
in (19), and then generating a random derangement of size r. While we do not illustrate this approach here, see [Reference da Silva, Jamshidpey and Tavaré6] for efficient methods for generating
 $\theta$
-biased derangements.
The second approach simulates a random mapping with no singleton cycles in its core, as determined by the random variables in (7), and processes the output using (for example) the
 $\textrm{R}$
igraph package [Reference Csardi and Nepusz5] to compute the component and core sizes. This provides a computationally cheap way to check the first approach, and provides a way to study aspects of the joint law of component and cycle sizes.
4.4. Examples
Here we illustrate some of the explicit results obtained above, and their corresponding simulated values, all in the setting of
 $n = 10$
. Table 3 compares the mean number of components for the Screaming Toes mapping with the corresponding values for the regular mapping. The mean number of components is 1.251 for the Screaming Toes mapping, and 1.913 for the standard mapping.
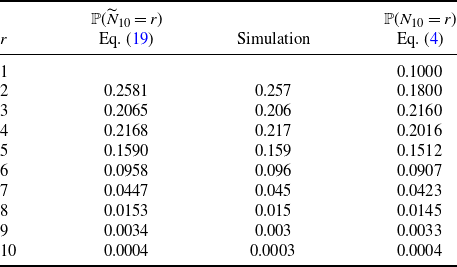
Table 4 illustrates the distribution of the number of screaming pairs, while Table 5 compares the mean cycle counts for the Screaming Toes core, and the corresponding values for the standard core. The mean number of cycles is 1.251 for the Screaming Toes mapping, and 1.913 for the standard mapping, the former in agreement with the results in (12) and (22). Table 6 illustrates the distribution of the number of elements in the core.
Probability distribution of the number of elements in the core for
 $n = 10$
for the Screaming Toes mapping, simulated values from
 $10^6$
realisations of the method in Section 4.3, and the corresponding probabilities for a typical random mapping.

As a final example, we estimate, from
 $10^6$
realisations of the simulation method in Section 4.3, the probability that the Screaming Toes mapping with
 $n = 10$
has no repeated component sizes to be 0.959, no repeated cycle sizes to be 0.898, and no repeated component or cycle sizes to be 0.879.
5. Discussion
This paper has focused on the small components and cycles of the Screaming Toes mapping because that is where the main differences from the standard case emerge. We noted before (9) that the Screaming Toes mapping is logarithmic, in that the Poisson random variables in (13) satisfy
 $i \mathbb{P}(Z_i = 1) \to \frac{1}{2}$
and
 $i \mathbb{E} Z_i \to \frac{1}{2}$
as
 $i \to \infty$
, this following from (9). As a consequence (see [Reference Arratia, Barbour and Tavaré2, Chapter 6]), the largest component sizes, when scaled by n, have asymptotically the Poisson–Dirichlet law with parameter
 $\theta = \frac{1}{2}$
, just as in a standard mapping. In a similar vein, the largest cycle lengths, when scaled by
 $\widetilde{N}_n$
, have asymptotically the Poisson–Dirichlet distribution with parameter
 $\theta = 1$
, once more just as for the standard mapping core.
Acknowledgements
I thank John Kingman for comments that led to the evaluation in (28), and two anonymous reviewers for comments that clarified the exposition.
Funding Information
There are no funding bodies to thank relating to the creation of this article.
Competing Interrests
There were no competing interests to declare which arose during the preparation or publication process of this article.
Data
R code for performing the computations described in the paper may be obtained from the author.