INTRODUCTION
Feed accounts for 0·7 of total variable costs on Irish cattle farms (Hennessy et al. Reference Hennessy, Kinsella, Moran and Quinlan2012); therefore reducing feed costs is a critical factor for improving farm profitability. One approach to reducing the cost of feeding cattle is through optimization of compensatory growth, a physiological process whereby an animal has a period of accelerated growth following a period of reduced growth, resulting in a similar live weight to that of an animal that never experienced a growth reduction (Hornick et al. Reference Hornick, Van Eenaeme, Gérard, Dufrasne and Istasse2000). This period of reduced growth is caused by reduced feed energy intake. In Ireland, 0·67 of calves from Holstein–Friesian dairy cows are born between the months of February and April (spring; AIM 2012). During the calf-rearing phase, animals consume a diet of milk replacer, concentrate and straw for 8 weeks and then graze grass until the end of the first summer grazing period (October). For the remainder of the year (November–February) animals are housed and consume a diet of grass silage and supplementary concentrates (first winter feeding period). The animals then have a second grazing period (March–October) and second winter period, during which some animals are finished. The remaining animals are finished during the third grazing period. This cycle of grazing from early spring to late autumn and indoors for the remainder of the year reflects the seasonality of grass production in Ireland (Drennan et al. Reference Drennan, Carson, Crosse and Murphy2005).
Exploitation of compensatory growth means animals have a restricted live weight gain (LWG) over the winter feeding period and subsequent accelerated growth during the summer grazing period (Wright et al. Reference Wright, Russel and Hunter1989) while grazing high nutritive value and lower cost pasture (Finneran et al. Reference Finneran, Crosson, O'kiely, Shalloo, Forristal and Wallace2012). Owing to the potential feed cost savings of compensatory growth when exploited during periods of cheaper feed use there have been a number of studies carried out to quantify the effect of the level and duration of nutrient restriction on subsequent compensatory growth (e.g. Drennan Reference Drennan1979; Wright et al. Reference Wright, Russel and Hunter1989; Drouillard et al. Reference Drouillard, Ferrell, Klopfenstein and Britton1991; Keane & Drennan Reference Keane and Drennan1994; Sainz et al. Reference Sainz, De La Torre and Oltjen1995; Hornick et al. Reference Hornick, Van Eenaeme, Clinquart, Diez and Istasse1998). Typical of these studies was the inverse relationship found by Keane & Drennan (Reference Keane and Drennan1994) such that as LWG during the restriction period increased from 311 to 893 g/day, LWG during the compensation period decreased from 908 to 470 g/day.
A number of models which incorporate the capacity to simulate compensatory growth have been developed for cattle (Hoch & Agabriel Reference Hoch and Agabriel2004; Nielsen et al. Reference Nielsen, Kristensen and Thamsborg2004). Nielsen et al. (Reference Nielsen, Kristensen and Thamsborg2004) described a model of organic steer production which accounted for compensatory growth; however, this model was based at an individual animal level and not a farm level and therefore did not permit a whole-farm economic evaluation. Hoch & Agabriel (Reference Hoch and Agabriel2004) described a mechanistic model of growth and body composition that modelled compensatory growth, but a large number of parameters, many of which are difficult to obtain, are required to run the model. There are very few farm system models looking at compensatory growth in temperate grassland regions, such as Ireland, where it can be used to simulate the use of cheaper seasonal feeds such as grazed grass. Although the focus is on temperate grassland regions, the principles apply to any region or cattle production system where compensatory growth forms part of the production strategy. The current paper contributes uniquely to the literature by incorporating compensatory growth into a holistic farm systems model (Ashfield et al. Reference Ashfield, Crosson and Wallace2013) that simulates different finishing ages and feeding systems.
The objectives of the current study were twofold. The first was to describe modifications made to the Grange Dairy Beef Systems Model (GDBSM) to simulate compensatory growth more accurately than the original model described by Ashfield et al. (Reference Ashfield, Crosson and Wallace2013). The second objective was to use the model to determine the effect of different LWGs during a restriction period on the profitability of dairy calf-to-steer beef cattle systems.
MATERIALS AND METHODS
Model description
The GDBSM is a whole-farm, single year, static, deterministic simulation model that facilitates the technical and economic evaluation of dairy calf-to-beef production systems. The model is described in detail by Ashfield et al. (Reference Ashfield, Crosson and Wallace2013) and so is only summarized here. It is an empirical model that uses data from production research experiments, conducted primarily at the Animal and Grassland Research and Innovation Centre, Teagasc, Grange, Ireland to specify coefficients and production functions (e.g. grazed grass dry matter (DM) digestibility and energy content, LWG and the proportion of grazed grass and grass silage in the diet). A number of key assumptions underpin model operation. First, the farm land area owned and the cattle production system choices (e.g. animal breed, gender and age at slaughter) must be specified. Production systems modelled are based on three breed groups, which represent the progeny of Holstein–Friesian dairy cows that are bred to late-maturing (LM; Charolais and Belgian Blue cattle breeds), early maturing (EM; Aberdeen Angus and Hereford cattle breeds) and Holstein–Friesian sires. Within these three breed groups, male cattle can be produced as bulls or steers. Heifer finishing options are also included. In the scenarios modelled in the current paper, since the primary focus is on the impact of different growth strategies on farm economic performance rather than on production systems, only steer production systems are simulated. The model incorporates a range of finishing ages within each breed and gender. For steers the finishing age ranges from 20 months for EM to 30 months for Holstein–Friesian and LM animals. The finishing age for bulls ranges from 15 to 18 months of age for all breeds. Heifers can be finished from 18 months for EM to 22 months of age for LM animals. The user must also define the forage system in terms of inorganic nitrogen (N) applied to the grazing area and number of grass silage harvests (one or two). Inorganic N application rates for grass silage production are set according to Teagasc recommendations (Coulter & Lalor Reference Coulter and Lalor2008). The model consists of four sub-models comprising farm systems, animal nutrition, feed supply and financial components.
The farm systems sub-model defines the dairy calf-to-beef production system and calculates, on a monthly basis, animal inventories, mean live weight of the various animal groups (no variation within groups is accounted for by the model), slurry production and accommodation for animals during the indoor period. Animal numbers are calculated at the start of the month based on animal mortality, sales, purchases and movements into different groups from the previous month. Animal live weights are calculated at the start of each month based on the starting live weight and LWG from the previous month. The amount of slurry produced during the indoor period is based on the volume of slurry produced per animal per day (DAF 2000) and the number of days spent indoors.
The animal nutrition sub-model determines energy demand and animal feed requirements (grazed grass, grass silage and concentrate) on a monthly basis. The animal nutrition sub-model is ‘animal driven’ rather than ‘feed driven’ and, thus, animal requirements (energy demand) are specified and diets must be determined to meet this requirement. Energy demand, estimated from the INRAtion program (INRAtion 3.22; INRA 2003) adapted for Irish conditions (O'Mara et al. Reference O'mara, Caffrey and Drennan1997; Crowley et al. Reference Crowley, Keane, Agabriel and O'MARA2002), is a function of live weight and LWG of the animal. The net energy demand for a particular breed and gender of an animal for a set of LWG was calculated by regressing live weight against energy demand (multiple linear regression; VSN international 2011). The energy requirements of growing animals are specified in Feed Units for lactation (UFLs; the same units are used for lactating and growing animals); one UFL is the net energy content of 1 kg of standard barley for milk production, 7·1 MJ (Jarrige Reference Jarrige1989) and the energy requirements of finishing animals are specified in Feed Units for maintenance and meat production Unite Forragere Viande (UFV); one UFV is the net energy content of 1 kg of standard barley for meat production, 7·6 MJ (Jarrige Reference Jarrige1989). Energy demand is used to calculate the feed DM requirements that are also subject to the maximum intake capacity (IC) of the animal. The IC is calculated according to equations derived by A.M. Crowley (unpublished) and is specified in terms of Fill Units for cattle (CFU; Jarrige Reference Jarrige1989). Available feeds (grazed grass, grass silage and concentrate) are also specified in terms of these parameters (UFL or UFV/kg DM and CFU/kg DM) hence, required intake is calculated. Where the quantity of forage required to satisfy energy demand exceeds the animals’ IC, then: (1) forage quantity is fed at the maximum level possible as determined by the animals’ IC and (2) supplementary concentrate is fed to meet the energy deficit. Substitution rate of forage is estimated using the ‘apparent fill’ method outlined by Jarrige (Reference Jarrige1989).
The feed supply sub-model determines the forage production systems used to satisfy the grazed grass and grass silage feed demand on the farm. The production of grass silage is modelled firstly and thus, the grass grazing area is calculated as the total farm area minus the total area required for grass silage in any given month. Grass silage yield data is based on cutting date for first harvest silage and regrowth period for subsequent harvests (O‘Kiely Reference O'kiely2004). Total annual grass production (t DM/ha) on the grazing area is determined by the quadratic grass growth equation of Butler (Reference Butler2006) whereby herbage production is a function of the specified N (organic and inorganic) application rate (kg/ha). Nitrogen, phosphorous (P) and potassium (K) inputs for grass silage and P and K inputs for grazing are set according to the specifications of Coulter & Lalor (Reference Coulter and Lalor2008) assuming a soil index 3 for P and K.
The financial sub-model quantifies costs and receipts generated from the system being modelled. It is linked with the farm systems, animal nutrition and feed supply sub-models to obtain quantities of inputs used and physical output (beef carcass) produced. Variable and fixed costs are calculated on a monthly basis. The model does not include imputed charges for the opportunity cost of owned land and unpaid family labour (including the farmer's own labour). Key outputs from the financial sub-model are the monthly and annual cash flow, and annual profit and loss account. All costs and margins are presented per farm, hectare, livestock unit (LU: an animal aged 0–12 months is 0·3 LU, 13–24 months is 0·7 LU and 25+ months is 1 LU), animal unit (AU: one AU equals an animal from purchase at 1 week of age to leaving the farm for slaughter) and kilogram of saleable beef carcass.
Modelling compensatory growth
Modelling live weight gain
A review of the literature appropriate to seasonal, grass-based systems of dairy beef production showed that during periods of compensatory growth animals experience an increase in LWG in the range of 15–93% (Drennan Reference Drennan1979; Keane & Drennan Reference Keane and Drennan1994) compared with control animals that are not experiencing compensatory growth. Linear regression equations derived by Keane & Drennan (Reference Keane and Drennan1994) and Keane (Reference Keane2002) were selected for use in the current study because these equations relate LWG during the restriction period to LWG during the compensation period for grass-based dairy beef cattle systems in Ireland (Table 1).
Equations used to calculate live weight gain (LWG) during the summer following a period of restricted growth during the winter

24M: LWG during the second summer grazing period (g/day) of beef cattle finished as steers at 24 months of age; 28M: LWG during the third summer grazing period (g/day) of beef cattle finished as steers at 28 months of age; 30M: LWG during the third summer grazing period (g/day) of beef cattle finished as steers at 30 months of age; LWGg: LWG (g/day) of steer beef cattle during period of restricted growth (first winter feeding period for 24M and second winter feeding period for 28M and 30M).
* Keane (Reference Keane2002).
† Keane & Drennan (Reference Keane and Drennan1994).
The equations of Keane (Reference Keane2002) are calculated from five experiments that examined the effect of growth restriction during the first winter feeding period on the subsequent LWG during the second summer grazing period (compensation period). The Keane (Reference Keane2002) equations were used in the current study for steers finished at 24 months of age in February. The nutrient restriction period (RESLWG) for these animals was during the first winter feeding period of the animals’ life (November–February). Compensatory growth occurred during the second summer grazing period, based on the equations from Keane (Reference Keane2002), which had a duration of 245 days (March–October). This is a typical grazing season length for Ireland (Mayne & O'Kiely Reference Mayne, O'kiely, Park and Stronge2005). These animals returned indoors at the end of the second grazing period (end of October) and were finished on a diet of grass silage and concentrate during which there was no further compensation in LWG (Drennan & Harte Reference Drennan and Harte1979).
Keane & Drennan (Reference Keane and Drennan1994) examined the effect of growth restriction during the second winter feeding period on the subsequent LWG during the outdoor compensation period during the third summer grazing period. These equations were used in the current study for steers finished at 28 and 30 months of age in June and August, respectively. These animals experienced two restriction and compensation periods. The first restriction period was during the first winter feeding period with the subsequent first compensation period occurring during the second grazing period. The second RESLWG period for these animals was during the second winter feeding period (November–February). This was followed by a second compensation period at pasture during the 3rd grazing period (March to when animals finished), when the LWG was calculated using the equation from Keane & Drennan (Reference Keane and Drennan1994). These animals were finished outdoors on grazed grass during the third grazing period. Animal LWG during periods, other than those when restriction or compensation occurred, were as described by Keane et al. (Reference Keane, O'riordan and O'kiely2009).
Modelling animal energy requirements
During the energy restriction period, the maintenance requirement of cattle is reduced due to reduced weight of viscera and this can be carried over into the compensation period (Ryan Reference Ryan1990; Hornick et al. Reference Hornick, Van Eenaeme, Gérard, Dufrasne and Istasse2000). A number of studies have quantified the reduction in maintenance requirements of animals exhibiting compensatory growth (Ledger & Sayers Reference Ledger and Sayers1977; Andersen Reference Andersen1980; Sainz et al. Reference Sainz, De La Torre and Oltjen1995); however, the magnitude of the reduction across reports varies from 10 to 50%. The duration of reduced maintenance during the compensation period is also poorly defined, ranging from 14 to 110 days (Thomson et al. Reference Thomson, Gingins, Blum, Bickel, Schürch and Mount1980; Ryan Reference Ryan1990; Yambayamba et al. Reference Yambayamba, Price and Foxcroft1996). For the purposes of the current study, all animals exhibiting compensatory growth had their maintenance requirements reduced by 20% for the first 90 days of the compensation period as reported by NRC (2000).
In the current study, to model the reduced maintenance requirements during the compensation period, the energy demand of growing cattle was partitioned into energy required for maintenance and the energy required for growth using the INRAtion program (INRAtion 3.22; INRA 2003). A regression equation for maintenance energy requirements was generated using Genstat version 14.1 (VSN International 2011) by regressing live weight against energy demand where LWG was zero. Similarly, a regression equation for the energy required for growth was calculated using performance data extracted from INRAtion 3.22 (INRA 2003). Therefore, total energy was determined by the energy required for maintenance equation plus the energy required for growth equation. For animals that do not experience compensation during the finishing period the energy demand remains the same as the original model described in Ashfield et al. (Reference Ashfield, Crosson and Wallace2013). During compensation animals deposit a greater amount of protein (lean meat) initially, which is followed by fat deposition (Ryan Reference Ryan1990). Therefore, the fat and conformation scores of animals finished during the compensation period were adjusted from Keane et al. (Reference Keane, O'riordan and O'kiely2009) according to the equations developed by Keane & Drennan (Reference Keane and Drennan1994) which related carcass weight to carcass fat and conformation scores.
Effects of compensatory growth on feed intake are equivocal with some or no increase reported (Ryan Reference Ryan1990; Sainz et al. Reference Sainz, De La Torre and Oltjen1995). Wright et al. (Reference Wright, Russel and Hunter1989) found that feed intake was 4 and 15% higher for animals that had a high compared with medium and low-energy intake over the winter period, respectively, on a g/kg live weight per day basis. In the current study, feed intake requirements were based on energy demand which, in turn, was modified to reflect compensatory growth effects. Therefore, higher LWG during compensation resulted in a higher energy demand and feed intake.
SCENARIO DEVELOPMENT
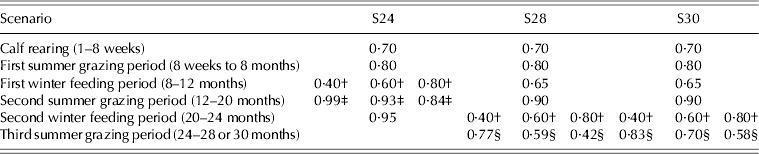
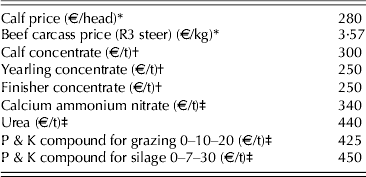
To investigate the impact of alternative growth trajectories for dairy calf-to-beef systems, scenarios based on the male progeny of Charolais sires bred to Holstein–Friesian dams and finished as steers at 24, 28 and 30 months of age were investigated. The scenarios had a number of constant features. All scenarios were based on spring-born calves arriving on farm at 1 week of age on 1 March. All calves were subjected to the same rearing regime and similar management during the first grazing season (Ashfield et al. Reference Ashfield, Crosson and Wallace2013). Housing occurred in November following which cattle were fed a diet of grass silage and concentrates (winter feeding period). Animal LWG during this period was restricted to facilitate expression of compensatory growth during the second summer grazing period. The energy and nutrient restriction period lasted for 120 days (start of November to end of February) for all scenarios because this was the length of the winter feeding period. Animal LWG for all the periods for each scenario are shown in Table 2. As the Nitrates Directive of the EU (Directive 91/676/EEC) limits organic N output to 170 kg N/ha (DAF 2008), this was the stocking intensity limit applied to all scenarios. In effect, this limits the number of animals that can be carried per hectare; animals under 12 months of age, between 12 and 24 months of age and over 24 months of age contribute 24, 57 and 65 kg of organic N per animal, respectively. Price and cost assumptions for all scenarios are shown in Table 3. Input costs are as found in CSO (2012) and O'Donovan & O'Mahony (Reference O'donovan and O'mahony2012) with beef carcass prices from Bord Bia (2012).
Live weight gains (LWGs) (kg/day) for late-maturing (LM) crossbred Holstein–Friesian steers slaughtered at 24, 28 and 30 months of age*

* Keane et al. (Reference Keane, O'riordan and O'kiely2009).
† Set by the user.
‡ Keane (Reference Keane2002).
§ Keane & Drennan (Reference Keane and Drennan1994).
Prices used in the scenarios to determine the effect of compensatory growth on profitability of dairy calf-to-beef systems
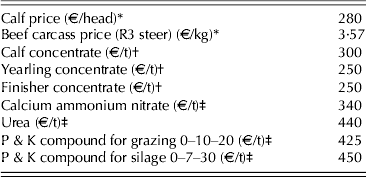
* Average beef carcass price for the year taken from Bord Bia (2012) actual monthly beef carcass price takes account of seasonal fluctuations.
† CSO (2012).
‡ O'Donovan & O'Mahony (Reference O'donovan and O'mahony2012).
The first scenario (S24) involved finishing animals at 24 months of age. The nutrient restriction period (RESLWG) for these animals was during the first winter feeding period, with the LWG set at 0·4, 0·6 or 0·8 kg/day. Compensatory growth occurred during the second grazing period based on the equations from Keane (Reference Keane2002) as described earlier. The second and third scenarios involved finishing animals at 28 (S28) and 30 (S30) months of age. These animals experienced two restriction and compensation periods. The first RESLWG period was during the first winter feeding period (LWG set at 0·65 kg/day) with the subsequent first compensation period occurring during the second grazing period (LWG set at 0·90 kg/day). The second RESLWG period for these animals was during the second winter feeding period with LWG set at 0·4, 0·6 or 0·8 kg/day. This was followed by a second compensation period during the third grazing period for 122 days (start of March to end of June) for S28 and 184 days (start of March to end of August) for S30, based on the equations of Keane (Reference Keane2002) as also described earlier.
All scenarios were subjected to sensitivity analysis of beef carcass, calf, fertilizer and concentrate prices, respectively. Owing to the equivocal information in the literature regarding the level and duration of maintenance reduction during the restriction period, maintenance reduction was varied from 10 to 30% and duration from 30 to 120 days to quantify the effect on profitability of the alternative systems.
RESULTS
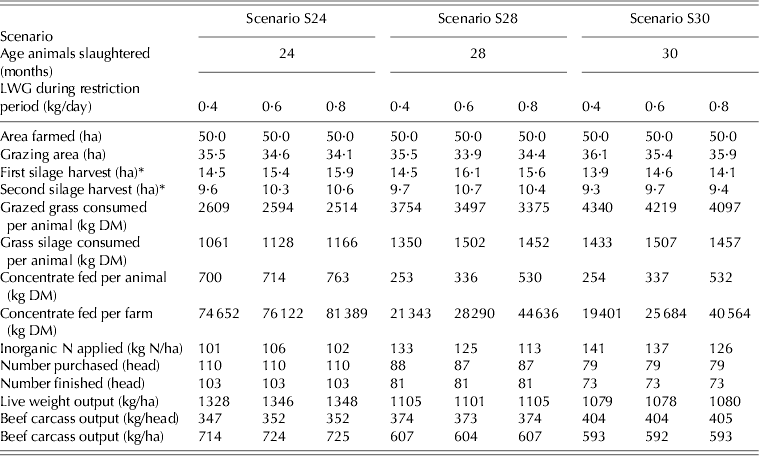
Table 4 presents the main physical results for the scenarios investigated. The grazing area and grazed grass consumed was highest for RESLWG of 0·4 kg/day for all scenarios. The proportion of grazed grass in the diet decreased as LWG during the restriction period increased for all scenarios as a result of a higher grass silage and concentrate requirement for animals with a higher LWG. Grazed grass and grass silage intake was similar for all RESLWG for S24, however, for S28 and S30, as RESLWG increased, grazed grass consumed per animal decreased and grass silage consumed per animal increased. For all finishing ages, concentrate intake per animal increased as RESLWG increased, due to the higher energy requirements needed to maintain the higher growth during the winter feeding period. Beef carcass output per animal and per hectare was the same for all RESLWG for S28 and S30. However, for S24 the carcass output per animal and per hectare was slightly lower for animals that had a live weight during the RESLWG of 0·4 compared with 0·6 and 0·8 kg/day. Where animals were finished at younger ages, the number of animals purchased and finished was higher; thus, S24 was greater than S28 which in turn was greater than S30, reflecting the considerable increase in demand for grazed grass and grass silage for animals finished at an older age. Beef carcass output per hectare was highest for S24 followed by S28 with S30 lowest due to the lower number of animals finished as age at finishing increased.
Physical results for three dairy calf-to-steer beef production systems with varying live weight gain (LWG) profiles over the winter feeding period investigated using Grange Dairy Beef Systems Model (GDBSM)
* Includes aftermath grazing.
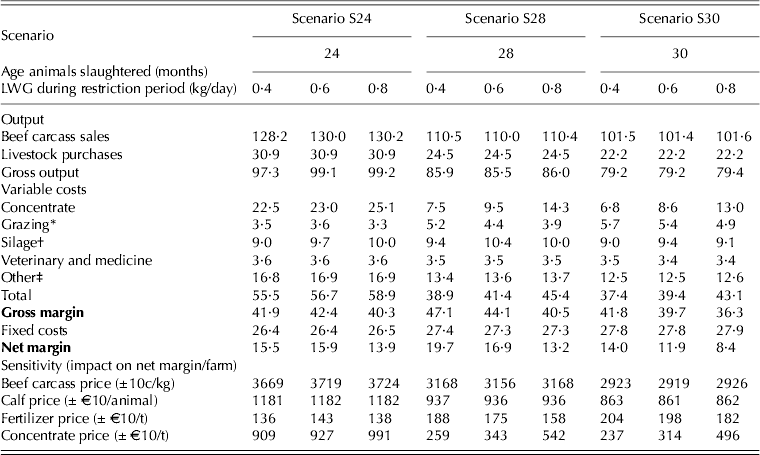
Table 5 presents the main financial results for the scenarios investigated. Overall the most profitable system was S28 and a RESLWG of 0·4 kg/day. The most profitable RESLWG was 0·6 kg/day for S24 and 0·4 kg/day for S28 and S30. Total concentrate and variable costs for all scenarios increased as RESLWG increased, which largely reflects the higher silage and concentrate requirements. Fixed costs did not differ within scenarios for different RESLWG. This resulted in the net margin (which reflects the gross margin) for S24 being highest for RESLWG of 0·6 kg/day. Both S28 and S30 had a net margin that decreased as LWG over the restriction period increased. Total variable costs were highest for S24, intermediate for S28 and lowest for S30, resulting in the gross margin being highest for S28 lowest for S30 with S24 intermediate. Fixed costs were similar for S28 and S30 but lower for S24. Therefore, net margin followed the same ranking as gross margin. The financial results on a per animal basis follow the same pattern as on a per farm basis.
Financial results for three dairy calf-to-steer beef production systems with varying live weight gain (LWG) profiles over the winter feeding period investigated using the Grange Dairy Beef Systems Model (GDBSM, all results in €000's per farm)
* Fertilizer and lime costs.
† Contractor, fertilizer and polythene.
‡ Slurry spreading, straw, etc.
Table 5 also shows the effect of changing beef carcass, calf, fertilizer and concentrate prices on net margin. Changing beef carcass and calf price had a similar effect on financial performance across the three RESLWG for each of the production systems. The effect of changing fertilizer price for S24 was similar across the three RESLWG and for S28 and S30 decreased as RESLWG increased. Changing concentrate price had a greater effect as RESLWG increased for all scenarios. Changing beef carcass, calf and concentrate price had the largest effect on S24 and the least effect on S30 with the opposite effect occurring for changing fertilizer price.
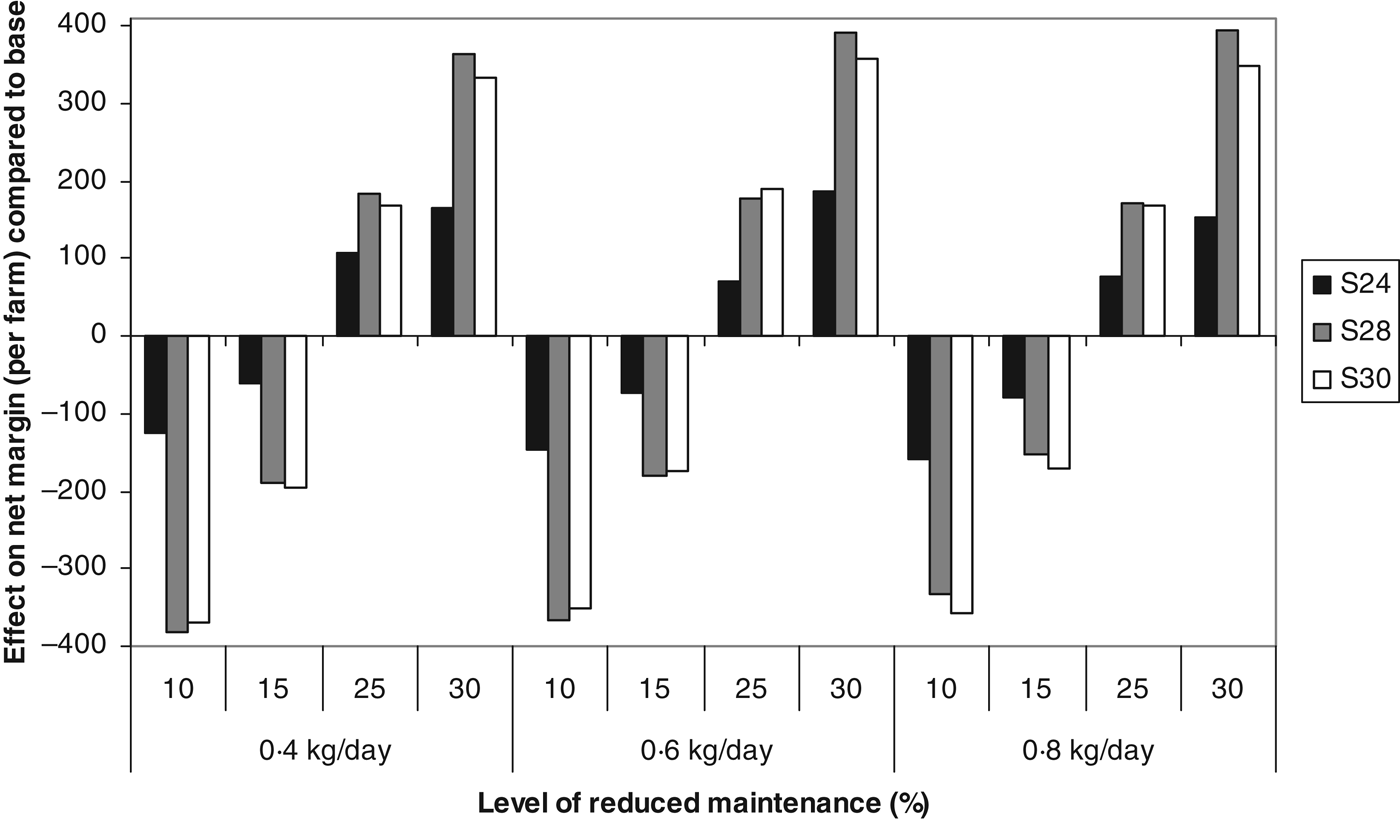
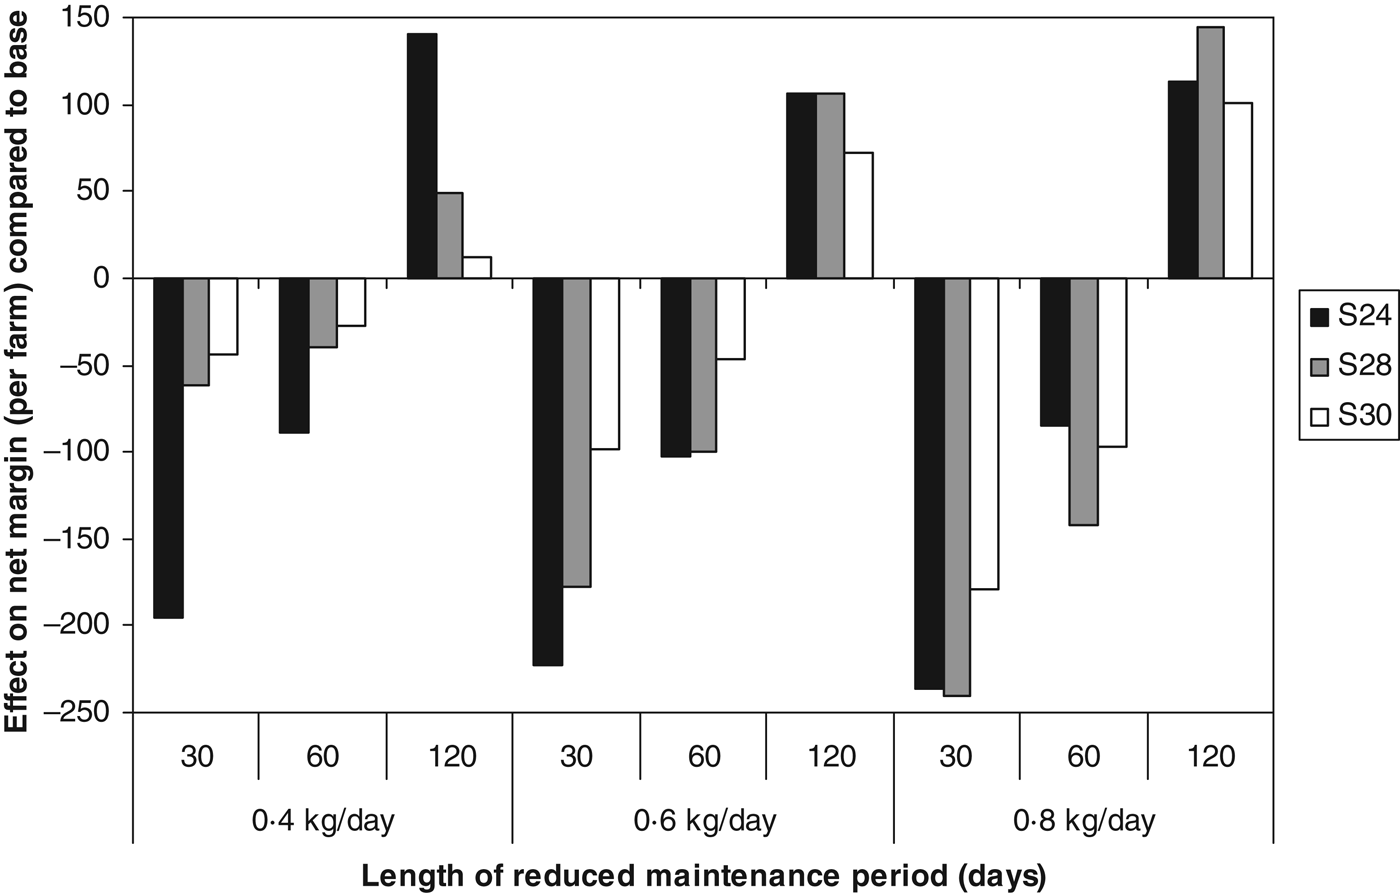
For all scenarios, the reduction in maintenance energy requirements during the compensation period (Fig. 1) had little effect on the net margin. The smallest effect was found for animals that had a RESLWG of 0·8 kg/day and for the S24 production systems. The largest effects were found for the S28 production system and animals that had a RESLWG of 0·6 kg/day. For every 1% reduction in maintenance requirement, net margin per farm increased by c. €30 for the three RESLWG modelled. Corresponding values for S24, S28 and S30 were €16, €37 and €35, respectively. Similarly, the duration over which reduced maintenance occurred (Fig. 2) had a small effect on net margin with the effect smallest for animals that had a RESLWG of 0·6 kg/day for S24 and 0·4 kg/day for S28 and S30 and had the largest effect on S24 and smallest on S30. For each day maintenance was reduced net margin per farm increased by €1·85, €2·89 and €3·74 for animals that had a RESLWG of 0·4, 0·6 and 0·8 kg/day, respectively. Corresponding values for S24, S28 and S30 were €3·69, €2·91 and €1·88, respectively.
Effect on net margin per farm for three dairy calf-to-steer beef production systems with varying live weight gain (LWG) profiles over the winter feeding period investigated using the Grange Dairy Beef Systems Model (GDBSM) with the level of maintenance reduction ranging from 10 to 30%. The level of maintenance reduction was set to 20% in the baseline scenarios.
Effect on net margin per farm for three dairy calf-to-steer beef production systems with varying live weight gain (LWG) profiles over the winter feeding period investigated using the Grange Dairy Beef Systems Model (GDBSM) with the length of maintenance reduction ranging from 30 to 120 days. The duration of reduced maintenance energy requirements was 90 days in the baseline scenarios.
DISCUSSION
Compensatory growth is an important component of many beef cattle production systems (Drouillard et al. Reference Drouillard, Ferrell, Klopfenstein and Britton1991; Keane Reference Keane2002). The current paper presents the economics of alternative growth trajectories of beef cattle under grass-based systems: it was found that in all scenarios where LWG during the restriction period was highest, net margin was lowest. Adapting the model to more accurately simulate compensatory growth had less effect on S24 compared with S28 and S30. This is primarily due to S28 and S30 being able to better exploit compensatory growth.
A key aspect of availing of compensatory growth for Irish beef cattle systems is to maximize total lifetime performance from grazed grass, which is the cheapest feed available to Irish farmers (Finneran et al. Reference Finneran, Crosson, O'kiely, Shalloo, Forristal and Wallace2012). However, in the current study the production system having the highest proportion of grazed grass in the diet did not always lead to the highest net margin, e.g. for the S24 system, which does not agree with the findings of Crosson et al. (Reference Crosson, Rotz and Sanderson2007) and Ashfield et al. (Reference Ashfield, Crosson and Wallace2013). The main reason for this difference is because S24 with a RESLWG of 0·6 kg/day had a higher beef carcass output per hectare compared with animals that had a RESLWG of 0·4 kg/day due to the animals with a RESLWG of 0·4 kg/day having a lower live weight at the end of the compensation period. This resulted in animal sales being €1700 higher but total costs were only €1200 higher for animals in S24 that had a RESLWG of 0·6 compared with 0·4 kg/day. Beef carcass output/ha was found by Crosson et al. (Reference Crosson, Mcgee and Drennan2009) to be one of the main drivers of profitability. The same principle is true for S28 and S30, whereby although S30 had a higher proportion of grazed grass in the diet, carcass output per hectare and net margin per farm was higher for S28. Nevertheless, the proportion of grazed grass in the total feed budget is high in all cases with the average for animals with a RESLWG of 0·4, 0·6 and 0·8 kg/day being 67, 65 and 62%, respectively, and 58, 66 and 70% for S24, S28 and S30, respectively. Overall, it is apparent that the proportions of grazed grass in the diet and beef carcass output per hectare are important determinants of profitability for beef cattle production systems. The finding that animals finished at 28 months of age were the most profitable is consistent with the results obtained by Ashfield et al. (Reference Ashfield, Crosson and Wallace2013).
Market volatility is a reality on Irish beef cattle farms with significant fluctuations in beef carcass, fertilizer and concentrate prices in recent years (CSO 2012). With the decoupling of market supports from production (Swinbank & Daugbjerg Reference Swinbank and Daugbjerg2006) and the possibility of further reductions in income supports arising from CAP reform (European Commission 2010) this volatility is likely to play an increasingly important role in beef cattle production. Results showed that changes in beef carcass price have a large effect on net margin. Scenario S24 at a RESLWG of 0·8 kg/day was affected most by changes in beef carcass price because of the high beef carcass output per hectare. Conversely, S30 with a RESLWG of 0·6 kg/day was least affected by beef carcass price changes because this system had the lowest beef carcass output/ha. Changes in calf price had the same effect within production systems for all levels of RESLWG because number of purchased animals was similar. However, changing calf price had the largest effect on S24 because there were more animals purchased for these scenarios compared with S28 and S30. Changes in calf prices had the second largest effect on net margin. Variation in fertilizer prices had a relatively small effect on net margin in the current study because it comprises a small proportion (0·1) of total costs. This agrees with Hennessy et al. (Reference Hennessy, Kinsella, Moran and Quinlan2012) who found that fertilizer costs make up 0·1 of total costs on cattle finishing farms in Ireland. Likewise, the effect of changes in concentrate prices is low for all finishing ages because of the low proportion of concentrate in the diet, especially for S28 (0·07) and S30 (0·06). The effect of changes in concentrate price increased as RESLWG increased because the proportion of concentrate in the diet increased.
There is a considerable variation surrounding the level and duration of maintenance reduction during the period of accelerated growth for compensating animals. Reducing maintenance requirements during the early compensatory period was associated with only modest changes in farm profitability. Net margin increased due to lower grazing costs, as the animals were consuming less grass. This is also the reason for the net margin increasing as the length of the reduced maintenance period increased. Nevertheless, although changing the level and duration of maintenance energy reduction had an effect on the net margin, it did not affect the ranking of the systems.
It should be noted that the degree to which maintenance is reduced and for how long that reduction persists depends on the rate and length of the restriction level (Ryan et al. Reference Ryan, Williams and Moir1993). Therefore, having the same reduction in maintenance requirement (20%) for all nutrient restriction levels do not fully capture the residual effects and this is a limitation of the approach taken in the current study. However, there is a lack of information in this area and more research is needed to determine coefficients for different scenarios. By evaluating a wide range of possibilities in the current study an attempt has been made to quantify some of these potential effects at the farm systems level. A more detailed investigation of how intake of grazing animals is affected during compensation is necessary to more accurately simulate this aspect of compensatory growth.
The current study focuses on typical winter feeding arrangements in Ireland, whereby grass silage is the predominant forage during the winter feeding period. There are a number of other winter feed options available to beef farmers in Ireland (whole crop maize silage, whole crop wheat silage, kale, fodder beet and baled grass silage). Although Finneran et al. (Reference Finneran, Crosson, O'kiely, Shalloo, Forristal and Wallace2010) found that in most cases these crops had a similar cost or were costlier when compared with grass silage there were some opportunities to reduce winter feed costs, e.g. the incorporation of grazed brassicas into the winter feeding system. In such instances where winter feed costs are lower than those prevailing for the forage system modelled in the current study, the advantage of compensatory growth for pasture-based systems might be reduced.
The results from the current study show that compensatory growth can be used to improve the profitability of beef production systems and supports the rationale for previous research studies aimed at optimising compensatory growth for cattle systems (e.g. Drennan Reference Drennan1979; Wright et al. Reference Wright, Russel and Hunter1989; Drouillard et al. Reference Drouillard, Ferrell, Klopfenstein and Britton1991; Hornick et al. Reference Hornick, Van Eenaeme, Clinquart, Diez and Istasse1998; Nielsen et al. Reference Nielsen, Kristensen and Thamsborg2004). Although the model presented is used in an Irish context it can be applied to other areas of temperate grasslands such as New Zealand, Northeastern United States, Southwestern South America and other areas in Northwest Europe where appropriate biological relationships between restriction feeding and subsequent compensation are available. Similarly, compensatory growth forms the basis for production systems in other non-temperate grassland regions; for example, background feeding in rangeland systems of North American cattle systems (Peel Reference Peel2003). The biological principles (of reduced maintenance and accelerated LWG) are the same for all animals experiencing compensatory growth. The parameters used in the current study are set for an Irish temperate grassland system; however, these parameters can be modified to reflect different systems where the appropriate data are available.
CONCLUSION
Compensatory growth is an intrinsic part of beef production systems in Ireland and the GDBSM can be used to investigate possible ways of exploiting this potential in dairy calf-to-beef systems. The developments outlined in the current paper to incorporate the effects of compensatory growth have enhanced the ability of the model to simulate accurately and effectively Irish dairy calf-to-beef grass-based systems. The most profitable systems found in this analysis where those that sought to balance high proportion of grazed grass in the diet with high beef carcass output per hectare. The most profitable system was finishing animals at 28 months of age with an LWG during the restriction period of 0·4 kg/day. Sensitivity analysis found that beef carcass price had the largest affect on net margin with fertilizer price having the least effect. Furthermore, it was apparent that the reduction and duration of maintenance energy requirements during compensation had a modest impact on farm financial returns.