1. Introduction
The Upper Cretaceous – lower Palaeogene stratigraphic succession exposed in the Western Desert has been the subject of intensive studies (Le Roy, Reference Le Roy1953; Said & Kerdany, Reference Said and Kerdany1961; Hewaidy & Cherif, Reference Hewaidy and Cherif1984; Luger, Reference Luger1985, Reference Luger1988; Anan & Hewaidy, Reference Anan and Hewaidy1986; Cherif & Hewaidy, Reference Cherif and Hewaidy1986; Hewaidy, Reference Hewaidy1990; Samir, Reference Samir1995; Schnack, Reference Schnack2000; Hewaidy & Strougo, Reference Hewaidy and Strougo2001; Hewaidy et al. Reference Hewaidy, Farouk, Hatem and Bazeen2014; Orabi & Khalil, Reference Orabi and Khalil2014; Farouk & El-Sorogy, Reference Farouk and EL-Sorogy2015; El-Dawy et al. Reference El-Dawy, Obaidalla, Mahfouz and Abdel Wahed2016). However, palaeoenvironment and palaeobathymetry studies using smaller benthic foraminifera have been scarce, especially in the Dakhla Oasis (Schnack, Reference Schnack2000; Hewaidy et al. Reference Hewaidy, Farouk, Hatem and Bazeen2014) (Fig. 1a, b).
Study area: (a) location map showing the study area (star), southern Western Desert, Egypt and (b) palaeogeographic set-up of the study area, Egypt.

In the present study, benthic foraminiferal species distribution (abundance patterns) are used to build assemblages and characteristic species, corroborate palaeoenvironmental data and infer palaeobathymetry (Luger, Reference Luger1985, Reference Luger1988; Hewaidy, Reference Hewaidy1990; Speijer, Reference Speijer1994; Speijer & Van Der Zwaan, Reference Speijer, Van der zwaan and Hart1996; Li, Keller & Stinnesbeck, Reference Li, Keller and Stinnesbeck1999; El Deep, Faris & Mandur, Reference El deep, Faris and Mandur2000; Schnack, Reference Schnack2000; Tantawy et al. Reference Tantawy, Keller, Adatte, Stinnesbeck, Kassab and Schulte2001; Keller et al. Reference Keller, Adatte, Burns and Tantawy2002; Jain & Collins, Reference Jain and Collins2007; Jain, Collins & Hayek, Reference Jain, Collins and Hayek2007; Nagy et al. Reference Nagy, Finstad, Dypvik and Bremer2001, Reference Nagy, Hess, Dypvik and Bjærke2011; King, Reference King2013).
Diversity measures (Shannon H, Fisher's α, equitability and dominance), benthic foraminifera number (BFN) and species abundances are used for first time in the Western Desert of Egypt better interpret the prevailing palaeoenvironment. These proxies have previously been used to infer benthic ecological structure and depositional environment (Smart, Reference Smart1998; Murray Reference Murray2006; Nagy, Hess & Alve, Reference Nagy, Hess and Alve2010; Nagy et al. Reference Nagy, Hess, Dypvik and Bjærke2011; Hess, Nagy & Laursen, Reference Hess, Nagy and Laursen2014).
The response of benthic foraminiferal assemblages to relative sea-level changes during the Maastrichtian–Danian succession of the Dakhla Oasis (Egypt) is analysed with respect to sequence stratigraphy, regional tectonics, climate and sea-level changes. The pre- and post-Cretaceous–Palaeogene (K/Pg) distribution of high-organic-flux benthic foraminiferal species is also analysed to better understand the prevailing environment in terms of changes in nutrient availability.
2. Geological setting
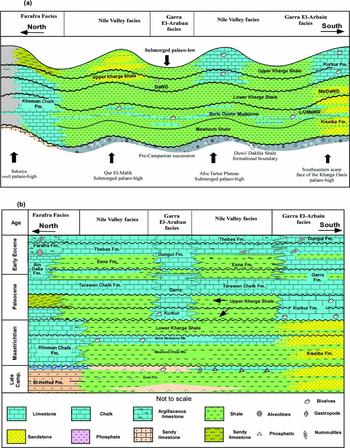
The Dakhla Oasis is a large topographic depression located in the central Western Desert of Egypt, marked by a less deformed and stable tectonic shelf (Said, Reference Said1962) (Fig. 1). The Western Desert is generally characterized by submerged and varying palaeo-lows and highs (El-Azabi & Farouk, Reference El-Azabi and Farouk2011; Farouk & El-Sorogy, Reference Farouk and EL-Sorogy2015) (Fig. 2a). The stratigraphic succession in the Dakhla–Kharga oases is subdivided into the Upper Jurassic – lower–middle Campanian, lower siliciclastic (= the Nubian Sandstone) and the upper Campanian – lower Eocene siliciclastics/carbonate sequences (Fig. 2b), which are covered by Quaternary deposits.
Facies variations and rock units in Western Desert, Egypt. (a) Three lateral and vertical facies changes in the Western Desert of Egypt are well known as Farafra, Nile Vally and the Garra El-Arbian facies. (b) The Cretaceous–Paleocene rock units exposed in the southern Western Desert of Egypt (after El-Azabi & El-Araby, Reference El-Azabi and El-Araby2000).

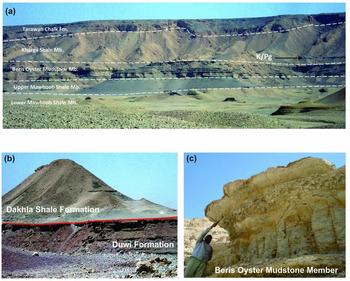
Three lateral and vertical facies changes in the Western Desert of Egypt are well known from north to south as (1) Farafra Facies, including (from oldest to youngest): Campanian El–Hefhuf; Maastrichtian Khoman Chalk; Danian Dakhla Shale; Selandian–Thanetian Tarawan Chalk; Thanetian–Ypresian Esna Shale and its lateral equivalent the Ain Dalla; and Ypresian Farafra Limestone formations; (2) Nile Valley Facies including (from oldest to youngest): Campanian Duwi; Maastrichtian–Selandian Dakhla Shale; Thanetian Tarawan Chalk; Thanetian–Ypresian Esna Shale; and Ypresian Thebes Limestone formations; and (3) the Garra El–Arbian Facies including: Maastrichtian Dakhla Shale; Danian–Selandian Kurkur; and Thanetian Garra formations (Fig. 2a, b). The present study is related to the Nile Valley Facies and is restricted to the Maastrichtian–Danian Dakhla Shale Formation (Fig. 2). It is classified into three members: the Early Maastrichtian Mawhoob Shale; the Late Maastrichtian Beris Oyster Mudstone; and the Late Maastrichtian – Paleocene Kharga Shale Member (Awad & Ghobrial, Reference Awad and Ghobrial1965; Figs 2a–c, 3). The latter is further subdivided into two informal units, the Lower and Upper Kharga Shale Members (Luger, Reference Luger1985), separated by the Cretaceous–Palaeogene (K/Pg) boundary (Figs 2, 3). The Maastrichtian Mawhoob Shale and Beris Oyster Mudstone members pass laterally towards the north at the Farafra Oasis into the Khoman Chalk Formation (Figs 2, 3).
Field photographs. (a) General view of the Maastrichtian–Paleocene deposits in the eastern escarpment of the Dakhla Oasis, showing the three informal members (Mawhoob Shale, Beris Oyster Mudstone and Kharga Shale) of the Dakhla Formation, overlain by the carbonate platform of the Tarawan Formation. (b) The Duwi/Dakhla formational boundary. (c) Beris Oyster Mudstone Member marked by the abundance of the pelecypods, Exogra overwegi.

3. Biostratigraphy
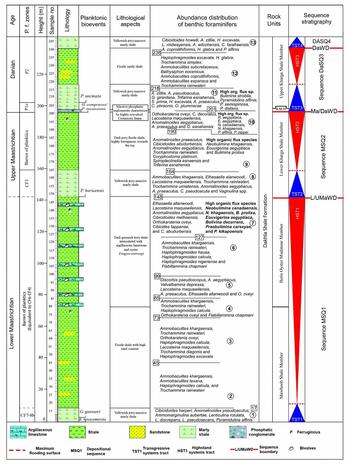
The studied sediments of the Dakhla Formation range from Maastrichtian to Danian in age (Fig. 4). The Maastrichtian interval is classified according to the biostratigraphic zonal schemes of Li, Keller & Stinnesbeck (Reference Li, Keller and Stinnesbeck1999) and the Paleocene interval according to Berggren & Pearson (Reference Berggren and Pearson2005). Five zones are recognized (Fig. 4), described in the following sections.
Biostratigraphy, benthic foraminiferal assemblage and sequence stratigraphy of the studied section.

3.a. Rugoglobigerina hexacamerata Zone (CF8b)
This zone is defined by the LO of Rugoglobigerina hexacamerata Brönnimann to the LO of Gansserina gansseri (Bolli). It is equivalent to the lowermost part of the Mawhoob Shale Member (samples 1–7, Fig. 4) which overlies the barren late Campanian sediments of the Duwi Formation. The dominant planktonic foraminiferal species recorded in this zone include Globotruncana arca (Cushman), G. aegyptiaca Nakkady, G. orientalis El-Naggar, Globotruncanita stuartiformis (Dalbiez), G. stuarti (de Lapparent), Contusotruncana fornicata (Plummer), Rugoglobigerina rugosa (Plummer), R. macrocephala Brönnimann, Heterohelix globulosa (Ehrenberg), H. navaroensis Loeblich, H. reussi (Cushman) and H. striata (Ehrenberg).
3.b. Gansserina gansseri Zone (CF7)
This is defined as the biostratigraphic interval from the first appearance of Gansserina gansseri (Bolli) to the first appearance of Contusotruncana contusa (Cushman) of early Maastrichtian age (samples 8–17, Fig. 4) of the Mawhoob Shale Member. The planktonic foraminiferal assemblage is similar to that of the underlying CF8b Zone, with the addition of the nominate taxon (G. gansseri) and Pseudoguembelina palpebra Brönnimann and Brown. Farouk (Reference Farouk2014) had earlier noted that the first occurrence (FO) of the G. gansseri event is relatively stratigraphically high in the Middle East (Tunisia, Jordan and Egypt) within the middle part of early Maastrichtian age.
Samples 17–148 are barren of planktic foraminifera. However, following Tantawy et al. (Reference Tantawy, Keller, Adatte, Stinnesbeck, Kassab and Schulte2001), the Beris Mudstone Member (samples 80–147) is assigned to planktonic foraminiferal zones CF4–CF3 (see Fig. 4).
3.c. Pseudoguembelina hariaensis Zone (CF3)
This zone is defined as the biostratigraphic interval from the first appearance of Pseudoguembelina hariaensis Nederbraght to the last appearance of G. gansseri, recorded from the lower unit of the Kharga Shale Member (samples 148–165). The planktonic foraminiferal assemblage includes: Racemiguembelina powelli Smith and Pessagno, Pseudoguembelina hariaensis, P. kempensis Esker, Rugoglobigerina reicheli Brönnimann and R. scotti (Brönnimann) (see Fig. 4).
In the present study, the Lower Kharga Shale unit (samples 149–199) holds planktonic species that belong to Zone CF3. In fact, the top of Zone CF3 in most parts of Western Desert is marked by an erosional surface which is consistent with the K/Pg boundary identified by earlier workers (Abdel-Kirrem & Samir, Reference Samir1995; Tantawy et al. Reference Tantawy, Keller, Adatte, Stinnesbeck, Kassab and Schulte2001; Hewaidy, El-Azabi & Farouk, Reference Hewaidy, El-Azabi and Farouk2006; El-Azabi & Farouk, Reference El-Azabi and Farouk2011; Farouk, Reference Farouk2016) (see Fig. 4).
3.d. Globanomalina compressa Zone (P1c)
This zone is defined from the last occurrence (LO) of Globanomalina compressa (Plummer) to the LO of Praemurica uncinata (Bolli) (see Fig. 4). This zone overlies the K/Pg unconformity, comprises c. 7 m of the upper unit of the Kharga Shale Member (samples 200–207) and is characterized by Globanomalina compressa, Parasubbotina pseudobulloides (Plummer), P. variant (Subbotina), Subbotina triloculinoides (Plummer), Praemurica inconstans (Subbotina) and Chiloguembelina midwayensis (Cushman). Earlier, Keller, Li & Macleod (Reference Keller, Li and Macleod1995) subdivided the P1c Subzone of Berggren et al. (Reference Berggren, Kent, Swisher, Aubry, Berggren, Kent, Aubry and Hardenbol1995) into P1c and P1d, based on the first occurrence of the Praemurica trinidadensis (Bolli). The presence of P. trinidadensis in this study interval is equated with the P1d Subzone of Keller, Li & Macleod (Reference Keller, Li and Macleod1995), Tantawy et al. (Reference Tantawy, Keller, Adatte, Stinnesbeck, Kassab and Schulte2001) and Keller et al. (Reference Keller, Adatte, Burns and Tantawy2002) (Fig. 4).
3.e. Praemurica uncinata Zone (P2)
This zone is defined by the first appearance of Praemurica uncinata (Bolli) to the first appearance of Morozovella angulata (White). It occupies a part of the upper Kharga Shale Unit (samples 208–247, Fig. 4). The planktonic foraminiferal assemblage is similar to that of the underlying subzone except for the first appearance of Chiloguembelina subtriangularis Beckmann, Parasubbotina variospira (Belford), Morozovella praeangulata (Blow), Praemurica praecursoria (Morozova) and Praemurica uncinata (Fig. 4).
4. Sequence stratigraphy
Four sequence boundaries are identified that are marked by sedimentation and faunal breaks (erosional, lack of biozones, reworking, facies shifts and sharp changes in biofacies) (see Fig. 4). These are named using an abbreviation of their assigned stage boundaries coupled with an abbreviation of the term Western Desert (Ca/MaWD, L/UMaWD, Ma/DaWD and DaWD) (Fig. 4). The inferred sequence boundaries in the Maastrichtian–Danian sediments document the presence of three third-order depositional sequences (El-Azabi & Farouk, 2010). They are named using the first letter of the assigned stage followed by an abbreviation of the term sequence with a running number counted separately for each stage (MSQ1, MSQ2, etc.). In all, three sequences are noted where each sequence represents a transgressive-regressive systems tract (TST-HST), where the lowstand systems tract (LST) are rarely initiated due to the deposition in an intra-shelf basin characterized by the presence of submerged palaeo-structural highs and lows (El-Azabi & Farouk, Reference El-Azabi and Farouk2011). They are Sequence MSQ1 (TST1 and HST1), Sequence MSQ2 (TST2 and HST2), Sequence DaSQ3 (TST3 and HST3) and Sequence DaSQ4 (TST4) (Fig. 4; El-Azabi & Farouk, 2010).
4.a. Sequence MSQ1
This sequence comprises the Mawhoob Shale and Beris Oyster Mudstone members and covers the early Maastrichtian interval (see Fig. 4). It attains a thickness of c. 120 m. It is bounded at the base by the Campanian–Maastrichtian sequence boundary (Ca/MaWD) that unconformably separates the Duwi and Dakhla Shale formations (Fig. 3b; El-Azabi & Farouk, Reference El-Azabi and Farouk2011). It coincides with a hiatus at the CF8a/CF8b zonal boundary, dated at 71 Ma (Li, Keller & Stinnesbeck, Reference Li, Keller and Stinnesbeck1999) and close to the negative excursion of the Campanian–Maastrichtian Boundary Event (CMBE), well-recorded in different parts of the world (Voigt et al. Reference Voigt, Gale, Jung and Jenkyns2012; Farouk, Reference Farouk2014). The sequence includes a transgressive systems tract (TST1), which is mainly composed of grey-greenish marly shale with siltstone intercalation, and a highstand systems tract (HST1), which consists of shale and sandy shale intercalated with abundant, low-diversity Exogyra overwegi argillaceous limestone (Fig. 4). The basal lowstand systems tract is missing due to the fast relative sea-level rise over the studied area, where the transgressive surface coincides with the sequence boundary at the Duwi–Dakhla Shale formational boundary (El-Azabi & Farouk, Reference El-Azabi and Farouk2011; Fig. 4).
4.b. Sequence MSQ2
The upper Maastrichtian sequence (MSQ2) includes the Lower Kharga Shale Unit (Fig. 4). It has a thickness of c. 50 m. The precise age of sequence MSQ2 is hard to assign as its facies are barren of planktonic species or lie within the undifferentiated zones. In Dakhla, the lower part of this sequence is dated to Zone CF3. Sequence MSQ2, however, could be ascribed to late Maastrichtian zones CF4–CF3 (68.3–65.5 Ma) that typify the same interval in the deeper parts of the Dakhla Basin (Tantawy et al. Reference Tantawy, Keller, Adatte, Stinnesbeck, Kassab and Schulte2001). This sequence is correlated with the upper part of the SQ3 sequence of Hewaidy, El-Azabi & Farouk (Reference Hewaidy, El-Azabi and Farouk2006) and to DkSQ2 sequence of El-Azabi & Farouk (Reference El-Azabi and Farouk2011). The base of this sequence coincides with the lower–upper Maastrichtian boundary (= Beris Oyster Mudstone Member/Lower Kharga Shale Unit) and is characterized by a transition from shallow deposits to somewhat deeper neritic deposits in Kharga and Dakhla oases. The base of Sequence MSQ2 may be matched with a hiatus at the CF5/CF4 zonal boundary, which is dated at 68.3 Ma (Li, Keller & Stinnesbeck, Reference Li, Keller and Stinnesbeck1999), and possibly with the global positive excursion of the Middle Maastrichtian Event (MME) (Voigt et al. Reference Voigt, Gale, Jung and Jenkyns2012; Farouk, Reference Farouk2014). It is also close to the major cycle boundary KMa4 of Haq (Reference Haq2014) (Fig. 4). Sequence MSQ2 consists of foraminiferal marly shale with little shale and sand (samples 148–164) during the TST, followed upwards by ferruginous sandy shale barren of planktonic foraminifera during the HST (Fig. 4).
4.c. Sequence DaSQ3
The upper Danian sequence (DaSQ3) covers the lower and middle parts of the Upper Kharga Shale Unit (Fig. 4). It is bounded at the base by the K/Pg unconformity (Ma/DaWD) noted at 65.5 Ma and is characterized by the lack of planktic zones CF2–P1b (top of Zone CF3) (see Fig. 4). In the Dakhla–Kharga oases, it is easily defined as a horizon with a phosphatic conglomerate (c. 30 cm to 1 m thick) with crushed late Maastrichtian foraminifera called the Bir Abu Munqar Horizon (Barther & Herrmann-Degen, Reference Barthel and Herrmann-Degen1981; Farouk, Reference Farouk2016; Fig. 4). This horizon matches well with the K/Pg unconformity in Egypt and is marked by large time gap within Egypt's Western Desert due to tectonic uplift (Farouk, Reference Farouk2016; Fig. 4). This is followed by yellowish-grey massive foraminiferal marly shale during the TST, and above by a fissile shale during the HST (Fig. 4).
4.d. Sequence DaSQ4
This sequence is based on erosional surfaces, lithological and faunal assemblage changes and intensive reworking of older fauna during a new transgressive phase within the P2 Zone (TST4). The present study deals only with the lower part of this sequence.
5. Methods
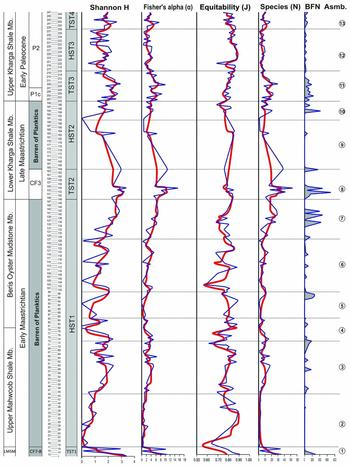
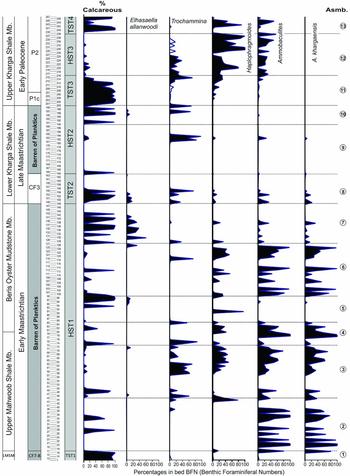
A total of 13232 specimens were analysed for benthic foraminiferal diversity, palaeoecology and palaeobathymetry from 247 samples of Maastrichtian–Danian deposits from a section at Dakhla Oasis at Gharb El-Mawohb at the main escarpment (26°01′02′′N, 28°13′18′′E; Fig. 1). Diversity measures (Shannon–Weaver information function known as Shannon H, Fisher's α, equitability E and dominance D) and species abundance are used (Fig. 5). In combination, benthic foraminifera number (BFN) is used to infer changes in palaeooxygenation and organic matter flux. When inferred in conjunction with the BFN of dominant genera (Trochammina, Haplophragmoides and Ammobaculites) and species (i.e. Ammobaculites khargaensis Nakkady and Talaat and Elhasaella allanwoodi Hamam) (Fig. 6), they provide a robust estimation of the prevailing palaeoenvironment (Bernhard, Reference Bernhard1987; Kaiho & Hasegawa, Reference Kaiho and Hasegawa1994; Jorissen, De Stigter & Widmark, Reference Jorissen, De stigter and Widmark1995; Van der Zwaan et al. Reference Van Der Zwaan, Duijnstee, Den dulk, Ernst, Jannink and Kouwenhoven1999; Murray, Reference Murray and Martin2000; Holbourn, Kuhnt & Erbacher, Reference Holbourn, Kuhnt and Erbacher2001; Herrle et al. Reference Herrle, Pross, Friedrich and Hemleben2003 a, b). Diversity measures (Shannon H, Fisher's α, equitability and dominance) are further used to provide a better estimation of the prevailing ecological structure and depositional environment (Figs 7, 8).
Diversity measures, species, BFN (benthic foraminifera numbers) and benthic foraminifera assemblages of the studied section. Bold lines (red) are 5-point running averages.

Distribution of dominant benthic foraminiferal species and genera in the studied section.

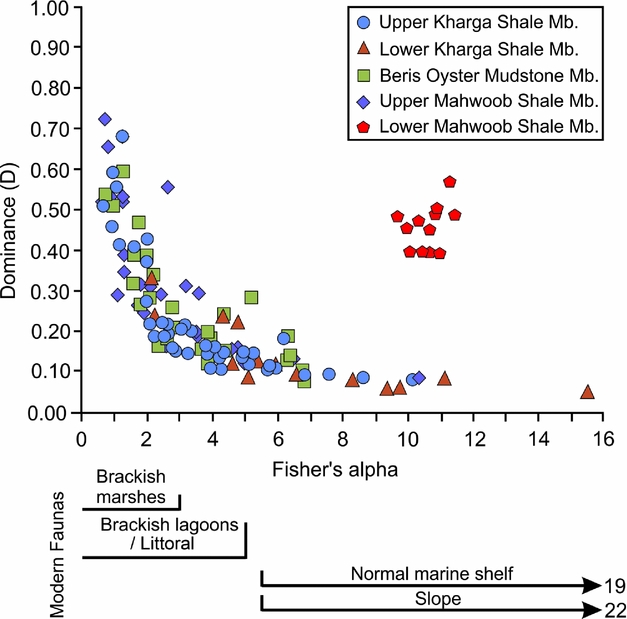
Benthic foraminiferal depositional settings categorized by stratigraphic members.

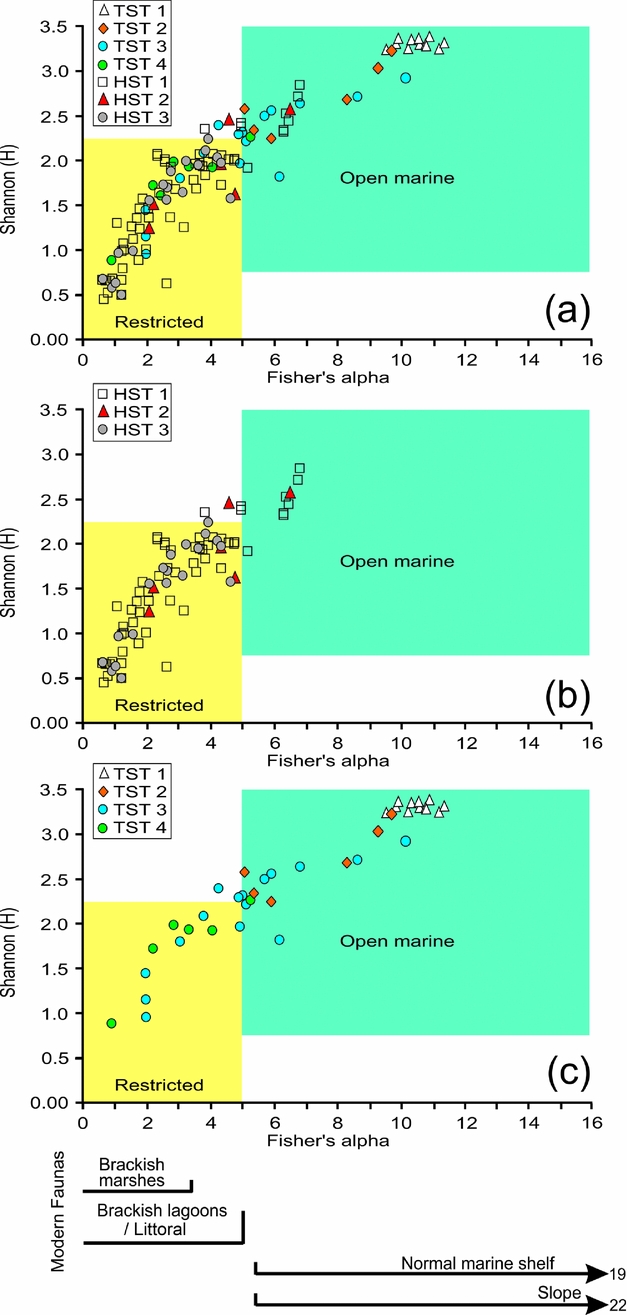
Sequence stratigraphic-based benthic foraminiferal community structure and depositional settings. The plot of Fisher's α versus Shannon H gives a good idea of the depositional settings (i.e. restricted v. open marine) of the studied sequence-based benthic foraminiferal fauna. (a) All; (b) HST; and (c) TST dataset.

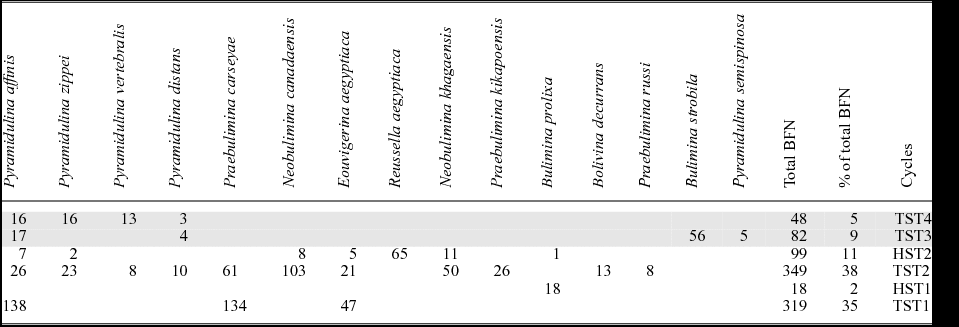
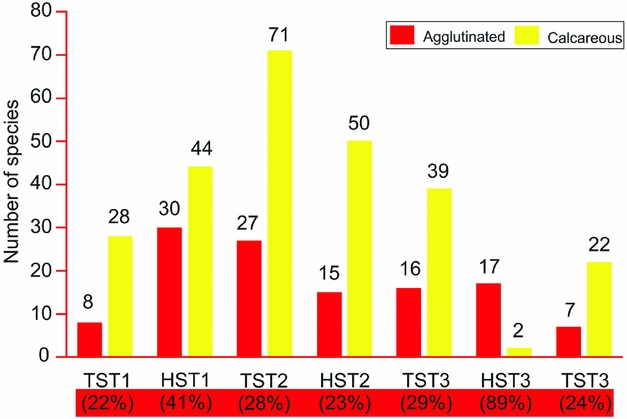
Faunal change before and after the Cretaceous–Palaeogene boundary (K/Pg, also known as the Cretaceous–Tertiary boundary or K/T) is also addressed (Figs 9, 10). The pre- and post-K/Pg distribution of high-organic-flux benthic foraminiferal species is also analysed for a better understanding of the prevailing environment in terms of changes in nutrient availability (Table 1). The temporal species distribution (calcareous v. agglutinated) with respect to TST/HST is also provided (Fig. 11).
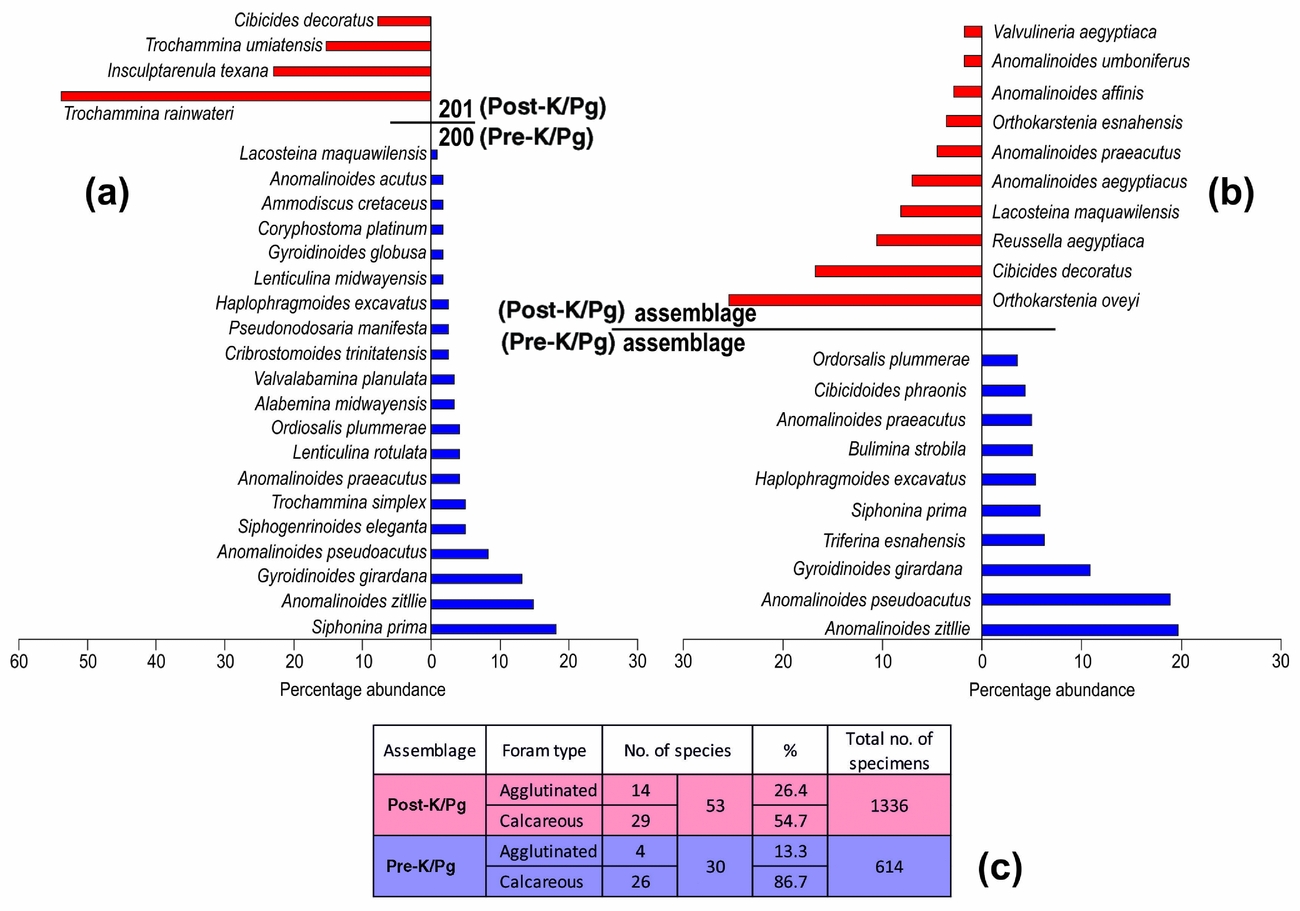
Changes from pre-K/Pg to post-K/Pg (a) between samples 200 and 201; (b) in assemblages 10 and 11; and (c) in numbers.

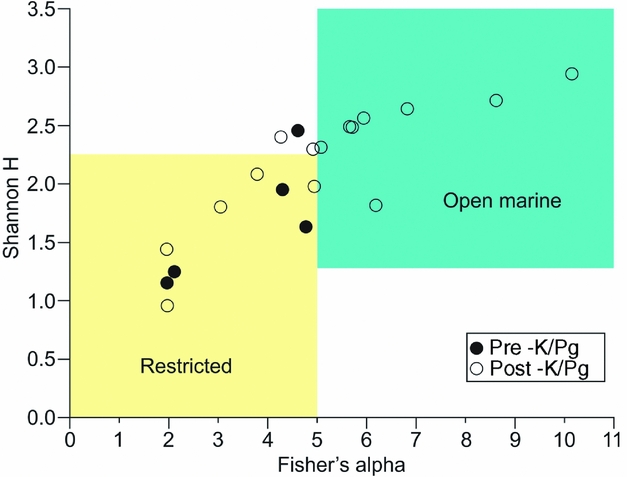
Plot of Fisher's α versus Shannon H of assemblages 10 (pre-K/Pg) and 11 (post-K/Pg) showing the depositional settings (i.e. restricted v. open marine).

Distribution of high-flux species (see text for explanation) in the studied section with an emphasis on their pre- (lower) and post- (upper, shaded) K/Pg distribution.

Distribution of benthic foraminiferal species with respect to identified HST and TST sequences. The bottom highlighted part shows the percent of agglutinated benthic foraminiferal species within each cycle.

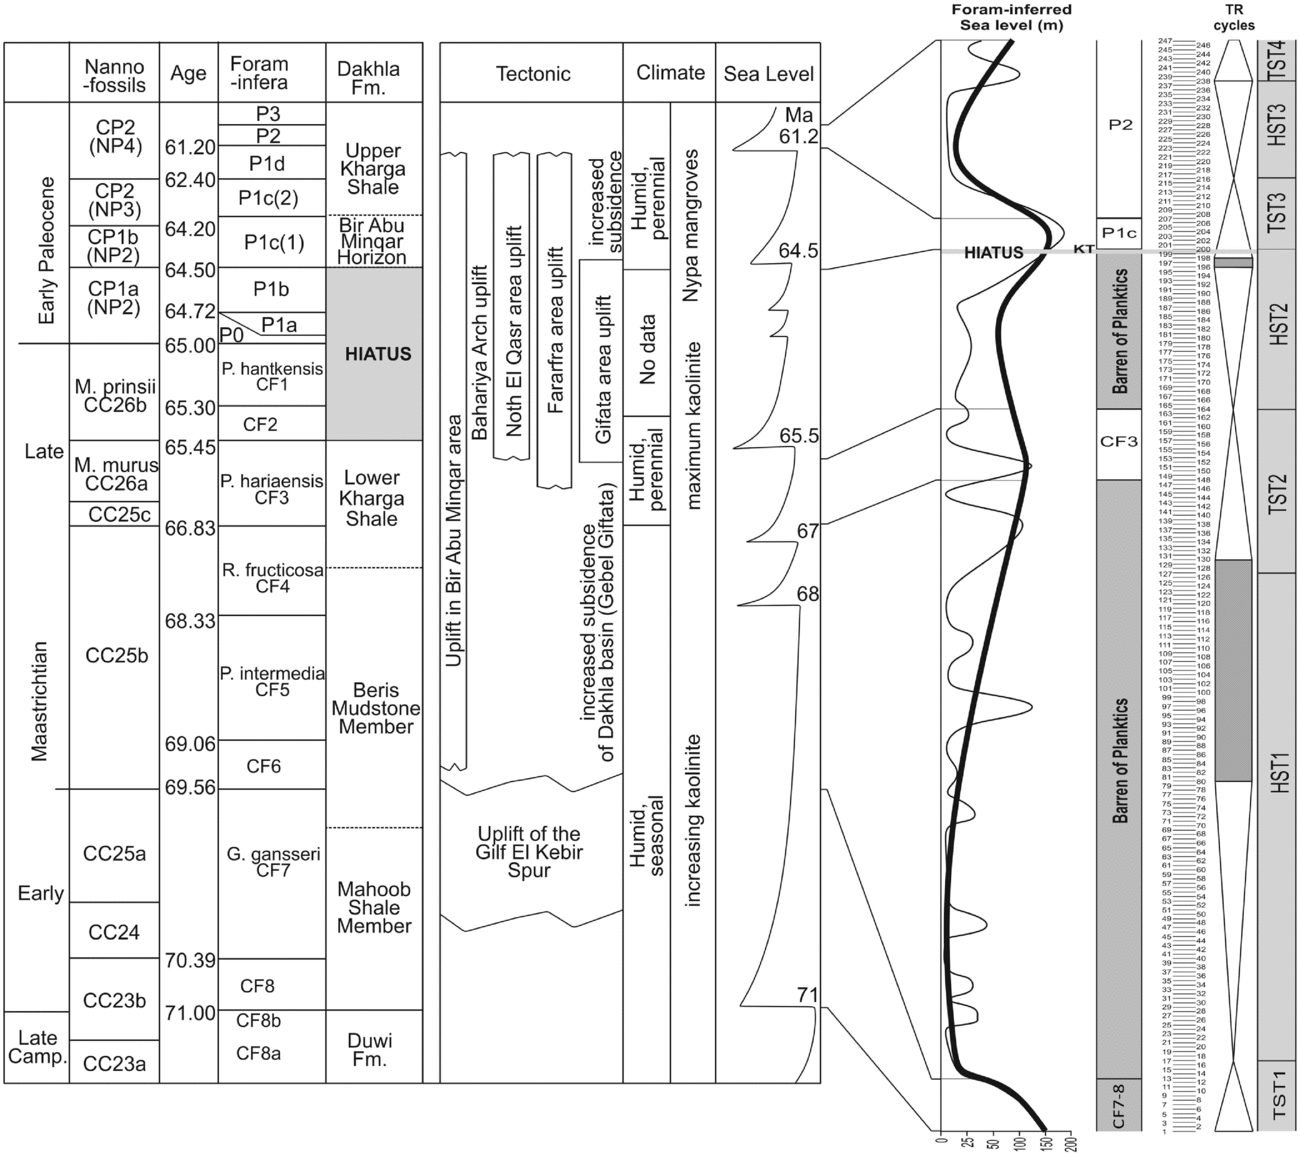
All data are summarized (Fig. 12) and interpreted in terms of sequence stratigraphy, regional tectonics, climate and sea level (Fig. 13). The inferred sea level is based on the abundance (%) pattern of calcareous benthic foraminifera, species abundance, distribution of characteristic species, lithology and the presence (P/B ratio) and absence of planktonic foraminifera. The palaeodepth followed here includes: Inner Neritic: <50 m; Middle Neritic: 50–100 m; Outer Neritic: 100–200 m; and Bathyal >200 m.
Summary of event and the inferred sea-level curve of the studied Maastrichtian–Danian sediments. See text for palaeodepth parameters used to infer the present sea-level curve.

Correlation of regional tectonics, climate and sea-level changes (after Li, Keller & Stinnesbeck, Reference Li, Keller and Stinnesbeck1999; Tantawy et al. Reference Tantawy, Keller, Adatte, Stinnesbeck, Kassab and Schulte2001) and inferred sea-level curve of the studied Maastrichtian–Danian sediments.

6. Results
6.a. Species diversity, BFN, P/B ratios and depositional setting
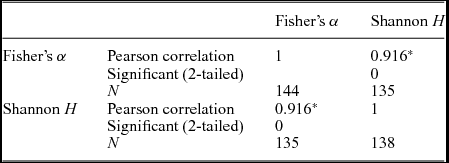
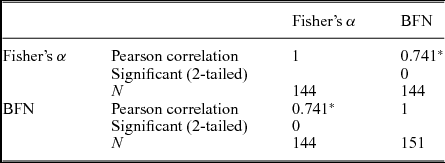
A statistically significant correlation (Pearson = 0.916 at the 0.01 level; 2-tailed) is noted between Fisher's α and Shannon H, suggesting that both indexes are good proxies for species diversity (Table 2). Fisher's α, a within-habitat diversity index and a preferable proxy for species diversity, considers both evenness and richness; other species abundance models consider only evenness, however. A statistically significant and positive correlation (Pearson = 0.741 at the 0.01 level; 2-tailed) is also noted between Fisher's α and BFN (Table 3), broadly suggesting that increased oxygenation of the bottom waters and the availability of organic matter flux (= higher BFN numbers) has a strong correlation with increased species diversity. Dominance (D) and Fisher's α shows a negative relationship, suggesting that high dominance is marked by low diversity (Fig. 7).
A statistically significant correlation is noted between diversity measures, Fisher's α and Shannon H.

* Correlation is significant at the 0.01 level (2-tailed).
A statistically significant correlation is noted between Fisher's α and BFN (benthic foraminifera numbers).

* Correlation is significant at the 0.01 level (2-tailed).
6.a.1. Highstand systems tracts
Three highstand systems tracts (HST) are identified (Figs 5, 12; Table 3): HST1 (samples 18–148; assemblages 2–6); HST2 (samples 164–200; assemblages 9–10); and HST3 (samples 216–238; assemblage 12). During HST1 all diversity indices and BFN steadily increase, but the values remain at low–moderate levels (Fig. 5). HST1 is also marked by the absence of planktonic foraminifera except in a very few samples that have very low P/B ratios (<5%). HST2 is marked by declining values of all diversity measures and BFN (Fig. 5), along with the absence of planktonic foraminifers. HST3 displays low species diversity and BFN along with the absence of planktonic foraminifers (P/B ratio = 0; Fig. 5). Both HST1 and HST2 fauna sit largely within the restricted brackish lagoonal/littoral region with few data points transgressing into the open marine region, whereas those of HST3 fall within the restricted brackish littoral region (Fig. 8).
6.a.2. Transgressive systems tracts
Four transgressive systems tracts (TST) are identified (Figs 5, 12): TST1 (samples 1–17; assemblage 1); TST2 (samples 127–164; assemblages 7–8); TST3 (samples 201–216; assemblage 11); and TST4 (samples 238–247; assemblage 13). TST1 is marked by maximum diversity and moderate BFN values and with high P/B ratio (50–70%) (Figs 5, 12). TST2 is characterized by moderately high P/B ratios (25–60%) with peak diversity values that begin to decline midway; the BFN values are also the highest recorded (Figs 5, 12). TST3 is marked by the presence of high diversity values, BFN and percentage calcareous benthic foraminiferal species with a P/B ratio ranging over 50–70%. TST4 is characterized by moderate values of species diversity, BFN and percentage calcareous benthic foraminiferal species and with P/B ratio ranging over 50–65% (Figs 5, 12). Both TST1 and TST2 data points fall well within the open marine region (Fig. 12). TST3 data points largely plot in the open marine region, but also transgress into the restricted brackish littoral region (Fig. 8).
6.b. Benthic foraminiferal assemblage
6.b.1. Highstand systems tracts
In HST1, the agglutinated taxa (Ammobaculites, Haplophragmoides and Trochammina) are well distributed throughout, especially Ammobaculites khargaensis (Fig. 6). Seven benthic foraminiferal assemblages are inferred (assemblages 2–7) that are dominated by agglutinated forms (especially A. khagaensis), except in assemblages 5 and 7 that are marked by the dominance of calcareous forms, Discorbis pseudoscopos Nakkady and Elhasaella alanwoodi, respectively (see Fig. 12). HST2 has two benthic foraminiferal assemblages (assemblages 9–10) and is marked by the presence of high-organic-flux species (Neobulimina canadaensis Cushman and Wickenden, N. khagaensis Nakkady and Talaat, Bulimina prolixa Cushman and Parker, Eouvigerina aegyptiaca Nakkady, Bolivina decurrans (Ehrenberg), Praebulimina carseyae (Plummer), P. kikapooensis (Cole), Pyramidulina affinis (Hantken) and P. zippei Reuss). Assemblage 9 is marked by the dominance of shallow-water agglutinated taxa of Trochammina (T. rainwateri Cushman and Applin, T. diagonis (Carsey) and T. umiatensis Tappan) and assemblage 10 by slightly deeper water calcareous taxa, Orthokarstenia oveyi (Nakkady) and Cibicidoides decoratus (Le Roy), with accessory Reussella aegyptiaca Nakkady and Lacosteina maquawilensis Ansary and Fakhr (Fig. 12). HST3 is marked by the dominance of agglutinated Haplophragmoides, with accessory Ammobaculites and Trochammina (Figs 6, 12).
6.b.2. Transgressive systems tracts
All TSTs are marked by the dominance of calcareous forms: TST1 by Cibicidoides harperi (Sandidge) and C. pseudoacutus (Nakkady); TST2 by Elhasaella alanwoodi and Lacosteina maquawilensis Ansary and Fakhr; TST3 by Anomalinoides zitllie (Le Roy), Cibicidoides pseudoacutus and Gyroidinoides girardana (Reuss); and TST4 by Cibicidoides howelli (Toulmin) and Anomalinoides zitllie (Fig. 12).
6.c. Cretaceous–Palaeogene boundary (K/Pg)
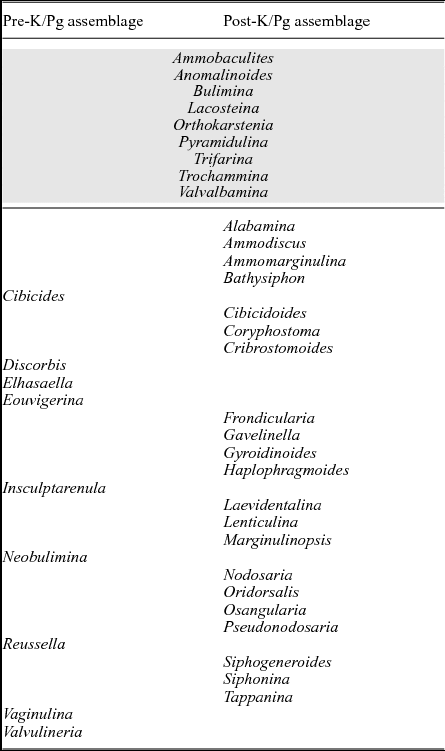
The Cretaceous–Palaeogene boundary (K/Pg) is noted between samples 200 and 201 (Figs 9, 10, 12). The changes in diversity and species composition are marked (Figs 9, 10, 12). Post-boundary (beyond sample 200) is characterized by short fluctuations and the dominance of Haplophragmoides (Figs 6, 12). Assemblage-wise, both the number of species and specimens increase post-boundary (Fig. 9) and all pre-boundary data points plot in the restricted area (Fig. 10). Species-wise, only the middle neritic species Anomalinoides aegyptiacus transgresses the boundary (Fig. 9) and assemblage-wise, very few genera (30%) are able to transgress the boundary (Table 4).
Distribution of benthic foraminiferal genera. The upper shaded part shows the occurrence of genera present during both pre- and post-K/Pg time.

6.d. High-organic-flux species
The high-organic-flux benthic foraminiferal species provide a rough estimate of the availability of nutrients within the environment. Their distribution (Table 1) provides a window to their response to changes in nutrient availability within the marine realm. These high-organic-flux species include Pyramidulina affinis, Pyramidulina zippei, Pyramidulina vertebralis (Batsch), Pyramidulina distans (Reuss), Praebulimina carseyae, Neobulimina canadaensis, Eouvigerina aegyptiaca, Reussella aegyptiaca, Neobulimina khagaensis, Praebulimina kikapooensis, Bulimina prolixa Cushman and Parker, strobila Marie, Bolivina decurrans, Praebulimina russi and Pyramidulina semispinosa (Le Roy) within the studied section. In the present study, the pre-K/Pg TST and the pre-K/Pg duration are marked by a higher abundance of organic-flux species (Fig. 10). Praebulimina, Neobulimina, Eouvigerina, Reussella and Bolivina (all bi/tri-serial and thick-shelled/heavily ornamented forms) do not cross the K/Pg boundary, whereas Pyramidulina and Bulimina transgress the boundary (particularly the former; Table 1).
A summary of all proxies, percent calcareous foraminifera, benthic foraminiferal assemblage and inferred bathymetry (relative sea level) is given in Fig. 12. Bathymetry (relative sea level) is inferred by using the presence of characteristic species, the abundance values of calcareous benthic foraminifers and the presence and abundance of planktonic foraminifers. Taken together, these proxies provide a sound estimate of the relative sea level (Figs 12, 13).
7. Discussion
The most striking feature of this Maastrichtian–Danian section is the overall abundance of benthic foraminiferal species (156) and the fact that even the most dominant species do not go beyond 6% of the total benthic assemblage (13232 specimens; 129 species do not go beyond 1%), that is, displaying a remarkably high level of equitable environment (Fig. 5). This is all the more interesting since many of the data points plot in the restricted lagoonal/littoral environment (mostly brackish and some in normal marine lagoons), rather than the normal marine environment (Figs 7, 8) as would be expected with high species diversity (Fig. 12). Additionally, in spite of the shallow and restricted depositional settings, the fauna is not stressed as even the HST fauna shows a moderate to high percentage of calcareous benthic foraminifers (except for HST3; see Figs 11, 12).
In modern faunas, Fisher's α values below 5 (restricted region) characterize environments where the restricting factor is low salinity such as in estuary and hyposaline lagoons (Murray, Reference Murray1973, Reference Murray2006), in modern hypoxic estuarine waters (fjord environments; Alve & Nagy, Reference Alve and Nagy1986; Nagy & Alve, Reference Nagy and Alve1987; Alve, Reference Alve, Hemleben, Scott, Kaminski and Kuhnt1990) and in the Triassic–Jurassic organic-rich shales (Nagy, Løfaldi & Bäckström, Reference Nagy, Løfaldi and Bäckström1988; Nagy, Pilskog & Wilhelmsen, Reference Nagy, Pilskog, Wilhelmsen, Hemleben, Kaminski, Kuhnt and Scott1990; Nagy, Hess & Alve, Reference Nagy, Hess and Alve2010). Interestingly, the present data also largely (especially the HST fauna) plot in the restricted region (see Fig. 8; 70% of the present data is <5, Fisher's α). Previous sea-level data (see Li, Keller & Stinnesbeck, Reference Li, Keller and Stinnesbeck1999; Tantawy et al. Reference Tantawy, Keller, Adatte, Stinnesbeck, Kassab and Schulte2001) also suggest that during the studied period, humid (seasonal or perennial) conditions prevailed which would have had led to increased runoff and therefore a greater influence of freshwater (low salinity) on the benthic fauna (especially during HSTs; regressive phase) (see Fig. 13). Increased runoff and concomitant shallowing would also explain the higher sand content during HST1 and HST3 (Fig. 4) and the resultant dominance of agglutinated Ammobaculites, Haplophragmoides and Trochammina throughout the studied section. Conditions of largely oligotrophic (Ammobaculites) and moderate (?) to low oxygen (Haplophragmoides and Trochammina) in brackish marginal marine waters and marsh settings are therefore envisioned. A similar association of Ammobaculites, Haplophragmoides and Trochammina has been interpreted to belong to marsh or littoral conditions with reduced salinity and, in warm climates, with increased precipitation and terrestrial runoffs (Luger, Reference Luger1988; Keller et al. Reference Keller, Adatte, Burns and Tantawy2002). Shallowing is further corroborated by the prevailing benthic species that are mostly characteristic of shallow waters (middle neritic; <100 m) such as Ammobaculites, Haplophragmoides, Trochammina, Orthokarstenia, Anomalinoides, Bulimina, Lenticulina and Cibicidoides with few open marine incursions (mostly middle to outer neritic forms; <200 m) of Cibicides, Bolivina, Eouvigerina, Praebulimina and Gyroidinoides in assemblages 1, 5, 7, 9–11 and 13 (see Fig. 12).
Much of the early Maastrichtian period was one of low species diversity (but increasing gradually) dominated by agglutinated forms, in largely oligotrophic, moderate (?) to low oxygen conditions of a brackish marginal marine or marsh settings. However, at the end of the early Maastrichtian Age, the dominance of calcareous forms (Elhasaella, Cibicides, Cibicidoides) and high-organic-flux species (Bolivina, Eouvigerina, Praebulimina and Bulimina) suggest marine incursion and possibly upwelling (high palaeoproductivity; = assemblage 7) in otherwise restricted littoral settings; possible upwelling is also the case for the upper Maastrichtian HST2, which also displays an increased presence of high-flux species.
On the other hand, the TST (TST1–4) fauna, especially TST1 (Campanian) and TST4 (Danian) (see also Fig. 12), is also marked by considerably deeper conditions (middle to? outer neritic) as reflected by the presence of marly shales (Fig. 4); this is similar to the case in the lower part of the upper Maastrichtian sediments (Fig. 4).
Additionally, most of the identified sequence boundaries (see Fig. 4) correlate well with the boundaries detected in the Eastern Desert, Sinai Peninsula, Jordan, Tunisia, Libya, Arabian Plate, Western Europe and the New Jersey continental margin (Haq, Hardenbol & Vail, Reference Haq, Hardenbol and Vail1987; Hardenbol et al. Reference Hardenbol, Thierry, Farley, Jacquin, de Graciansky, Vail, de Graciansky, Hardenbol, Jacquin and Vail1998; Li, Keller & Stinnesbeck, Reference Li, Keller and Stinnesbeck1999; Miller et al. Reference Miller, Kominz, Browning, Wright, Mountain, Katz, Sugarman, Cramer, Christie-Blick and Pekar2005; Molina et al. Reference Molina, Alegret, Arenillas, Arz, Gallala, Hardenbol, Van salis, Steurbaut, Vandenberghe and Zaghbib-Turki2006; Sebei et al. Reference Sebei, Inoubli, Boussiga, Tlig, Alouani and Boujamaoui2007; Farouk, Reference Farouk2014, Reference Farouk2016; Farouk, Marzouk & Fayez, Reference Farouk, Marzouk and Fayez2014). The Arabian Platform has experienced a complex tectonic history in addition to being widely influenced by eustatic sea-level changes (Haq & Al-Qahtani, Reference Haq and AL-Qahtani2005); both tectonics and eustasy have played important roles in the development of sedimentary sequences and the intervening hiatuses (Farouk, Reference Farouk2015). The boundary Ma/DaWD, however, is marked by a long period of hiatus in sedimentation. Other boundaries identified in the present work have no correspondences in the Arabian Platform-wide cycle charts of Haq & Al-Qahtani (Reference Haq and AL-Qahtani2005). In the present study, the KM5 and PaDa1 major cycle boundary of Haq (Reference Haq2014) may be correlated in the present study with the Ma/DaWD sequence boundary (see Fig. 4) due to erosional surface across the K/Pg unconformity.
7.a. Cretaceous–Palaeogene boundary (K/Pg)
The Cretaceous–Palaeogene boundary (K/Pg) is noted between samples 200 and 201 and between assemblages 10 and 11 (see Figs 9, 12). The dramatic change in fauna and the fact that none of the species persist beyond the boundary, between samples 200/201 (Fig. 9a), suggests a possible in-between hiatus. A broader view (of assemblages) is therefore taken to better understand changes from pre-K/Pg to post-K/Pg (Fig. 9b). Fundamentally, there is improvement in the environment after the K/Pg boundary in terms of diversity, number of species and specimens (Fig. 9c). Anomalinoides aegyptiacus, a characteristic middle neritic benthic species, transgress the boundary, suggesting not much change in palaeodepth from pre-K/Pg to post-K/Pg (Fig. 9).
As well as palaeodepth (mostly a local parameter), two major global ‘signals’ have been noted for differences after the K/Pg boundary: (1) a sudden drop in productivity (surface and bottom) and (2) reduced bottom water oxygenation followed by a gradual faunal recovery during Danian time (early Paleocene; see also Speijer et al. Reference Speijer, Schmitz, Aubry and Charisi1996). Present data suggest that in the post-K/Pg duration (Danian), there is a reduction in the abundance of high-organic-flux species (i.e. bi-/tri-serial morphogroups), suggesting a shift from more mesotrophic open marine environment (assemblage 10) to a much reduced oligotrophic condition (=assemblage 11; Fig. 13; Table 1). For higher numbers of species, BFN and diversity measures (Figs 5, 12) also indicate that neither oxygen nor nutrient availability was a deterrent in the post-boundary duration (assemblage 11; Fig. 12).
Tn the present study, the immediate post-K/Pg duration is characterized by increased species diversity, number of species and specimens in a more oligotrophic environment with little change in palaeobathymetry.
7.b. Sea-level curve
The inferred sea-level curve based on the use of characteristic benthic foraminiferal species, their abundance values (%) and the presence and abundance of planktonic foraminifers (P/B ratio) (see Figs 12, 13) replicates the regional sea-level curve of Li, Keller & Stinnesbeck (Reference Li, Keller and Stinnesbeck1999) and Tantawy et al. (Reference Tantawy, Keller, Adatte, Stinnesbeck, Kassab and Schulte2001). High sea level persisted during late Campanian time, followed by a sudden shallowing and a gradual increase throughout early Maastrichtian time (Figs 12, 13). The early Maastrichtian Age was largely a period of tectonic quiescence and of subsidence in a warm, wet, tropical and subtropical setting characterized by low seasonality contrasts (based on kaolinite conten; see also Keller et al. Reference Keller, Adatte, Burns and Tantawy2002) (Figs 12, 13). The late Maastrichtian regional tectonic activity and maximum kaolinite content indicates a higher but receding episodic sea-level trend (Fig. 13). The lowest Danian deposits (Zone P1c) record the highest sea level, humid perennial conditions and increased regional subsidence (Fig. 13). The succeeding Danian P2 Zone is marked by a rapid fall in sea level and of tectonic quiescence (Fig. 13).
It therefore appears that the inferred sea-level curve is much more influenced by the prevailing climate and global eustasy as opposed to regional tectonics (Fig. 13). Benthic foraminifera seem to reflect changes in sea level, and are a potential tool in interpreting regional sequence stratigraphy.
8. Conclusion
Maastrichtian–Danian benthic foraminiferal assemblages are analysed with respect to sequence stratigraphy (in terms of HST and TST). Overall, data suggest a remarkably highly equitable environment. Much of the data plot in the restricted littoral environment (mostly brackish and some in normal marine lagoons) rather than the normal marine environment, as would be expected with a high-diversity dataset, suggesting that the fauna are not stressed despite a shallow depositional setting. The dominance of agglutinated taxa indicates moderate (?) to low oxygen conditions in a brackish littoraland/or marsh settings with reduced salinity, possibly due to increased precipitation and terrestrial runoff. The interrupted dominance of calcareous forms and high-organic-flux species suggest occasional marine incursions and high palaeoproductivity due to local upwelling. The inferred sea-level curve from benthic foraminifera replicates the regional sea-level curve, and suggests that (1) the curve is more influenced by the prevailing climate and global eustasy rather than by regional tectonics and (2) benthic foraminifers seem to be a good proxy for evaluating sea-level changes. The post-Cretaceous–Palaeogene boundary indicates an improvement in the environment in terms of diversity, number of species and specimens with a marked reduction in the abundance of high-organic-flux species, indicating a shift from a more mesotrophic open marine environment to a much reduced oligotrophic condition.