INTRODUCTION
The last 2000 yr represent an interval of interest for the study of natural climate variability and its interaction with anthropic activities. Climate changes during this interval are relatively well documented from European historical and climate proxy records as a succession of warm and cold phases associated with the Roman Warm Period, Dark Ages Cold Period, Medieval Warm Period, and Little Ice Age (LIA) (e.g., Desprat et al., Reference Desprat and Goñi2003; Helama et al., Reference Helama, Jones and Briffa2017). However, little is known about the magnitude and pacing of climate changes in eastern Canada during this time interval because of limited historical data, the oldest dating from the European colonization in the sixteenth century (e.g., Ramsden, Reference Ramsden1978).
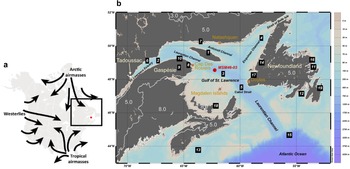
In southeastern Canada, the Gulf of St. Lawrence (GSL) is an epicontinental sea connected to the North Atlantic through the Strait of Belle Isle and the Cabot Strait (Fig. 1). It is characterized by large amounts of freshwater runoff from the Great Lakes and the watershed of the St. Lawrence River (Koutitonsky and Bugden, Reference Koutitonsky, Bugden and Therriault1991; Galbraith et al., Reference Galbraith, Chassé, Caverhill, Nicot, Gilbert, Lefaivre and Lafleur2019). Hence, the GSL behaves like a large estuarine system with strongly stratified waters. The shallow surface-water layer has high nutrient content, low thermal inertia, and very large seasonal temperature contrasts (Koutitonsky and Bugden, Reference Koutitonsky, Bugden and Therriault1991; Saucier et al., Reference Saucier, Roy and Gilbert2003). The confluence of different air masses in the study region (Fig. 1) makes this an ideal location for reconstructing climate change associated with air-mass circulation patterns, while close linkages between the hydrological budget of the watershed and surface-water salinity provide complementary information for the interpretation of regional climate on land. It is also an area of high biological productivity and diversity, which plays a role in the carbon cycle. Understanding the response of this complex ecosystem to past climate changes is pivotal for predicting the impacts of future climate changes.
(a) Map of North America showing the main air-mass trajectories over eastern Canada (modified from Pratte et al., Reference Pratte, Garneau and De Vleeschouwer2017). (b) Location map of core site MSM46-03 (in red), nearby climate stations (in yellow; Natashquan, Cap Des Rosiers, Doyles, Magdalen Islands), and level I ecoregions (white numbers) in areas surrounding the GSL as classified by the Commission for Environmental Cooperation (1997). Classification codes: 3.0, Taiga; 5.0, Northern Forests; 8.0, Eastern Temperate Forests. The numbers in black squares indicate the location of cores and study sites mentioned in the text. 1, Observation peatland on Anticosti Island (Lavoie and Filion, Reference Lavoie and Filion2001; Sauvé, Reference Sauvé2016); 2, St. Lawrence Estuary (SLE), COR0602-42PC (Lemay-Tougas, Reference Lemay-Tougas2014) and MD99-2220 (de Vernal et al., Reference de Vernal, Hillaire-Marcel, Rochon, Fréchette, Henry, Solignac and Bonnet2013a); 3, COR0503-37PC (Dhahri, Reference Dhahri2010; Genovesi et al., Reference Genovesi, de Vernal, Thibodeau, Hillaire-Marcel, Mucci and Gilbert2011); 4, CR06-TCE (Thibodeau et al., Reference Thibodeau, de Vernal and Limoges2013); 5, 89-007-111 (de Vernal et al., Reference de Vernal, Guiot and Turon1993); 6, Baie-Comeau peatlands (Magnan and Garneau, Reference Magnan and Garneau2014; Sauvé, Reference Sauvé2016); 7, Havre-Saint-Pierre peatlands (Magnan and Garneau, Reference Magnan and Garneau2014; Sauvé, Reference Sauvé2016); 8, Petit Lac Bouchard and 9, Lac du Triangle lake sediments (Asnong and Richard, Reference Asnong and Richard2003); 10, Lac à Euloge and Lac J'Arrive lake sediments (Marcoux and Richard, Reference Marcoux and Richard1995); 11, AI07-04BC/03G, Bonavista Bay (Solignac et al., Reference Solignac, Seidenkrantz, Jessen, Kuijpers, Gunvald and Olsen2011; Sicre et al., Reference Sicre, Weckström, Seidenkrantz, Kuijpers, Benetti, Masse and Ezat2014); 12, AI07-11BC/12G, Placentia Bay (Jessen et al., Reference Jessen, Solignac, Nørgaard-Pedersen, Mikkelsen, Kuijpers and Seidenkrantz2011; Solignac et al., Reference Solignac, Seidenkrantz, Jessen, Kuijpers, Gunvald and Olsen2011; Sicre et al., Reference Sicre, Weckström, Seidenkrantz, Kuijpers, Benetti, Masse and Ezat2014); 13, 95-030-24 (Levac, Reference Levac2001); 14, MD99-2225, Bay of Islands (Levac, Reference Levac2003); 15, MD95-2033 (Balestra et al., Reference Balestra, Bertini, de Vernal, Monechi and Reale2013); 16, Nordan's Pond Bog (Hughes et al., Reference Hughes, Blundell, Charman, Bartlett, Daniell, Wojatschke and Chambers2006); 17, Robinsons and Joe's Ponds (McCarthy et al., Reference McCarthy, Collins, McAndrews, Kerr, Scott and Medioli1995); 18, Baltic Bog (Peros et al., Reference Peros, Chan, Magnan, Ponsford, Carroll and McCloskey2016); 19, Avalon Peninsula (Macpherson, Reference Macpherson1982). The map was made with Ocean Data View.

Instrumental observations reveal significant changes in the GSL region over the last decades. Warming and decreasing oxygen concentrations in the bottom waters causing hypoxia in the gulf and the lower St. Lawrence Estuary (SLE) have been recorded since the 1930s (Gilbert et al., Reference Gilbert, Sundby, Gobeil, Mucci and Tremblay2005; Galbraith et al., Reference Galbraith, Chassé, Caverhill, Nicot, Gilbert, Lefaivre and Lafleur2019). Moreover, data indicate a marked decrease of sea ice since 2010 (Galbraith et al., Reference Galbraith, Chassé, Caverhill, Nicot, Gilbert, Lefaivre and Lafleur2019) and a general trend of increasing air temperature and sea-surface temperature (SST) of 0.9 ± 0.3°C and 0.5 ± 0.3°C per decade, respectively (Galbraith et al., Reference Galbraith, Larouche, Chassé and Petrie2012).
On longer timescales, beyond the recent instrumental records, some regional studies permit documentation of past climates from the analyses of micropaleontological and geochemical records of marine sediment cores as well as terrestrial and coastal sedimentary sequences. At the scale of the Holocene, the studies by de Vernal et al. (Reference de Vernal, Guiot and Turon1993, Reference de Vernal, Hillaire-Marcel, Rochon, Fréchette, Henry, Solignac and Bonnet2013a), Levac (Reference Levac2001, Reference Levac2003), Solignac et al. (Reference Solignac, Seidenkrantz, Jessen, Kuijpers, Gunvald and Olsen2011), Dhahri (Reference Dhahri2010), Thibodeau et al. (Reference Thibodeau, de Vernal and Limoges2013), Balestra et al. (Reference Balestra, Bertini, de Vernal, Monechi and Reale2013), and Lemay-Tougas (Reference Lemay-Tougas2014) led to reconstruction of sea-surface and bottom-water conditions at several sites from the GSL and nearshore Atlantic Canada (Fig. 1). Results indicate important variations of SSTs throughout the Holocene. However, none of the abovementioned records provide a temporal resolution suitable to resolve centennial to decadal variability of hydrographical conditions. In terrestrial areas surrounding the GSL, pollen, spores, and testate amoebae preserved in peat bogs and lake sediments show changes in the vegetation coupled with large variations in water table depth (e.g., McCarthy et al., Reference McCarthy, Collins, McAndrews, Kerr, Scott and Medioli1995; Hughes et al., Reference Hughes, Blundell, Charman, Bartlett, Daniell, Wojatschke and Chambers2006; Magnan and Garneau, Reference Magnan and Garneau2014; Peros et al., Reference Peros, Chan, Magnan, Ponsford, Carroll and McCloskey2016; Sauvé, Reference Sauvé2016; Fig. 1), suggesting climate variations accompanied with changes in precipitation regimes.
In this context, we focus on the central part of the GSL with the aim of producing a palynological record of the last 2000 yr with multidecadal resolution. Our study includes the analysis of dinocyst assemblages to reconstruct the natural variations of sea-surface conditions, including temperature, salinity, sea-ice cover, and primary productivity (cf. de Vernal et al., Reference de Vernal, Henry, Matthiessen, Mudie, Rochon, Boessenkool, Eynaud, Grøsfjeld, Guiot and Hamel2001, Reference de Vernal, Rochon, Fréchette, Henry, Radi and Solignac2013b, Reference de Vernal, Radi, Zaragosi, Van Nieuwenhove, Rochon, Allan and De Schepper2020), which are parameters intimately related to climate. Our analyses also include pollen and spores, with the aim of making direct correlation with onshore vegetation history of surrounding lands and establishing linkages between onshore and offshore climate history. The high temporal resolution allows us to capture the events that punctuated the otherwise long-term climate changes. A secondary objective of our study is to evaluate the impact of the ongoing global anthropogenic warming on regional climate. This work adds a new piece of information to document regional climate changes and provides a framework for the climatic conditions or stresses that the Indigenous populations and European migrants have experienced.
REGIONAL SETTING
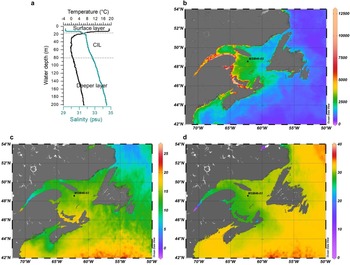
The GSL covers an area of about 235,000 km2 and represents 35,000 km3 of water, including the SLE (Galbraith et al., Reference Galbraith, Larouche, Chassé and Petrie2012). The dominant bathymetric feature is the Laurentian Channel, which is over 250 m deep and ~1240 km long. It extends from the southeastern Canadian continental shelf all the way to the mouth of the Saguenay Fjord near Tadoussac (Fig. 1). The circulation in the Laurentian Channel is estuarine, with water flowing seaward in the surface layer, which is about 50 m thick, and landward in the deep layer (Saucier et al., Reference Saucier, Roy and Gilbert2003). At greater depths, warm and oxygen-poor North Atlantic Central Water as well as cold and oxygen-rich Labrador Current Water (LCW) intrude through the main channels (Gilbert et al., Reference Gilbert, Sundby, Gobeil, Mucci and Tremblay2005). At the surface, freshwater runoff from the watershed enters the GSL through the estuary and from rivers of the north shore. The gulf receives about 600 km3 of freshwater annually, 84% of which is from the St. Lawrence River System (cf. Koutitonsky and Bugden, Reference Koutitonsky, Bugden and Therriault1991). Based on annual climatological means of 1981–2010, runoff from the St. Lawrence River and all other major rivers draining into separate gulf regions have a total of 20,852 m3/s (Galbraith et al., Reference Galbraith, Chassé, Caverhill, Nicot, Gilbert, Lefaivre and Lafleur2019). Because of the large freshwater discharge, the estuary–gulf system is marked by a pronounced salinity gradient, with surface salinities varying from an annual average of <28 psu at the head of the Laurentian Channel to about 31 psu at the Cabot Strait (Seidov et al., Reference Seidov, Baranova, Johnson, Boyer, Mishonov and Parsons2016; Fig. 2d). In addition, surface water in the northeast part of the GSL is influenced by LCW that enters the area via the Strait of Belle Isle (see Fig. 2d). The wind regime in eastern Canada is currently governed by the relative strength of three major air masses: the modified mild dry Pacific air mass from the west, the cold dry Arctic air mass from the north and northwest, and the warm moist Atlantic Maritime Tropical air mass from the south (Bryson, Reference Bryson1966; Bryson and Hare, Reference Bryson, Hare, Bryson and Hare1974; Fig. 1).
(a) Temperature and salinity profile at site MSM46-03 in August 2015 showing the three water layers: the surface layer, the cold intermediate layer (CIL), and the deeper layer. (b) Map of primary productivity (mgC/m2/day) in August 2015 based on the standard VGPM algorithm (Behrenfeld and Falkowski, Reference Behrenfeld and Falkowski1997). (c, d) Maps of summer (July–September) temperature (°C) and salinity (psu) at the surface based on 1955–2012 statistical mean (NOAA Northwest Atlantic regional climatology; Seidov et al., Reference Seidov, Baranova, Johnson, Boyer, Mishonov and Parsons2016).

The water column of the GSL is highly stratified, with three distinct layers: the surface layer, the cold intermediate layer (CIL), and the deeper layer (Galbraith et al., Reference Galbraith, Larouche, Chassé and Petrie2012; Fig. 2a). The surface waters are characterized by low salinity and relatively high temperature in summer because of mixing with continental runoff, whereas the deep waters that originate from Atlantic and Labrador shelf waters are saltier and colder (Saucier et al., Reference Saucier, Roy and Gilbert2003; Gilbert et al., Reference Gilbert, Sundby, Gobeil, Mucci and Tremblay2005; Galbraith et al., Reference Galbraith, Larouche, Chassé and Petrie2012). Surface temperature typically reaches maximal values averaging 15.6°C (1985–2010) from mid-July to mid-August, followed by a gradual cooling and freezing in winter (Galbraith et al., Reference Galbraith, Chassé, Caverhill, Nicot, Gilbert, Lefaivre and Lafleur2019). The surface layer thickens in winter and reaches near-freezing temperatures (−1.8°C to 0°C; Galbraith, Reference Galbraith2006).
At the study site, mean summer (July to September) SST and sea-surface salinity (SSS) from 1955 to 2012 are 14.0 ± 2.1°C and 29.3 ± 1.0 psu, respectively (Seidov et al., Reference Seidov, Baranova, Johnson, Boyer, Mishonov and Parsons2016; Fig. 2c and d). The seasonal duration of sea-ice cover in the central gulf region is 2.5 ± 1.0 months/yr based on the 1985–2010 instrumental data (Galbraith et al., Reference Galbraith, Chassé, Caverhill, Nicot, Gilbert, Lefaivre and Lafleur2019). Upwelling occurs in the GSL at the head of the Laurentian Channel and in coastal areas (e.g., Saucier et al., Reference Saucier, Roy and Gilbert2003; Galbraith et al., Reference Galbraith, Larouche, Chassé and Petrie2012), contributing to high primary productivity as estimated from satellite data. For example, the estimation of net primary production based on chlorophyll data from the Moderate Resolution Imaging Spectroradiometer (MODIS) program and calculated with the Vertical Generalized Production Model (VGPM; Behrenfeld and Falkowski, Reference Behrenfeld and Falkowski1997) is 311 gC/m2/yr at the study core site, with mean summer primary productivity of 1897 ± 488 mgC/m2/day (MODIS R2018 data; Fig. 2b; original data available at http://science.oregonstate.edu/ocean.productivity/index.php).
The GSL area is characterized by a mild, cool, and moist climate due to the proximity of the Atlantic Ocean, with long winters and relatively short summers (Agriculture and Agri-Food Canada, 2013). According to the 1981–2010 climate data at the four stations closest to the study site (Fig. 1), maximum temperature is reached in July or August with mean summer temperatures of 14.8°C at Cap Des Rosiers, 15.2°C at Doyles, 16.3°C in the Magdalen Islands, and 13.1°C at Natashquan. Mean winter temperatures are −8.1°C, −4.9°C, −6.2°C, and −11.7°C at the above stations, respectively. Annual precipitation is exceptionally high at Doyles, averaging 1505 mm. Elsewhere, it ranges between 1037 and 1195 mm.
In the surrounding land, the regional climate results in the development of coniferous forests of the Northern Forests ecoregion in the north and mixed conifer-hardwood forests of the Eastern Temperate Forests ecoregion in the southwest (e.g., Commission for Environmental Cooperation, 1997; Fig. 1). In the north, cool climate, short growing season, and frequent forest fires result in a forest vegetation dominated by balsam fir (Abies balsamea), black spruce (Picea mariana), white spruce (Picea glauca), and paper birch (Betula papyrifera). Jack pine (Pinus banksiana) is rare, and white pine (Pinus strobus) is present on Anticosti Island but not abundant. The forests are often mixed with bogs, marshes, and other wetlands. Southwest of the GSL, the vegetation is characterized by a mixture of coniferous and deciduous trees. In addition to firs, spruces, and birches, thermophilic trees like maple (Acer), hemlock (Tsuga), and beech (Fagus) are found in the forest. White pine is more frequent, and jack pine is still rare.
MATERIALS AND METHODS
The study sequence includes a 36-cm-long multicore and a 901-cm-long gravity core from site MSM46-03 (48°33.02′N, 62°14.95′W; water depth = 449 m) in the Laurentian Channel. The internal diameters of the multicorer and the gravity corer are 10 and 12 cm, respectively. The multicore device that penetrates the seafloor slowly yields undisturbed samples of surface sediment, while the gravity core allows recovery of deeper sediments. The cores were collected during the Maria S. Merian expedition MSM 46 in August 2015 (Pollehne, Reference Pollehne2015). The seismic profile and previous studies of a nearby site show that the coring location is characterized by high sedimentation rate suitable for our study, which requires high temporal resolution (Cauchon-Voyer et al., Reference Cauchon-Voyer, Henry, Desrosiers, Lajeunesse, Locat, Rochon and St-Onge2005). The sediments consist mostly of light olive gray silty clay with black faint sulfidic layers occurring throughout the upper 143 cm of the gravity core. The sulfidic layers indicate reducing environments that are generally rich in organic material. The core sediment was subsampled at 1-cm intervals. The total organic carbon was calculated from the difference between the total carbon and the toral inorganic carbon concentrations (see Supplementary Material 1 for detail).
Chronology
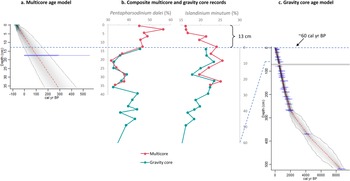
The chronology of the multicore MSM46-03-05-MUC3 and the gravity core MSM46-03-12-GC was established based on accelerator mass spectrometry (AMS) 14C dates, 1 in the multicore and 22 in the gravity core (Table 1). The interval from 69 to 74 cm in the gravity core has been excluded due to redeposition, as it consists of a sandy layer, and the radiocarbon date from this depth indicates age reversal (Table 1). The AMS radiocarbon dates were calibrated using the Marine13 calibration curve (Reimer et al., Reference Reimer, Bard, Bayliss, Beck, Blackwell, Ramsey, Buck, Cheng, Edwards and Friedrich2013). A correction for marine reservoir effect was estimated from the database of Reimer and Reimer (Reference Reimer and Reimer2001) and McNeely et al. (Reference McNeely, Dyke and Southon2006). This yielded delta R (ΔR) values of 246 ± 169 yr, in addition to the conventional 400 yr of air–sea reservoir difference. To establish independent age–depth relationships in both cores, we used the Bacon package (Blaauw and Christen, Reference Blaauw and Christen2011) available on the R interface (R Development Core Team, 2013). Bacon uses Bayesian statistics to reconstruct accumulation histories for deposits through a high number of Markov chain Monte Carlo iterations. The age model indicates that the upper 520 cm of the gravity core encompasses the last ~8500 yr with sedimentation rates of 0.3–1.7 mm/yr (Fig. 3c). In this study, we focus on the upper 230 cm of the gravity core, which spans the last two millennia. Sedimentation rate averages 1.4 mm/yr in this section.
Accelerator mass spectrometry (AMS) radiocarbon dates of multicore MSM46-03-05-MUC3 and gravity core MSM46-03-12-GC with corresponding calibrated ages.a

a The calibration data set was Marine13 (Reimer et al., Reference Reimer, Bard, Bayliss, Beck, Blackwell, Ramsey, Buck, Cheng, Edwards and Friedrich2013).
b Laboratory codes: AWI, MICADAS laboratory at Alfred Wegener Institute; ETH, ETH Zurich. The shaded radiocarbon date was excluded due to redeposition from 69 to 74 cm in the gravity core.
Composite sequence and age vs. depth relationship in the multicore and the gravity core at site MSM46-03. The age models are based on 14C dates in (a) the multicore MSM46-03-05-MUC3 and (c) the gravity core MSM46-03-12-GC using Bacon software (Blaauw and Christen, Reference Blaauw and Christen2011). Calibrated age ranges are shown in semi-transparent blue. The semi-transparent blue-green symbol at the top of part a corresponds to the coring date (2015 CE). Grayscales indicate probability, where darker gray indicates more likely ages. Red dashed line represents median values, and gray dashed lines represent 95% confidence ranges. The horizontal gray zone in part c represents the redeposition zone from 69 to 74 cm in the gravity core. (b) Curves of Pentapharsodinium dalei and Islandinium minutum percentages allow establishment of the correlation between the multicore and the gravity core.

Percentages of two dominant dinocyst taxa, Pentapharsodinium dalei and Islandinium minutum, were used to correlate the multicore and the top of the gravity core (Fig. 3b). The correlation suggests an overlap between the two cores and a missing layer of about 13 cm at the top of the gravity core. Hence, we were able to create a composite sequence at site MSM46-03 with a continuous chronology from 1700 to –65 cal yr BP (250 to 2015 CE). The transition from the multicore record to the gravity core record was made at 13 cm in the gravity core.
Palynological analysis
In the multicore, which encompasses ~300 yr, the palynological analyses were performed at 2 cm intervals in the upper 9 cm and at 4 cm intervals below, which provides a multidecadal time resolution. In the gravity core, the upper 230 cm generally was analyzed at 4 cm intervals, which provides a temporal resolution of 10 to 40 yr (see Supplementary Table 1 for details on sampling depths).
Samples were processed for palynological analyses according to the protocol described by de Vernal et al. (Reference de Vernal, Henry and Bilodeau1999). See also Supplementary Material 1 for details. Because the sediment contains abundant organic debris, we used a solution of KOH to deflocculate the fine sediment. Such treatment, which oxidizes organic matter, is usually avoided for isolation of dinocysts, because some taxa, notably the cysts of protoperidiniales, could be damaged (e.g., Zonneveld et al., Reference Zonneveld, Versteegh and Kodrans-Nsiah2008). Hence, we used a very gentle treatment with 5% KOH for 10 to 15 minutes. We tested this treatment to ensure the preservation of dinocysts. Four samples were treated with and without KOH. As presented in Supplementary Table 2, there is no evidence for reduction of dinocyst concentration or selective oxidation of certain species. The identification and counting of common palynomorphs were made under an optical microscope with transmitted light at magnifications of 400× and 1000×. We routinely identified most palynomorphs, which include pollen grains, spores, dinocysts, and organic linings of benthic foraminifera. We also counted what we interpret to be reworked palynomorphs based on their identification and preservation states. The detailed counts are presented in Supplementary Table 1.
One Lycopodium clavatum spore tablet per sample was added before chemical and mechanical treatments for further estimation of the absolute abundances of palynomorphs (e.g., Faegri and Iversen, Reference Faegri and Iversen1964). A minimum of 300 specimens of dinocysts were counted in each sample to provide statistically reliable counts (e.g., Mertens et al., Reference Mertens, Verhoeven, Verleye, Louwye, Amorim, Ribeiro, Deaf, Harding, De Schepper and Gonzalez2009). Relative abundances of dinocyst taxa are presented as percentages of the total number of counted dinocyst specimens (Figs. 4 and 5). The number of pollen grains counted ranges from 300 to 500 and that of spores ranges from 10 to 60 per sample. The results are presented as percentages of the pollen taxa versus the total number of pollen grains, and the percentages of spore taxa are reported versus the total number of spores (Figs. 4 and 6). All results are reported in Supplementary Table 3. The taxonomic nomenclature of dinocysts was mainly based on Rochon et al. (Reference Rochon, de Vernal, Turon, Matthiessen and Head1999) and Radi et al. (Reference Radi, Bonnet, Cormier, de Vernal, Durantou, Faubert and Head2013). Pollen grains and spores were identified mainly based on the atlases and identification keys of Richard (Reference Richard1970) and McAndrews et al. (Reference McAndrews, Berti and Norris1973). Distinction between pollen grains of Betula tree and Betula shrub was based on grain size. Betula grains > 20 μm were classified as Betula tree and those < 20 μm as Betula shrub (cf. Mudie, Reference Mudie1982; Mäkelä, Reference Mäkelä1996).
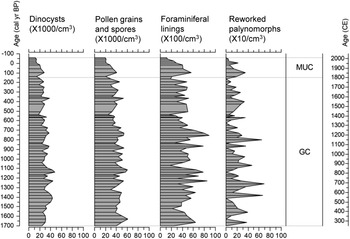
Concentrations of dinocysts; pollen grains and spores; organic foraminiferal linings; and reworked palynomorphs (number of specimens/cm3 of sediment) in composite sequence MSM46-03. MUC, multicore; GC, gravity core.

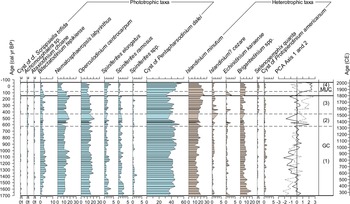
Percentages of the main dinocyst taxa and stratigraphic plot of principal component analysis (PCA) axis 1 (black solid line) and axis 2 (gray dashed line) sample scores in composite sequence MSM46-03. MUC: multicore; GC: gravity core. Horizontal gray dashed lines and numbers in brackets indicate zones defined by PCA scores mentioned in the text.

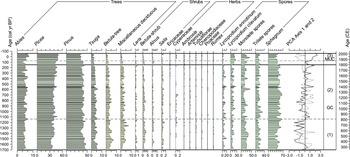
Percentages of pollen and spore taxa and stratigraphic plot of principal component analysis (PCA) axis 1 (black solid line) and axis 2 (gray dashed line) sample scores for the pollen assemblages in composite sequence MSM46-03. MUC, multicore; GC, gravity core. Horizontal gray dashed lines and numbers in parentheses correspond to zones defined by PCA scores. Pollen percentages and spore percentages were calculated on the pollen sum and spore sum, respectively. For some rare (<1%) and occasional taxa, occurrence is indicated by a dot. Betula trees correspond to pollen grains larger than 20 μm and vice versa for Betula shrubs. Miscellaneous deciduous taxa include Acer, Quercus, Carpinus/Ostrya, Corylus, Carya, Castanea, Fraxinus, Juglans, Tilia, and Ulmus. Trilete spores include those other than Lycopodium and Sphagnum.

Quantitative treatment and reconstruction of sea-surface conditions
Multivariate analysis was performed on dinocyst data as well as pollen data using CANOCO 5 software (ter Braak and Šmilauer, Reference ter Braak and Šmilauer2012) to help define zonations. A square-root transformation was applied to dinocyst taxa abundances to reduce the effect of very dominant taxa, while logarithmic transformation was applied to pollen taxa abundances to obtain higher explained variation by the first two components. Occasional taxa found in low numbers and in less than five samples were excluded from the analysis. Sample scores for the first (PC1) and second (PC2) principal components are reported in Supplementary Table 3. Each principal component axis has an eigenvalue expressed as a percentage that represents the amount of variation explained by the axis.
The sea-surface parameters, including summer SSS, summer SST, sea-ice cover, and summer productivity, were reconstructed from dinocyst data using the modern analog technique (MAT; cf. Guiot and de Vernal, Reference Guiot, de Vernal, Hillaire-Marcel and De Vernal2007). The software package developed by Guiot in the R environment (http://cran.r-project.org) and the latest modern dinocyst database (de Vernal et al., Reference de Vernal, Radi, Zaragosi, Van Nieuwenhove, Rochon, Allan and De Schepper2020) were used to perform the MAT. The database includes abundances of 71 dinocyst taxa at 1968 sites across the Northern Hemisphere. A validation test yielded root-mean-square error of prediction of ±1.9 psu for summer SSS, ±1.9°C for summer SST, ±1.5 months/yr for sea-ice cover, and ±653 mgC/m2/day for summer productivity. The distance of the modern analogs is used as an indicator of the reliability of the analogs. In the case of the n = 1968 database, the threshold distance for analog after log transformation of the taxa occurrences is 1.2.
Pollen grains and spores in marine sediments such as those of the GSL originate from distal sources through eolian and fluvial transports (de Vernal and Giroux, Reference de Vernal and Giroux1991). Therefore, we did not attempt quantitative reconstructions of climate parameters.
RESULTS
Palynological assemblages
Pollen grains and spores are the most abundant palynomorphs in the samples (~40,000 grains/cm3; Fig. 4; Supplementary Table 4). Dinocysts are slightly less abundant, with concentrations around 30,000 cysts/cm3. Foraminiferal lining concentrations fluctuate around 5000 linings/cm3. Reworked palynomorph concentrations are low, ranging from 0 to 700/cm3. Concentrations of pollen grains and spores, dinocysts, foraminiferal linings, and reworked palynomorphs are relatively stable throughout the record.
The total organic carbon content averages 1.8% in the section analyzed. From sedimentation rates that average 1.4 mm/yr, we calculate fluxes of the order of 103 dinocysts/cm2/yr, which represents high fluxes as compared with many regions of the Northern Hemisphere (de Vernal et al., Reference de Vernal, Radi, Zaragosi, Van Nieuwenhove, Rochon, Allan and De Schepper2020). Together, the high organic carbon content and the dinocyst fluxes suggest high pelagic production.
Dinocyst assemblages
Cysts of P. dalei, I. minutum, Operculodinium centrocarpum, Nematosphaeropsis labyrinthus, and Brigantedinium spp. are the dominant taxa throughout the record (Fig. 5). The assemblages indicate a temperate environment, with a high seasonality of temperature, as suggested by the occurrence of both warm SST-related and sea ice–related taxa. For example, Bitectatodinium tepikiense occurs mostly at mid-latitudes of the North Atlantic but tolerates freezing winter conditions; it is more abundant where summer temperatures are higher than 10°C (Rochon et al., Reference Rochon, de Vernal, Turon, Matthiessen and Head1999; de Vernal and Marret, Reference de Vernal, Marret, Hillaire-Marcel and De Vernal2007; de Vernal et al., Reference de Vernal, Radi, Zaragosi, Van Nieuwenhove, Rochon, Allan and De Schepper2020). Islandinium spp. are shown to occur in areas characterized by seasonal sea-ice cover (e.g., Rochon et al., Reference Rochon, de Vernal, Turon, Matthiessen and Head1999; de Vernal et al., Reference de Vernal, Hillaire-Marcel, Rochon, Fréchette, Henry, Solignac and Bonnet2013a). In addition, the relatively high species diversity of the dinocyst assemblage together with the dominance of phototrophic taxa such as P. dalei, O. centrocarpum, and N. labyrinthus suggests a high primary productivity, as commonly observed in productive environments from the North Atlantic (cf. de Vernal and Marret, Reference de Vernal, Marret, Hillaire-Marcel and De Vernal2007).
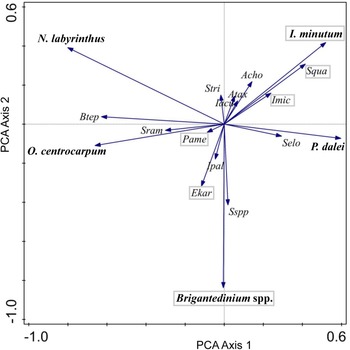
Multivariate analyses were performed on dinocyst data to characterize patterns of variation in the occurrence of 18 main taxa (Fig. 7). Response data have a gradient of 0.6 SD units long, so linear method and principal component analysis (PCA) is recommended (ter Braak and Šmilauer, Reference ter Braak and Šmilauer2012). The first and second axes explain 17.8% and 13.5% of the variance, respectively. PC1 is marked by a strong opposition between some phototrophic species (O. centrocarpum, B. tepikiense, N. labyrinthus, Spiniferites ramosus) on the negative side and Islandinium? cezare, Spiniferites elongatus, Islandinium minutum, Selenopemphix quanta, and P. dalei on the positive side. PC2 shows high scores of N. labyrinthus and I. minutum on the positive side, opposed to Brigantedinium spp., Spiniferites spp., and Echinidinium karaense on the negative side.
Ordination diagram of the dinocyst taxa from MSM46-03 cores. Principal component analysis (PCA) axis 1 eigenvalue = 17.8%; PCA axis 2 eigenvalue = 13.5%. Taxa are indicated by species name for dominant taxa and by four-letter abbreviations for the others (Imic, Islandinium? cezare; Stri, cyst of cf. Scrippsiella trifida; Btep, Bitectatodinium tepikiense; Pame, cyst of Protoperidinium americanum; Ipal, Impagidinium pallidum; Squa, Selenopemphix quanta; Ekar, Echinidinium karaense; Iacu, Impagidinium aculeatum; Acho, Achomosphaera sp.; Atax, Ataxiodinium choane; Selo, Spiniferites elongatus; Sram, Spiniferites ramosus; Sspp, Spiniferites spp.) Heterotrophic taxa are distinguished from phototrophic taxa by gray boxes around their names.

The stratigraphic plot of PC1 and PC2 sample scores helped to define assemblage zones. Zone 1 represents the interval before about 625 cal yr BP (1325 CE). It is characterized by generally negative or low values of both PC1 and PC2. This is related to high percentages of Brigantedinium spp., Spiniferites taxa, P. dalei, and B. tepikiense and low percentages of Islandinium. After 625 cal yr BP (1325 CE) and before 430 cal yr BP (1520 CE), the assemblages are unstable, as shown by PC1 and PC2 fluctuations, which characterize zone 2. In zone 3, from 430 to 80 cal yr BP (1520–1870 CE), high PC2 scores are recorded with low percentages of Brigantedinium spp. relative to high percentages of Islandinium. Finally, zone 4, spanning from 80 cal yr BP to the present (1870–2015 CE) is marked by highly positive PC1 values and negative PC2 values, which correspond to an increase of P. dalei and S. elongatus percentages and a decrease of Islandinium, N. labyrinthus, and B. tepikiense.
Pollen and spore assemblages
Pollen assemblages are dominated by conifer taxa, including Picea, Pinus, and Abies (Fig. 6). They are accompanied by the conifer Tsuga and a deciduous taxon Betula in relatively high percentages (1%–7%). In addition to Betula, miscellaneous deciduous taxa include predominantly Acer, Quercus, Carpinus/Ostrya, and rarely, Carya, Castanea, Fraxinus, Juglans, Tilia, and Ulmus. Some shrub taxa, including Betula, Alnus, Salix, and Corylus, are present, while herb taxa are rare, the most frequent one being Cyperaceae. The spores are dominated by Sphagnum. The pollen data are compatible with inputs from the coniferous-hardwood forest vegetation in lands surrounding the GSL. The record is characterized by increasing Picea pollen percentages, relative to the decrease of Pinus and Tsuga and pollen of deciduous trees, including Betula, over the last 1700 yr.
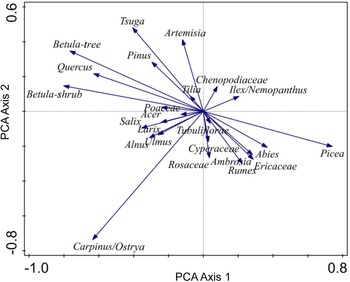
PCA was performed based on the percentages of the 24 main pollen taxa (Fig. 8). Response data have a gradient of 0.7 SD units long, suggesting that a linear method such as PCA is appropriate. PC1 and PC2 explain 29.6% and 13.7% of the variance, respectively. PC1 is characterized by a strong opposition between Picea on the positive side and pollen of deciduous tree species (Betula, Quercus, Carpinus/Ostrya) on the negative side. PC2 is characterized by a large distance between Carpinus/Ostrya and other taxa.
Ordination diagram of the pollen taxa from cores MSM46-03. Principal component analysis (PCA) axis 1 eigenvalue = 29.6%; PCA axis 2 eigenvalue = 13.7%.

Three main assemblage zones can be distinguished. In zone 1, corresponding to the interval before 1140 cal yr BP (810 CE), low values of PC1 and PC2 correspond to low percentages of Picea and high percentages of deciduous tree taxa in the assemblages. In zone 2, spanning a large part of the last millennium (~810–1880 CE), scores of PC1 and PC2 fluctuate around 0 together with a slight increase of PC1 as the result of gradual increase of Picea relative to pollen of other conifers (Pinus, Tsuga) and deciduous trees (e.g., Betula). Finally, in zone 3, which corresponds to the most recent interval, from ~1880 to 2015 CE, PC1 continued to increase, but PC2 scores were significantly lower than in zone 2, which corresponds to an increase of Abies relative to a rapid decrease of Pinus percentages.
Reconstruction of sea-surface conditions
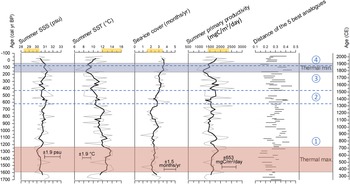
The reconstruction of sea-surface parameters (Fig. 9) from dinocyst data yielded estimates that we consider as reliable as possible according to the criteria proposed by de Vernal et al. (Reference de Vernal, Hillaire-Marcel, Rochon, Fréchette, Henry, Solignac and Bonnet2013a): (1) the counted dinocyst sums were all above 300; and (2) the distance of the analogs ranged from 0.1 to 0.5 and never exceeded 0.6, which is well below the threshold of 1.2.
Reconstructed summer sea-surface salinity (SSS), summer sea-surface temperature (SST), sea-ice cover, and summer primary productivity (gray curves) from dinocyst assemblages in the composite sequence MSM46-03, and distance of the five closest analogs. Bold black curves represent smoothed values over a window of five consecutive data points. Horizontal red and blue bands correspond to climate intervals mentioned in the text in reference to reconstructions, while dashed lines correspond to the transitions established from the principal component analysis (PCA; see Figs. 5 and 6). Yellow zones on the upper axis represent modern average values of each parameter (SST, SSS: 1955–2012; sea-ice cover: 1985–2010; primary productivity: 2002–2019). The bars indicate error of prediction from the modern analog technique (MAT; see “Materials and Methods”).

Reconstructed summer SST ranges from 6°C to 14°C with a maximum between 1590 and 1230 cal yr BP (360–720 CE) of 12°C to 14°C, which is close to modern values. This warm phase corresponds to 2–2.5 months of sea-ice cover in winter, summer SSSs of 30–30.5 psu, and summer primary productivity of more than 1500 mgC/m2/day. After this warm phase, the dinocyst-based reconstruction suggests that there was a shift toward cooler conditions, with summer SSTs gradually decreasing to ~9°C on the average. This long-term cooling was interrupted by a brief event of warm summer SSTs (>12°C) and short winter sea-ice seasons (< 2 months/yr) around 750 cal yr BP (1200 CE). A particularly cold pulse is recorded from 170 to 40 cal yr BP (1780–1910 CE). It was accompanied by increased winter sea-ice duration up to 4 months/yr and decreased primary productivity to values as low as 900 mgC/m2/day, while SSSs reached 31.8 psu.
The record of the last century suggests warming of surface waters in summer, increasing primary productivity, and a decrease of SSS. This corresponds to a gradual shift toward modern values. This record is characterized by antiphase variations of summer SSS and SST.
DISCUSSION
Comparison of marine and terrestrial pollen records
The pollen assemblages of our marine record spanning the last 2000 yr are dominated by conifer taxa, including Pinus and Picea (30%–50%) in addition to Abies (5%–10%), while Betula is rare (<10%). Such an assemblage differs from terrestrial pollen records of the north shore of the GSL, which are typically dominated by Picea and Betula (30%–50%) with a low proportion of Pinus (<10%) (Lavoie and Filion, Reference Lavoie and Filion2001; Sauvé, Reference Sauvé2016; Fréchette et al., Reference Fréchette, Richard, Lavoie, Grondin and Larouche2021; Fig. 1, nos. 1, 6, 7). In Gaspésie and southwestern Newfoundland, pollen assemblages are also dominated by Betula (50%), whereas Pinus and Picea are rare (<10%) (Marcoux and Richard, Reference Marcoux and Richard1995; McCarthy et al., Reference McCarthy, Collins, McAndrews, Kerr, Scott and Medioli1995; Asnong and Richard, Reference Asnong and Richard2003; Fig. 1, nos. 8, 9, 10, 17). On the Avalon Peninsula, southeastern Newfoundland, pollen assemblages are dominated by Betula (50%), while Picea is relatively abundant (20%) and Pinus very rare (<5%) (Macpherson, Reference Macpherson1982; Fig. 1, no. 19). Hence, the comparison of our marine pollen data with the regional pollen records shows some discrepancies, notably concerning the percentages of Pinus, which is overrepresented, whereas Betula is underrepresented. An overrepresentation of bisaccate pollen grains in marine sediments is frequent, and Pinus pollen has often been reported as preferentially transported by wind (e.g., Rochon and de Vernal, Reference Rochon and de Vernal1994), while the abundance of Betula pollen tends to decrease rapidly offshore (Mudie, Reference Mudie1982).
The GSL is in a region of mixing air masses, with modified mild dry Pacific winds from the west, cold dry Arctic air from the north and northwest, and warm moist tropical maritime air from the south (Bryson, Reference Bryson1966; Bryson and Hare, Reference Bryson, Hare, Bryson and Hare1974). Hence, the high proportion of Pinus pollen in the study core is probably related to atmospheric inputs from the eastern temperate forest (see Fig. 1), where white pine is abundant (cf. Gilliam et al., Reference Gilliam, Goodale, Pardo, Geiser, Lilleskov, Pardo, Robin Abbott and Driscoll2011). Other marine pollen records from the SLE (Lemay-Tougas, Reference Lemay-Tougas2014; Fig. 1, no. 2), the Bay of Islands off western Newfoundland (Levac, Reference Levac2003; Fig. 1, no. 14), and the Placentia Bay of southeastern Newfoundland (Jessen et al., Reference Jessen, Solignac, Nørgaard-Pedersen, Mikkelsen, Kuijpers and Seidenkrantz2011; Fig. 1, no. 12) are consistent with Pinus pollen fluxes related to air-mass trajectories. The pollen assemblages of the Placentia Bay exposed to southerly winds from the North Atlantic are dominated by Pinus (30%–40%; Jessen et al., Reference Jessen, Solignac, Nørgaard-Pedersen, Mikkelsen, Kuijpers and Seidenkrantz2011), despite its low occurrence in records from adjacent terrestrial sites (Macpherson, Reference Macpherson1982). In contrast, the pollen assemblages from the SLE and Bay of Islands core sites, which are nearshore, record relatively high Betula percentages (20%–30%) and therefore appear comparable to nearby terrestrial pollen records (McCarthy et al., Reference McCarthy, Collins, McAndrews, Kerr, Scott and Medioli1995; Fréchette et al., Reference Fréchette, Richard, Lavoie, Grondin and Larouche2021).
Interpreting offshore pollen assemblages in terms of atmospheric inputs leads us to suggest that the decreasing percentages of Pinus pollen at our study site over the last 2000 yr result from the decaying dominance of the Atlantic Maritime Tropical air mass over other air masses. This could be due to an atmospheric circulation that allowed more frequent incursions of Arctic air masses, which in turn may be the origin of the cooling reconstructed from regional paleoclimatic proxies, including pollen records (cf. O'Brien et al., Reference O'Brien, Mayewski, Meeker, Meese, Twickler and Whitlow1995; Viau et al., Reference Viau, Gajewski, Fines, Atkinson and Sawada2002; Jessen et al., Reference Jessen, Solignac, Nørgaard-Pedersen, Mikkelsen, Kuijpers and Seidenkrantz2011; Pratte et al., Reference Pratte, Garneau and De Vleeschouwer2017; Fréchette et al., Reference Fréchette, Richard, Lavoie, Grondin and Larouche2021).
Regional vegetation history and hydroclimatic conditions
The pollen record of the last two millennia shows that regions surrounding the GSL were occupied by mixed coniferous-hardwood forests communities, which have developed during the Early to Mid-Holocene (Fréchette et al., Reference Fréchette, Richard, Lavoie, Grondin and Larouche2021). The establishment of the closed forests are documented in the regional terrestrial pollen records mentioned earlier (e.g., Marcoux and Richard, Reference Marcoux and Richard1995; McCarthy et al., Reference McCarthy, Collins, McAndrews, Kerr, Scott and Medioli1995; Lavoie and Filion, Reference Lavoie and Filion2001; Asnong and Richard, Reference Asnong and Richard2003; Sauvé, Reference Sauvé2016). The Late Holocene expansion of balsam fir and spruce populations has been inferred from the synchronous increase of their pollen percentages at these terrestrial sites. Such a trend is also seen in our marine pollen record, with Picea increasing from 30% to 50% and Abies increasing from 5% to 10%. This may be a response of the vegetation to regional climate cooling, as proposed by Anderson (Reference Anderson, Bryant and Holloway1985) and Fréchette et al. (Reference Fréchette, Richard, Lavoie, Grondin and Larouche2021). In eastern Gaspésie, located west of our coring site, a decrease of thermophilic species such as Pinus strobus (white pine) and Betula alleghaniensis (yellow birch) was also highlighted by Asnong and Richard (Reference Asnong and Richard2003), who attributed these changes to a trend toward cooler and moister conditions. However, based on increased charcoal abundances, Carcaillet and Richard (Reference Carcaillet and Richard2000) suggested that relatively dry summers after 2500 cal yr BP fostered more frequent and severe forest fires in eastern Canada. Although counterintuitive, higher soil moisture does not necessarily relate to higher precipitation, as evapotranspiration is reduced under cool climate conditions (cf. Lavoie and Filion, Reference Lavoie and Filion2001). The hypothesis of a cooling trend without increasing precipitation is supported by our reconstructions, which illustrate SST decrease in surface waters of the central gulf region together with a slight increase of salinity from 1600 cal yr BP to about 100 yr ago. An increase of summer SSS suggests lower freshwater discharge, thus lower precipitation at the scale of the watershed.
Regional changes in sea-surface conditions
The warm interval of the first millennium of the Common Era until 625 cal yr BP (1325 CE)
This interval that corresponds to the dinocyst zone 1 as defined from PCA is characterized by relatively high percentages of S. ramosus, Spiniferites spp., and B. tepikiense, and by low percentages of Islandinium, which together point to relatively warm conditions. The MAT reconstructions suggest summer SST ranging from 11°C to 14°C and sea-ice cover of 2–2.5 months/yr, with the warmest conditions characterizing the 1590 to 1230 cal yr BP interval.
Previous reconstructions based on dinocyst records from the area also revealed relatively warm conditions between 2100 and 1250 cal yr BP in the SLE (Lemay-Tougas, Reference Lemay-Tougas2014; Fig. 1, no. 2) and until 1000 14C yr BP at the Bay of Islands off west Newfoundland (Levac, Reference Levac2003; Fig. 1, no. 14). Similarly, palynological records from Bonavista Bay off northeast Newfoundland (Fig. 1, no. 11) show a maximum of B. tepikiense percentages from 1700 to 1100 cal yr BP, suggesting warm summer conditions; in contrast, the Placentia Bay data from southeast Newfoundland (Fig. 1, no. 12) suggest that the warmest period occurred before 1500 cal yr BP, which is earlier than other regional records. However, this is inferred from O. centrocarpum percentages that could also relate to local processes, such as enhanced upwelling resulting from changes in the dominant wind pattern (Solignac et al., Reference Solignac, Seidenkrantz, Jessen, Kuijpers, Gunvald and Olsen2011). The timing of the thermal optimum at our study site overlaps with the one recorded at the other sites, except perhaps for the Bay of Islands, where the lack of age control and low temporal resolution over the last 3500 yr prevent precise chronostratigraphic inference.
The maximum summer SST recorded during the Late Holocene in the SLE is close to 13°C, which is about 2.5°C higher than the local modern average (10.42 ± 2.73°C; Lemay-Tougas, Reference Lemay-Tougas2014). At the Bay of Islands site off west Newfoundland, Levac (Reference Levac2003) reconstructed February and August SSTs up to 5°C and 2°C higher than at present during the warmest interval of the Common Era. In the GSL, the thermal optimum we identified (1590–1230 cal yr BP) corresponds to summer SSTs of 12°C–14°C, comparable to the one recorded in the SLE but within the range of modern values (14.0 ± 2.1°C).
Regardless of the uncertainties in the reconstruction and chronology of each record, the data together point to relatively warm conditions in the SLE and GSL during the early part of the Common Era. Given the location of our study site in the central GSL, away from the coast and upwelling zones where local processes can impact dinoflagellate populations and dinocyst assemblages, we propose that our reconstructions are representative of changes at the scale of the GSL area. Our record shows that the warmest phase of the Common Era likely occurred from 1590 to 1230 cal yr BP. It also suggests another warm event around 750 cal yr BP (1200 CE), which might correspond to the end of the Medieval Warm Period (e.g., Mann et al., Reference Mann, Zhang, Rutherford, Bradley, Hughes, Shindell, Ammann, Faluvegi and Ni2009) at regional scale.
The cooling trend of the last millennium and the 170–40 cal yr BP (1780–1910 CE) cold interval
The cooling trend spanning from about 1230 to 40 cal yr BP in our record is a continuum from the upper zone 1 through zones 2 and 3 defined from PCA, which is characterized by increasing percentages of Islandinium relative to decreasing percentages of Brigantedinium spp. and B. tepikiense in the dinocyst assemblages.
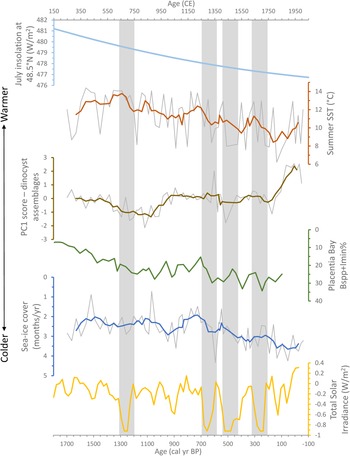
The reconstructions illustrate a cooling trend marked by a decrease of ~4°C in surface waters in summer and by increased sea-ice cover from 2 months/yr to 4 months/yr. Similar Late Holocene cooling was reconstructed based on dinocyst assemblages of nearby marine sites (Levac, Reference Levac2003; Solignac et al., Reference Solignac, Seidenkrantz, Jessen, Kuijpers, Gunvald and Olsen2011; Lemay-Tougas, Reference Lemay-Tougas2014). However, unlike the continuous long-term cooling we recorded in the GSL, the data from the SLE rather suggested a cooling event of ~2°C between 1200 and 500 cal yr BP (Lemay-Tougas, Reference Lemay-Tougas2014). In the Bay of Islands, the Late Holocene cooling has an amplitude of about 3°C (Levac, Reference Levac2003). In Placentia Bay and Bonavista Bay off southeast and northeast Newfoundland, a shift to fresher/colder conditions is inferred from increasing percentages of I. minutum and Brigantedinium spp. (Solignac et al., Reference Solignac, Seidenkrantz, Jessen, Kuijpers, Gunvald and Olsen2011). The interpretation is qualitative, but the trend is comparable to the one from our record, especially for SST and sea-ice cover (see Fig. 10).
In our record from the central GSL, the latest cooling event is dated 170–40 cal yr BP. It is marked by the coldest conditions of the record, with summer SSTs about 5.5°C lower than the modern average that probably correspond to the regional signature of the LIA (e.g., Lamb, Reference Lamb1995; Mann et al., Reference Mann, Zhang, Rutherford, Bradley, Hughes, Shindell, Ammann, Faluvegi and Ni2009). It is accompanied by a slight increase of summer SSS (~0.5 psu). While variations of SSS are generally opposite to those of SST in our record, the SLE data from Lemay-Tougas (Reference Lemay-Tougas2014) show parallel variations of SSS and SST with a decrease of ~1.5 psu during the Late Holocene. Such regional differences suggest complex processes in the SLE and the GSL region, which could be further addressed from additional high-resolution records after synchronization and standardization of the time series.
The last 100 yr warming
The upper part of the sequence encompassing the last century corresponds to zone 4 of the dinocyst assemblages. In this zone, P. dalei and S. elongatus increased, whereas Islandinium, N. labyrinthus, and B. tepikiense decreased. The MAT reconstructions show a warming of about 3°C with decreasing surface salinity and sea-ice cover since about 1910 CE. A recent warming at regional scale was documented from benthic foraminifera that are tracers of the bottom waters (Genovesi et al., Reference Genovesi, de Vernal, Thibodeau, Hillaire-Marcel, Mucci and Gilbert2011; Thibodeau et al., Reference Thibodeau, de Vernal and Limoges2013). Our record documents change in surface waters, likely associated with atmospheric conditions. The assemblages, PCA scores, and reconstructions indicate that the last 100 yr experienced unprecedented conditions at the scale of the last two millennia: the PC1 scores indicate unique assemblages of dinocysts, and the reconstructions show a reversal of the long-term cooling trend with summer SSTs rising from the coldest levels of the record toward the lower bound of modern averages; the highest summer primary productivity at 2645 mgC/m2/day is also recorded during this period (see Figs. 9 and 10). This might partly correspond to the recovery from the LIA but may also be associated with the ongoing anthropogenic climate change.
July insolation at the latitude of the core site (48.5°N; light blue curve) from Laskar et al. (Reference Laskar, Robutel, Joutel, Gastineau, Correia and Levrard2004), SST and sea-ice cover record in core MSM46-03 (red and blue curves), principal component analysis (PCA) axis 1 sample scores of dinocyst assemblages in core MSM46-03 (brown curve), the sum of Brigantedinium spp. and I. minutum percentages from Placentia Bay (Solignac et al., Reference Solignac, Seidenkrantz, Jessen, Kuijpers, Gunvald and Olsen2011; green curve), and total solar irradiance anomalies (yellow curve) given as difference to the value of the solar cycle minimum of the year 1986 CE from Steinhilber et al. (Reference Steinhilber, Abreu, Beer, Brunner, Christl, Fischer and Heikkila2012), https://www.ncdc.noaa.gov/paleo-search/study/12894, accessed September 3, 2020. Gray bands highlight the main negative excursions of solar irradiance. Records from MSM46-03 (this study) were smoothed with a five-point running mean. Note that the axes for sea-ice cover and Bspp+Imin% are reversed to facilitate comparison with other records.

Insights into climate and ocean changes: regional versus global events
The warm sea-surface conditions recorded between 1590 and 1230 cal yr BP based on dinocyst assemblages correspond to low summer SSS, which suggests high freshwater inputs from the St. Lawrence watershed, and thus high regional precipitation. Sauvé (Reference Sauvé2016) reconstructed up to 200 mm higher mean annual precipitation than the present at Anticosti Island between ~2500 and ~1500 cal yr BP based on pollen assemblages in peatlands. This is consistent with our data despite the difference in timing that could be due to the accuracy of the chronology in the different records. In eastern Newfoundland, the reconstruction of bog surface wetness showed a major “wet phase” between 1700 and 1200 cal yr BP (Hughes et al., Reference Hughes, Blundell, Charman, Bartlett, Daniell, Wojatschke and Chambers2006). Hence, wet conditions at the scale of the GSL area during a large part of the first millennium of the Common Era is inferred. The subsequent cooling from 1230 to 40 cal yr BP in our reconstruction is accompanied with a slight increase of SSS, thus suggesting a decrease of regional summer precipitation, especially during cool phases.
A Late Holocene cooling is reported from many palynological studies across eastern Canada (e.g., Marcoux and Richard, Reference Marcoux and Richard1995; McCarthy et al., Reference McCarthy, Collins, McAndrews, Kerr, Scott and Medioli1995; Lavoie and Filion, Reference Lavoie and Filion2001; Muller et al., Reference Muller, Richard, Guiot, de Beaulieu and Fortin2003; Asnong and Richard, 2005). Signs of cooling characterize the paleovegetation records of the Middle to Late Holocene, and quantitative reconstructions suggest that the amplitude of the cooling trend was larger in summer than in winter (Fréchette et al., Reference Fréchette, Richard, Lavoie, Grondin and Larouche2021). The regional sea-surface cooling trend of about 4°C in summer during the last two millennia was probably part of the long-term climate changes initiated during the Middle Holocene as the result of decreasing summer insolation in the Northern Hemisphere (e.g., Marcott et al., Reference Marcott, Shakun, Clark and Mix2013; Kaufman et al., Reference Kaufman, McKay, Routson, Erb, Dätwyler, Sommer, Heiri and Davis2020; Fig. 10). The regional cooling trend is characterized by much larger amplitude than the global mean (cf. Marcott et al., Reference Marcott, Shakun, Clark and Mix2013; Kaufman et al., Reference Kaufman, McKay, Routson, Erb, Dätwyler, Sommer, Heiri and Davis2020), which suggests a higher sensitivity of the GSL surface hydrography and ecosystem to summer insolation. Beyond the long-term cooling recorded from 1230 to 40 cal yr BP that probably relates to decrease in insolation, secular variations in reconstructed SSTs deserve some attention. At our study site, maximum summer SSTs are recorded around 1550 and 1300 cal yr BP (400 and 650 CE), and minimum SST is recorded at ~140 cal yr BP (~1810 CE). Although we cannot discard the possibility that such extremes correspond to noise, high and low SST values probably represent high frequency variations in hydrographical conditions, given the quality of dinocyst data (high counts, high concentrations, short statistical distance of the analogs, etc.). The pacing is comparable to the solar cycles such as the de Vries cycle. The data of Steinhilber et al. (Reference Steinhilber, Abreu, Beer, Brunner, Christl, Fischer and Heikkila2012), derived from combined records of 10Be in Greenland and Antarctica ice cores and 14C in tree rings (Fig. 10), illustrate major negative excursions of total solar irradiance, some contemporaneous with decreases in SSTs in the GSL at 1290–1180, 700–600, 540–430, and 310–190 cal yr BP. This leads us to suggest linkages of surface-water temperature in the GSL with solar forcing. However, higher temporal resolution in the marine record and other regional data sets would be necessary for a clear demonstration and to identify causal relationships.
The thermal minimum that characterizes our record between 170 and 40 cal yr BP (1780–1910 CE) is consistent with the reconstruction of global temperature by Marcott et al. (Reference Marcott, Shakun, Clark and Mix2013), who have shown that the Middle–Late Holocene cooling culminated at about 200 cal yr BP during the LIA (e.g., Lamb, Reference Lamb1995; Mann et al., Reference Mann, Zhang, Rutherford, Bradley, Hughes, Shindell, Ammann, Faluvegi and Ni2009). In the Havre-Saint-Pierre area, north of the GSL, Sauvé (Reference Sauvé2016) identified particularly cold conditions between 500 and 150 cal yr BP from the peatland pollen record, with mean July air temperatures 1°C below present values. This interval overlaps with our coldest peak, but records smaller amplitude, possibly due to lower sensitivity of pollen data for recording high frequency variation (Webb, Reference Webb1986). In eastern Newfoundland, based on a composite reconstruction from plant macrofossils, testate amoebae, and the degree of peat humification, Hughes et al. (Reference Hughes, Blundell, Charman, Bartlett, Daniell, Wojatschke and Chambers2006) have identified a shift toward a rise in bog surface wetness at ca. 200 cal yr BP, which suggests wetter and/or cooler conditions. In northeastern Prince Edward Island, higher water-table depths are reconstructed from 550 to 150 cal yr BP using testate amoeba records from Baltic Bog, which also suggest wetter conditions (Peros et al., Reference Peros, Chan, Magnan, Ponsford, Carroll and McCloskey2016). According to our data, the LIA was a cold period not necessarily marked by enhanced precipitation, as reconstructed SSS suggests lower freshwater discharge to the GSL. Hence, the wetter conditions inferred from terrestrial records are probably related to reduced evapotranspiration rather than increased precipitation.
A recent warming, starting about one century ago in our record, is also widely documented in regional and global temperature reconstructions (e.g., Thibodeau et al., Reference Thibodeau, de Vernal, Hillaire-Marcel and Mucci2010; Genovesi et al., Reference Genovesi, de Vernal, Thibodeau, Hillaire-Marcel, Mucci and Gilbert2011; Marcott et al., Reference Marcott, Shakun, Clark and Mix2013; Kaufman et al., Reference Kaufman, McKay, Routson, Erb, Dätwyler, Sommer, Heiri and Davis2020). In contrast to cold and warm intervals of the Late Holocene in eastern Canada that often exhibit poor spatiotemporal coherence, the recent warming shows nearly global coherence over the past 150 yr, which strongly suggests a large-scale forcing and an anthropic origin for this recent trend (Neukom et al., Reference Neukom, Steiger, Gómez-Navarro, Wang and Werner2019). In general, there is little evidence for preindustrial globally coherent cold and warm epochs over the Common Era (PAGES 2k Consortium, 2013), suggesting that preindustrial forcings were insufficient or too regional to produce globally synchronous climate changes. Therefore, the study of mechanisms acting at regional scale is also of primary importance, as they seem to have had a large impact on the climate changes of the past two millennia.
CONCLUSION
Our study demonstrates that large variations of sea-surface conditions characterize the GSL area over the past two millennia. Our results showed a distinct thermal optimum of the Common Era, with SSTs comparable to the modern average and low salinities suggesting high precipitation at the scale of the watershed from 1590 to 1230 cal yr BP (360–720 CE). This optimum was followed by a progressive cooling of ~4°C in surface water, with high salinity likely related to low regional precipitation. This cooling culminated between 170 and 40 cal yr BP (1780–1910 CE) and could be associated with the regional signature of the LIA. The 4°C cooling is exceptional in terms of amplitude compared with global temperature reconstructions covering the last 2000 yr (cf. Marcott et al., Reference Marcott, Shakun, Clark and Mix2013; Kaufman et al., Reference Kaufman, McKay, Routson, Erb, Dätwyler, Sommer, Heiri and Davis2020). This may imply an extremely high sensibility of the GSL surface waters to climate changes, pointing to possibly devastating effects that the ongoing global warming might have on the GSL ecosystem in the future. To confirm this finding, it would be relevant to extend the study to a longer time interval, including the Holocene Climate Optimum, between about 8000 and 6000 cal yr BP, when the climate was globally warmer than the present, conditions associated with high summer insolation (e.g., Marcott et al., Reference Marcott, Shakun, Clark and Mix2013; Kaufman et al., Reference Kaufman, McKay, Routson, Erb, Dätwyler, Sommer, Heiri and Davis2020).
Comparison with other paleoclimate records and terrestrial palynostratigraphy highlighted the influence of insolation on regional hydrography over the last 2000 yr. It also suggested some changes in regional wind regime in relation to variations of atmospheric circulation patterns over eastern Canada. In hydroclimatic reconstructions derived from peat-based proxy records, it is sometimes difficult to disentangle the signal of high precipitation from low temperature that causes low evapotranspiration, as both lead to high effective moisture. The highly stratified waters of the GSL are largely controlled by continental runoff (Saucier et al., Reference Saucier, Roy and Gilbert2003; Galbraith et al., Reference Galbraith, Larouche, Chassé and Petrie2012) and thus reflect the difference between precipitation and evaporation at the scale of the watershed. Therefore, the SSS provides an independent indication of hydroclimatic conditions. Our study demonstrated that SSS reconstructed from dinocyst data can provide useful complementary information for the interpretation of regional climate.
Our results and other paleoclimatic records from the GSL area encompassing the last 2000 yr do not show unequivocal signals for the succession of cold and warm phases, such as the Roman Warm Period and the Dark Ages Cold Period, but rather suggest a continuum from warm to cold conditions until the recent warming, with short-lived oscillations that might relate to solar irradiance excursions. Additional high-resolution records from other sites of the GSL may help to better document the regional response of climate changes and their underlying mechanisms.
Supplementary Material
The supplementary material for this article can be found at https://doi.org/10.1017/qua.2021.56.
Acknowledgments
We thank the scientific party of the R/V Maria S. Merian for offering the samples from core MSM46-03. This study was supported by the Fonds de Recherche du Québec–Nature et technologies (FRQNT) and the Natural Sciences and Engineering Research Council (NSERC) of Canada. We thank Matthew Peros for constructive comments on an earlier version of the article and Estelle Allan for help in the palynological laboratory. We are grateful to the editor Thomas Lowell and the reviewers Francine McCarthy and Jennifer Galloway for their thoughtful comments and suggestions.