INTRODUCTION
Toxoplasma gondii is an apicomplexan parasite with a global distribution which can cause significant disease in many species including humans (Dubey and Jones, Reference Dubey and Jones2008; Dubey, Reference Dubey2010). Members of the family Felidae are the only known definitive hosts (Hutchison, Reference Hutchison 1965 ; Frenkel et al. Reference Frenkel, Dubey and Miller1970) but it also infects a whole range of warm-blooded vertebrates, including domestic, wild- and marine mammals, birds and humans (Dubey, Reference Dubey2010). After ingesting the sporulated oocysts or tissue cysts they serve as intermediate hosts, in which asexual reproduction occurs. There are 3 main routes of transmission: via oocysts shed in feces of the definitive hosts, ingestion of tissue cysts and congenital transmission. The relative importance of each of these transmission routes is not fully understood (Hide et al. Reference Hide, Morley, Hughes, Gerwash, Elmahaishi, Elmahaishi, Thomasson, Wright, Williams, Murphy and Smith2009) but infection by oocysts derived from felids is generally considered the most important (Tenter et al. Reference Tenter, Heckeroth and Weiss2000). In humans, ingestion of tissue cysts, from raw meat may be the main route of transmission in developed countries whereas ingestion of oocysts may be more significant in developing countries (Dubey and Jones, Reference Dubey and Jones2008). As prey or carrion, rodents may be a significant intermediate host in the transmission to other animals and high frequencies of infection have been observed (Marshall et al. Reference Marshall, Hughes, Williams, Smith, Murphy and Hide2004; Meerburg et al. Reference Meerburg, De Craeye, Dierick and Kijlstra2012) including in areas that appear to be relatively free of cats (Thomasson et al. Reference Thomasson, Wright, Hughes, Dodd, Cox, Boyce, Gerwash, Abushahma, Lun, Murphy, Rogan and Hide2011). The importance of congenital transmission is low in humans ranging between 0·01 and 1% of live births (Tenter et al. Reference Tenter, Heckeroth and Weiss2000) but the importance is more controversial in other mammalian species such as sheep (Hide et al. Reference Hide, Morley, Hughes, Gerwash, Elmahaishi, Elmahaishi, Thomasson, Wright, Williams, Murphy and Smith2009; Innes et al. Reference Innes, Bartley, Buxton and Katzer2009). However, in rodents this route of transmission may be more important. Beverley (Reference Beverley1959) first suggested that vertical transmission can play an important role in the transmission of the parasite using mice as a model system. Vertical transmission has been experimentally confirmed in laboratory conditions in murids (Apodemus sylvaticus, Mus domesticus) (Dubey et al. Reference Dubey, Weigel, Siegel, Thulliez, Kitron, Mitchell, Mannelli, Mateuspinillia, Shen, Kwok and Todd1995; Owen and Trees, Reference Owen and Trees1998; Elsaid et al. Reference Elsaid, Martins, Frézard, Braga and Vitor2001; Stahl et al. Reference Stahl, Sekiguchi and Kaneda2002), rats (Rattus norvegicus) (Dubey et al. Reference Dubey, Shen, Kwok and Thulliez1997) and shown to be significant in a natural population of domestic mice (M. domesticus) (Marshall et al. Reference Marshall, Hughes, Williams, Smith, Murphy and Hide2004). Furthermore, a high prevalence of infection was found in A. sylvaticus sampled in an area relatively free of cats (Thomasson et al. Reference Thomasson, Wright, Hughes, Dodd, Cox, Boyce, Gerwash, Abushahma, Lun, Murphy, Rogan and Hide2011) suggesting that Toxoplasma can also be maintained within rodent populations in the putative absence of cats.
Mice probably play an important role in T. gondii transmission, often prey to cats, yet little is known of T. gondii prevalence and genotypes in wild mouse populations. The majority of epidemiological studies on mice have been based on serological diagnostic methods which detect current and historical infection (Franti et al. Reference Franti, Riemann, Behmeyer, Suther, Howarth and Ruppanner1976; Jackson et al. Reference Jackson, Hutchison and Siim1986; Dubey et al. Reference Dubey, Weigel, Siegel, Thulliez, Kitron, Mitchell, Mannelli, Mateuspinillia, Shen, Kwok and Todd1995; Smith and Frenkel, Reference Smith and Frenkel1995; Hejlicek et al. Reference Hejlicek, Literak and Nezval1997; Hejlicek and Literak, Reference Hejlicek and Literak1998; Jeon and Yong, Reference Jeon and Yong2000; Yin et al. Reference Yin, He, Zhou, Yan, He, Wu, Zhou, Yuan, Lin and Zhu2010). Studies conducted using PCR-based methods as a diagnostic tool have generally shown higher prevalence in some wild mice populations with prevalences ranging from 10·4% (Vujanić et al. 2011), 13·6% (Kijlstra et al. Reference Kijlstra, Meerburg, Cornelissen, De Craeye, Vereijken and Jongert2008), 29% (Zhang et al. Reference Zhang, Jiang, He, Pan, Zhu and Wei2004) up to 40·78% (Thomasson et al. Reference Thomasson, Wright, Hughes, Dodd, Cox, Boyce, Gerwash, Abushahma, Lun, Murphy, Rogan and Hide2011) and 59% (Marshall et al. Reference Marshall, Hughes, Williams, Smith, Murphy and Hide2004). With the exception of a study of urban mice (M. domesticus) showing different levels of infection within different mouse populations (Marshall et al. Reference Marshall, Hughes, Williams, Smith, Murphy and Hide2004; Murphy et al. Reference Murphy, Williams, Hughes, Hide, Ford and Oldbury2008), information on the distribution of infected mice within natural populations of wild mice are generally lacking. The aims of this study were to investigate the detailed distribution of T. gondii infection in a series of localized populations of A. sylvaticus collected in a systematic manner (Boyce et al. Reference Boyce, Hide, Craig, Harris, Reynolds, Pickles and Rogan2012, Reference Boyce, Hide, Craig, Reynolds, Hussain, Bodell, Bradshaw, Pickles and Rogan2013). These populations reside in an area relatively free of cats (<2·5 cats per km2) (Hughes et al. Reference Hughes, Thomasson, Craig, Georgin, Pickles and Hide2008) but where previous studies have demonstrated a high prevalence (Thomasson et al. Reference Thomasson, Wright, Hughes, Dodd, Cox, Boyce, Gerwash, Abushahma, Lun, Murphy, Rogan and Hide2011). The objectives were to investigate host genotype and spatial location in relation to T. gondii infection. We show that parasite infection is linked to host population genotype not population location.
MATERIALS AND METHODS
A total of 126 wood mice (A. sylvaticus) were collected and euthanased from 4 sites located within the boundaries of the Malham Tarn Nature Reserve, North Yorkshire, UK (Fig. 1) as described previously (Boyce et al. Reference Boyce, Hide, Craig, Harris, Reynolds, Pickles and Rogan2012, Reference Boyce, Hide, Craig, Reynolds, Hussain, Bodell, Bradshaw, Pickles and Rogan2013; Morger et al. Reference Morger, Bajnok, Boyce, Craig, Rogan, Lun, Hide and Tschirren2014). Collection points at these sites, labelled Tarn Woods, Tarn Fen, Ha Mire and Spiggot Hill, were recorded using GPS position fixing (WGS84). All appropriate permissions were obtained (Boyce et al. Reference Boyce, Hide, Craig, Harris, Reynolds, Pickles and Rogan2012, Reference Boyce, Hide, Craig, Reynolds, Hussain, Bodell, Bradshaw, Pickles and Rogan2013) and ethical approval was granted by the University of Salford Research Ethics and Governance Committee (CST 12/36). Mice were examined for a range of parameters including sex, weight and length. Mice weighing less than 14 g were considered juveniles (Higgs and Nowell, Reference Higgs and Nowell2000). The brains were dissected out, using sterile technique, and transferred into sterile tubes containing 400 μL of lysis buffer (0·1 m Tris pH 8·0, 0·2 m NaCl, 5 mm EDTA, 0·4% SDS) and stored at −20 °C until DNA extraction. Due to the freezing in lysis buffer, it was not possible to conduct serological tests for T. gondii infection nor was it possible to isolate viable parasites.
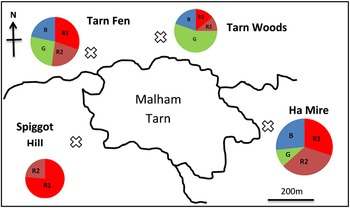
The population structure of A. sylvaticus in 4 sampling areas (Spiggot Hill, Tarn Fen, Tarn Woods and Ha Mire) at the study site (Malham Tarn, Yorkshire, UK). The pie charts represent the percentage of each genotype at each location. The cross specifically localizes the sampling site and each colour represents individual populations (R1, R2, B and G). The overall distribution of genetic groups in relation to location is presented.

DNA was isolated, from A. sylvaticus brain tissue, using proteinase K lysis followed by phenol/chloroform extraction as previously described (Duncanson et al. Reference Duncanson, Terry, Smith and Hide2001). Extracted DNA was tested for mammalian tubulin to ensure the viability for PCR (Terry et al. Reference Terry, Smith, Duncanson and Hide2001) and appropriate protocols to prevent cross-contamination were followed (Williams et al. Reference Williams, Morley, Hughes, Duncanson, Terry, Smith and Hide2005; Hughes et al. Reference Hughes, Williams, Morley, Cook, Terry, Murphy, Smith and Hide2006; Morley et al. Reference Morley, Williams, Hughes, Thomasson, Terry, Duncanson, Smith and Hide2008). Detection of T. gondii was carried out using nested PCR amplification of the surface antigen genes 1 (SAG1) (Savva et al. Reference Savva, Morris, Johnson and Holliman1990) as modified by Morley et al. (Reference Morley, Williams, Hughes, Terry, Duncanson, Smith and Hide2005). Positive amplification was confirmed by nested PCR amplification with 3 other sets of T. gondii specific primers (SAG2, SAG3 and GRA6) as described by Su et al. (Reference Su, Zhang and Dubey2006) and Shwab et al. (Reference Shwab, Zhu, Majumdar, Pena, Gennari, Dubey and Su2013). All samples were tested a minimum of 3 times with the SAG1-PCR and occasional samples which showed a sporadic positive amplification were further tested until they either attained the criteria of 3 positive SAG1-PCR amplifications or they were then considered negative. Samples passing the SAG1 PCR criteria were then also confirmed with a minimum of 3 positive amplifications using each of the 4 other markers before the mouse brain was considered positive for T. gondii infection. In addition to being used for parasite detection, these 3 genes (SAG2, SAG3 and GRA6) were used as restriction fragment length polymorphism (RFLP) markers for direct genotyping of PCR positive brain tissues as described (Su et al. Reference Su, Zhang and Dubey2006; Shwab et al. Reference Shwab, Zhu, Majumdar, Pena, Gennari, Dubey and Su2013). Typically, T. gondii genotyping is carried out using DNA taken from isolated viable parasite strain cultures using a total of 10 genetic markers. In this study, viable parasite isolation was not possible and consequently genotyping was conducted on DNA extracted directly from tissue. This is known to be difficult due to low infection levels and as a consequence, only 3 markers could be reliably amplified for genotyping (SAG2, SAG3 and GRA6). Amplification and RFLP analysis, directly from tissues has been reported to be very difficult to achieve and, the same was true in this study. Multiple PCR reactions were necessary to build up the RFLP results. We recognize the limitations of this approach over parasite isolation, particularly for the detection of genotypes due to partial digestion with restriction enzymes, and have taken precautions to ensure maximum reliability. All PCR reactions were performed using published primer sequences (see below for specifics). Sheep DNA was used as a positive control for tubulin PCR, T. gondii DNA strains RH (Type I), SR (Type II – isolated from a goat, Slovakia (Spisak et al. Reference Spisak, Turcekova, Reiterova, Spilovska and Dubinsky2010) and checked as Type II for all 10 markers, this paper – data not shown) and C56 (Type III) were used as positive controls for diagnostic PCRs and genotyping. Sterile water was used as a negative control and interspersed throughout experiments to ensure that contamination would be detectable. For the SAG1 PCR, each sample was tested at 2 concentrations of DNA (1/5 and 1/10 dilution as the ratio of parasite to host DNA was unknown). All PCR reactions were performed using a Stratagene ROBOCYCLER™ (La Jolla, California, USA). PCR products were run on 1·5% agarose TBE gel containing GELRED and visualized on a Syngene G-BOX Gel Documentation and Analysis System (Cambridge, UK). For the majority of genotyping reactions, the Type II strain was used as the positive control (as this is the most predominant type in Europe) so that the occurrence of unusual Type I and III strains being derived from contamination by the control could be ruled out. To avoid confusion by partial digestion, careful analysis of band sizes, from all markers, was carried out in relation to published marker DNA sequences and other studies. The SAG2 locus has 2 polymorphic sites at 3′ and 5′ ends for Types II and III (Howe et al. Reference Howe, Honore, Derouin and Sibley1997) and amplification of the ends of this locus was performed separately. The 2 PCR reactions for the SAG 2 gene were optimized as described by Fuentes et al. (Reference Fuentes, Rubio, Ramírez and Alvar2001). Amplification was carried out in a final volume of 20 μL containing 2·7 μL of KCL buffer (containing 15 mm MgCl2 manufactured by Bioline), 0·32 μL of dNTP mix (100 mm), 1 μL of (10 pm μL−1) forward primer and reverse primer and 0·4 μL of 5 units Biotaq polymerase (Bioline). Two microliters of DNA were used as a template. The thermal cycling conditions consisted of an initial denaturation step of 4 min at 95 °C. This was followed by 20 cycles of 94 °C for 30 s, 55 °C for 1 min and 72 °C for 2 min and a final elongation step of 72 °C for 10 min. The resulting amplification products were diluted 1/10 in water and a second amplification of 35 cycles was performed using 1 μL of the diluted product as template. The annealing temperature for the second round primers was 60 °C but all other conditions remained the same as the first round (Fuentes et al. Reference Fuentes, Rubio, Ramírez and Alvar2001).
For the PCR reaction targeting the 3′end of SAG2 gene, correct predicted product sizes of 300 bp for the first round and 222 bp for the second round of amplification are expected. In control Toxoplasma DNA, both products could be seen but in positive mouse brain DNA samples, products could only be seen in the second round. For the PCR reaction targeting the 5′ end of SAG2 gene, first and second round products of, respectively, 340 and 241 bp were the correct predicted band sizes. Again, both could be seen in control DNA samples but only the second round product was observed in positive mouse brain DNA. Positive PCR reactions were further analysed by restriction enzyme digestion with each of the restriction enzymes Sau3Al (5′-end products) and HhaI (3′-end products) using 8·5 μL of PCR product, 1 μL of the manufacturers recommended buffer and 0·5 μL of enzyme. These were incubated at 37 °C for a minimum of 2 h. Products were visualized by gel electrophoresis on a 2·5% agarose gel. Typing was achieved by combining 5′ and 3′ RFLP patterns (Howe et al. Reference Howe, Honore, Derouin and Sibley1997).
A nested PCR was used to detect the SAG3 gene (Grigg et al. Reference Grigg, Ganatra, Boothroyd and Margolis2001; Su et al. Reference Su, Zhang and Dubey2006). Amplification was carried out in a final volume of 50 μL containing 5 μL of 10 × HT PCR buffer (HT Biotechnologies) (100 mm Tris HCl (pH 9·0), 15 mm MgCl2, 500 mm KCl, 1% TritonX-100, 0·1% (w/v) stabilizer), 0·5 μL of dNTP mix (100 mm), forward primer F ext (5′ CAACTCTCACCATTCCACCC 3′) and 2·5 μL of (10 pm μL−1) reverse primer R ext (5′ GCGCGTTGTTAGACAAGACA 3′) and 2·5 units Biotaq polymerase (Bioline). DNAse-free water made the final volume to 50 μL. All samples were tested 3 times at 1, 2 and 1 μL 1:5 dilution of sample DNA. Amplification was carried out using a Stratagene Robocycler as follows: an initial denaturation step of 5 min at 94 °C was followed by 35 cycles of PCR performed for 40 s at 94 °C, 40 s at 60 °C and 60 s at 72 °C, with a final extension step of 10 min at 72 °C. Second-round PCR was carried out using the same reaction and cycling conditions as the first round with the exception of the primers which were F int (5′ TCTTGTCGGGTGTTCAC TCA 3′) and R int (5′ CACAAGGAGACCGAGAA GGA 3′). A volume of 2 μL of first-round product was added to act as a template. Amplification products (10 μL) were visualized by agarose gel electrophoresis on a 2% agarose gel containing GelRed. Positive PCR reactions (226 bp) were further analysed by restriction enzyme digestion with each of the enzymes NciI and AlwNI, 13 μL of PCR product, 1·5 μL of buffer 4 (NEB) and 0·5 μL of enzyme. These were incubated at 37 °C for a minimum of 2 h.
GRA6 nested PCR was performed using published sequences: F1: 5′ ATTTGTGTTTCCGA GCAGG 3′, R1: 5′ GCACCTTCGCTTGTGGT 3′ and F2: 5′ TTCCGAGCAGGTGACC 3′, R2: 5′ GCCGAAGAGTTGACATAG 3′ (Su et al. Reference Su, Zhang and Dubey2006). A 344 bp product at the end of the second round was considered to be positive. For RFLP typing, 5 μL of nested PCR products were treated with MseI in total volume of 20 μL at 37 °C for 1 h and then digested samples were resolved on a 2·5% agarose gel to reveal banding patterns (Khan et al. Reference Khan, Su, German, Storch, Clifford and Sibley2005).
A total of 126 DNA samples from A. sylvaticus were prepared for microsatellite genotyping. Nine A. sylvaticus loci were amplified and genotyped using primers and conditions previously described (Makova et al. Reference Makova, Patton, Krysanov, Chesser and Baker1998). One M. domesticus microsatellite, which amplifies from A. sylvaticus was also used (MS19) (primers – forward: 5′ TGCTCACTGATT TGAGCCTGTGCA 3′, reverse: 5′ ATAAATACA GAGCAAAGC 3′). The PCR reaction mixture (20 μL) consisted of 2 μL Bioline buffer (excluding MgCl2), 0·6 μL Bioline MgCl2 (50 mm), 2 μL of each primer (10 pm/μL−1), 0·2 μL dNTP mix (25 mm each), 0·2 μL DNA Taq Polymerase (5 U) and 12 μL PCR water.
Thermal cycling conditions used were an initial 5 min denaturation at 95 °C followed by 35 cycles at 95 °C for 40 s (denaturation), 30–45 s at the annealing temperature, 72 °C for 30–60 s (extension), concluding with a final 30 min extension at 72 °C (Makova et al. Reference Makova, Patton, Krysanov, Chesser and Baker1998). Amplification products (10 μL) were visualized by agarose gel electrophoresis on a 1·5% agarose gel containing GelRed. PCR products were then mixed with formamide and LIZ™ standard marker and genotyped on the GENOTYPER (Applied Biosystems 3130 Genetic Analyser) according to the manufacturer to gain allele sizes relative to an internal size standard. Each sample for each locus was scored with Peak Scanner™ v1.0 to identify peaks and fragment sizes for application-specific capillary electrophoresis assays (Dodd et al. Reference Dodd, Lord, Jehle, Parker, Parker, Brooks and Hide2014). The program Structure 2.3.3 (Pritchard et al. Reference Pritchard, Stephens and Donnelly2000; Evanno et al. Reference Evanno, Regnaut and Goudet2005) was used to analyse multi-locus microsatellite genotype data to investigate population structure. In some cases, the program STRUCTURE cannot detect subgroups with weaker probabilities when all data are included. It is common practice (e.g. Gelanew et al. Reference Gelanew, Kuhls, Hurissa, Weldegebreal, Hailu, Kassahun, Tamrat, Abebe, Hailu and Schönian2010) to rerun each initial group separately through STRUCTURE to investigate substructuring. This was carried out on the R, G and B groups and indeed did reveal further structuring in the R Group (see section ‘Results’). Program COLONY v2.0.5.0 (Wang, Reference Wang2004) was used to estimate the full- and half-sib relationships of mice. The program MICRO-CHECKER 2.2.3 (Van Oosterhout et al. Reference Van Oosterhout, Hutchinson, Wills and Shipley2004) was used to check for the absence of microsatellite null alleles and scoring errors. None were found.
RESULTS
The study site (Malham Tarn, Yorkshire Dales, UK) yielded 126 A. sylvaticus from 4 spatially separate sampling sites (Fig. 1). To examine the prevalence of T. gondii in this population of A. sylvaticus, a series of PCR reactions were conducted using T. gondii specific PCR primers. DNA was successfully isolated from 126 mice brains and tested for the absence of PCR inhibition using PCR amplification of the mammalian α-tubulin gene. Forty four samples from 126 gave positive reactions with 4 T. gondii specific markers SAG1, SAG2, SAG3 and GRA6 (3 replicates each) (Table 1). Thus an infection rate of 34·92% (95% CI: 27·14–43·59%) was found. A total of 24/76 (31·58%, 95% CI: 22·19–42·74%) of male and 20/50 (40%, 95% CI: 27·59–53·84%) of female mice were found to be positive for T. gondii. No significant difference was found in prevalence in males and females (χ2 = 0·863, d.f. = 1, P = 0·353). A total of 17 juveniles, 65 young adults and 44 adults were present in this cohort of 126 of which 7 (41·18%), 27 (41·54%) and 10 (22·72%), respectively, were PCR positive for T. gondii. There was no significant age prevalence effect (P = 0·23).
PCR analysis of the brain tissue from A. sylvaticus from Malham Tarn using Toxoplasma gondii specific markers. PCR analysis was conducted with 4 T. gondii specific markers, SAG1, SAG2, SAG3 and GRA6

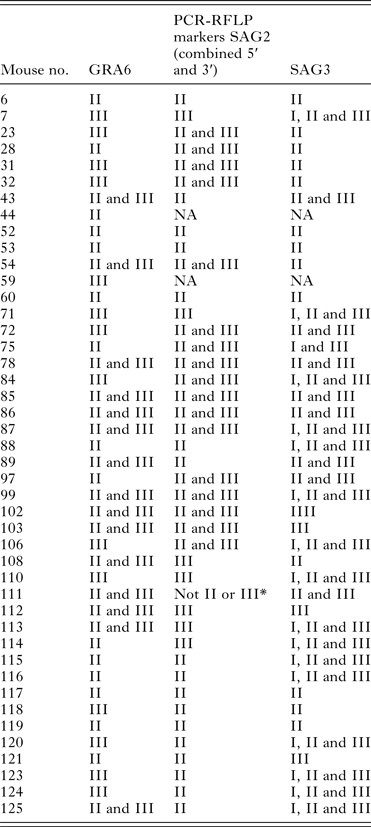
To investigate parasite diversity present in infected animals, it is usual to determine the genotypes of isolated viable T. gondii strains by RFLP mapping using a standard set of 10 markers (e.g. Su et al. Reference Su, Zhang and Dubey2006; Shwab et al. Reference Shwab, Zhu, Majumdar, Pena, Gennari, Dubey and Su2013). As the possibility did not exist to isolate viable parasites from this set of samples, direct genotyping from brain tissue DNA was carried out. Due to presumed low parasite intensity levels, we were only able to directly genotype all of the positive mice using 3 genetic markers. Other genetic markers could not be consistently amplified to levels sufficient for RFLP mapping. Table 2 presents the RFLP results for all 44 positive mice using genetic markers GRA6, SAG2 and SAG3 as described elsewhere (Su et al. Reference Su, Zhang and Dubey2006; Shwab et al. Reference Shwab, Zhu, Majumdar, Pena, Gennari, Dubey and Su2013). Using the SAG2 (both ends) and the GRA6 genes, both Type II and III banding patterns were detected. The digestion of the SAG3 PCR products with AlwNI and NciI revealed Type II and III patterns, and in a number of mice, a combination of all 3 types (I, II and III). An example gel of a mouse exhibiting Type I, II and III SAG3 RFLP patterns is presented in Fig. 2. Detailed analysis of the RFLP patterns, in combination with published DNA sequences for the 3 loci showed, that a mixture of strains was a possible interpretation for some of these combinations. Mixtures of parasite strains have not been widely reported for T. gondii infections and, although requiring genotyping of isolated viable parasites for complete confirmation, suggests that this in an interesting phenomenon that should be explored further.
Direct PCR amplification of a mixed genotype mouse (106) exhibiting Type I, II and III strain characteristics. Indicated band sizes are in base pairs. Lane 1. Hyperladder 50 bp Marker (Bioline). Lane 2. Undigested SAG3 control (no enzyme added) – observed as a 226 bp band. Lane 3. Mixture of Type I and III control DNA digested with AlwNI. This enzyme cuts only Type II sequences and not Type I or III. No digestion is observed in this mixture of Type I and III controls confirming that they do not contain Type II. Lane 4. Mixture of Type I and III control DNA digested with NciI. This enzyme cuts Type I strains twice generating 3 fragments of 99, 65 and 62 bp. These bands are seen in this lane confirming the presence of Type I DNA. NciI cuts Type III DNA only once and generates fragments of 161 and 65 bp. These bands are also seen in this lane confirming that it also contains Type III DNA and therefore confirms that this control sample is indeed a mixture of Types I and III. Lane 5. Mouse 106 DNA (recorded as a mixture of Types I, II and III) DNA digested with NciI. Bands observed at 99, 65 and 62 bp confirm the presence of Type I DNA, bands at 161 and 65 bp confirm the presence of Type III DNA while the presence of a further band at 226 indicates the presence of non-Type I or -Type III in this sample. Digestion with AlwNI confirms this is Type II DNA – see later. Lane 6. Mixture of Type I and III control DNA digested with AlwNI. This enzyme cuts only Type II sequences and not Types I or III. No digestion is observed in this mixture of Type I and III controls confirming that they do not contain Type II. Lane 7. Type II control DNA cut with AlwNI. This enzyme cuts Type II DNA once producing fragments of 128 and 98 bp but does not cut either Type I or III. In this case the presence of bands at 128 and 98 bp confirms the presence of the Type II control DNA. Lane 8. Mouse 106 DNA (recorded as a mixture of Types I, II and III) DNA digested with AlwNI shows bands of 128 and 98 bp, confirming the presence of Type II DNA but also contains a band at 226 bp confirming the presence of non-Type II DNA (shown earlier as Types I and III DNA).

Genotypes of Toxoplasma gondii in wood mice from the study site (NA – marker was not able to be amplified to a sufficient level for RFLP genotyping or in the case of SAG2, one diagnostic end could not be amplified sufficiently; *Not II or III – indicates that the marker excludes types (e.g. II and III in this case) but cannot definitively confirm a type). Genotypes defined as listed previously (Fuentes et al. Reference Fuentes, Rubio, Ramírez and Alvar2001; Grigg et al. Reference Grigg, Ganatra, Boothroyd and Margolis2001; Khan et al. Reference Khan, Su, German, Storch, Clifford and Sibley2005; Su et al. Reference Su, Zhang and Dubey2006)

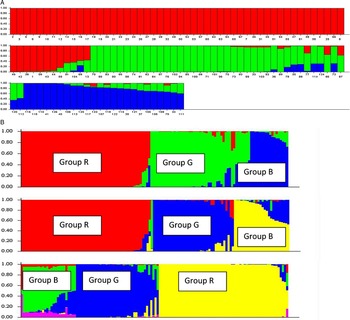
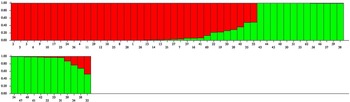
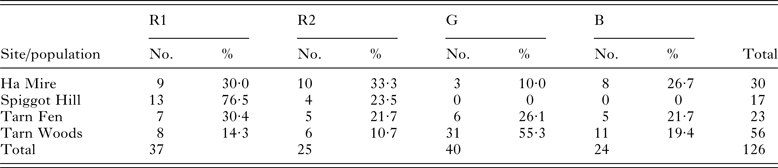
In order to investigate the host population genetics of this collection of A. sylvaticus, the mice were genotyped using 10 polymorphic microsatellite DNA markers. The level of genetic variation at the 10 microsatellites loci was high, all 10 microsatellites were polymorphic. The polymorphism varied between 7 (locus 4A) and 15 (locus 12A) alleles per locus (Makova et al. Reference Makova, Patton, Krysanov, Chesser and Baker1998) with an average of 10·6 alleles per locus. Using the program MICRO-CHECKER 2.2.3 (Van Oosterhout et al. Reference Van Oosterhout, Hutchinson, Wills and Shipley2004) no evidence was found of null alleles and therefore all 10 loci were included in the analysis. The results of the program STRUCTURE showed that the most probable number of clusters of individuals was 3 and that the whole wood mice population in the study site (Malham Tarn) consisted of 3 genetically distinct populations R, G and B (Table 3, Fig. 3A). To evaluate the robustness of these 3 populations, STRUCTURE was rerun using K values of 4 and 5 (i.e. considering the probability of 4 and 5 groups) and the same 3 populations were identified showing that the groups are reliably assigned (Fig. 3B). The sampling location was not used as prior information in the analysis so as not to bias any genetic interpretation. As the generation of groups by STRUCTURE is based on probability of an individual belonging to a group, sometimes groups with weaker probabilities can be masked during the first analysis. It is common practice (e.g. Gelanew et al. Reference Gelanew, Kuhls, Hurissa, Weldegebreal, Hailu, Kassahun, Tamrat, Abebe, Hailu and Schönian2010) to re-examine genetically defined STRUCTURE groups by re-running each group (i.e. R, G and B) separately through STRUCTURE. Following this more detailed analysis using STRUCTURE, the R population could be divided into 2 genetically distinct populations R1 and R2 (Fig. 4, Table 3). Again these groups were robust for higher values of K (data not shown). STRUCTURE was unable to divide the individuals from populations G and B into subpopulations so they were considered as individual populations. Based on these observations, we conclude that there are 4 genetically defined populations. These genetic populations, identified by STRUCTURE, were examined to see if there was any association between microsatellite derived populations and the trapping location of the mice. Testing the null hypothesis of no association, it was found that a significant association of mouse genetic group with trapping location was found (χ 2 = 46·6; d.f. = 9; P = 0·000). Patterns of distribution of the genetic groups show that this association is loose (e.g. the G group is predominantly found in the area designated Tarn Woods but that migration has occurred to neighbouring sites). This indicates that the habitat structure of the landscape allows a slow migration of mice from one population to another, perhaps with source and sink populations. The overall distribution of genetic groups in relation to location is presented in Fig. 1.
Panel A. Estimated population structure using microsatellite genotyping (K = 3). Analyses were performed using the admixture model provided by STRUCTURE software (Pritchard et al. Reference Pritchard, Stephens and Donnelly2000; Evanno et al. Reference Evanno, Regnaut and Goudet2005). Each individual is represented by a vertical line broken into segments of different colours, with lengths proportional to its membership to each of the clusters (Red, Green and Blue). Panel B. Evaluation of the robustness of the grouping by STRUCTURE. Summary structure diagrams are shown for K = 3 (see Panel A) and can be compared with diagrams generated when K = 4 and K = 5. The 3 main groups remain present despite ‘forcing’ the program to generate more groups. Detailed analysis of the composition of mice confirms the identities of the groupings (note, STRUCTURE automatically assigns colours to groups and can result in changes in colour as values of K change).

STRUCTURE plot showing that population R, when reanalysed by STRUCTURE, consists of 2 genetically distinct subpopulations, R1 (red) and R2 (green) (K = 2). Analyses were carried out as described for Fig. 3.

The population structure of wood mice from the study site (Malham Tarn, Yorkshire, UK) in relation to sampling sites. R, G and B represent the genetic populations as defined by STRUCTURE. Ha Mire, Spiggot Hill, Tarn Fen and Tarn Woods represent the 4 geographical locations from which the mice were collected (see Fig. 1)

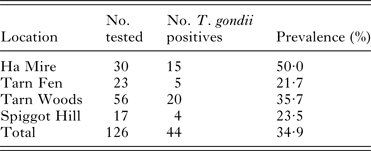
To understand the distribution of T. gondii in mice from different collection sites, the prevalence was calculated for each site. While variation in prevalence was seen at each site, this was not significant (P = 0·29) (Table 4).
Prevalence of T. gondii infected A. sylvaticus at sites of collection

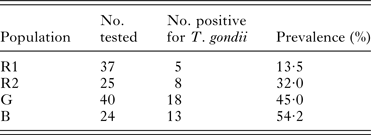
To understand the distribution of T. gondii in mice from different genetic populations, as inferred from STRUCTURE, the prevalence was calculated for each population. There was a significant difference between each genetic population (χ 2 = 7·950, d.f. = 2, P = 0·018) (Table 5). This conclusion was also true when the 3 groups were also resolved at other values of K (i.e. 4 and 5, Fig. 3B).
Prevalence of T. gondii infected A. sylvaticus with respect to genetic population. R1 R2, G and B represent the populations as designated using STRUCTURE. These data suggest that infection status of A. sylvaticus is more closely related to the genetic population structure than to the location of capture

Some previous studies have suggested that vertical transmission of T. gondii might be important in natural populations of mice (Owen and Trees, Reference Owen and Trees1998; Hide et al. Reference Hide, Morley, Hughes, Gerwash, Elmahaishi, Elmahaishi, Thomasson, Wright, Williams, Murphy and Smith2009; Thomasson et al. Reference Thomasson, Wright, Hughes, Dodd, Cox, Boyce, Gerwash, Abushahma, Lun, Murphy, Rogan and Hide2011) in which case a relationship should be detectable between infection and family line (Morley et al. Reference Morley, Williams, Hughes, Terry, Duncanson, Smith and Hide2005). Having established a relationship between infection and population structure, this raises the question as to whether these populations can be further analysed at the family level. To address this question, families were assigned to the mice using the program COLONY and the relationship with T. gondii infection examined. The COLONY program can be used to infer full- and half-sib relationships, assign parentage, infer mating system (polygamous/monogamous) and reproductive skew in both diploid and haplo-diploid species. Twenty-two families of wood mice were identified in this collection in the study site. These comprised 4 families of full-sibs and 18 families of half-sibs based, as advised in the program literature, on mice being considered to be siblings if the likelihood probability was more than 0·85. Each identified family was quite small comprising only a few mice (n = 2 to n = 7). A range of prevalences were found in each of the families, for example, 2 families had 0% prevalence and one family had 85·7%. This suggests that differences in prevalence of T. gondii between families and could support the notion of a mechanism that maintains transmission within families. However, due to the small numbers of mice this phenomenon could not be shown to be significant (χ 2 = 0·284, d.f. = 1, P = 0·5943).
DISCUSSION
In this study, we investigated the prevalence and genotypes of T. gondii in natural populations of wood mice (A. sylvaticus) in an area relatively free of cats with less than 2·5 cats per km2 (Hughes et al. Reference Hughes, Thomasson, Craig, Georgin, Pickles and Hide2008). Despite the absence of cats, we observed a very high prevalence of the parasite, with 34·92% (95% CI: 27·14–43·59%) of all mice being infected. This is similar to a previous study on a different set of A. sylvaticus caught in the same location which found that 40·78% of mice harboured the parasite (Thomasson et al. Reference Thomasson, Wright, Hughes, Dodd, Cox, Boyce, Gerwash, Abushahma, Lun, Murphy, Rogan and Hide2011). The results of both studies are, however, in contrast with a study on wild rodents, from Germany, where they found 0% prevalence in field mice, shrews and voles (Herrmann et al. Reference Herrmann, Maksimov, Maksimov, Sutor, Schwarz, Jaschke, Schliephake, Denzin, Conraths and Schares2012). The prevalences in small mammals in Europe vary, depending upon the rodent species, detection technique used and location where the study was conducted. In a similar, PCR based, recent study 0·7% of Microtus arvalis in Austria were positive (Fuehrer et al. Reference Fuehrer, Bloschl, Siehs and Hassl2010). Some serological studies show high prevalences in natural populations of small mammals, for example, in the Ardennes (France), the prevalence in shrews (Sorex spp.) was 60%, moles (Talpa europaea) 39% and voles (Arvicola terrestris) 39% (Afonso et al. Reference Afonso, Poulle, Lemoine, Villena, Aubert and Gilot-Fromont2007), with a later study by the same authors showing a lower prevalence in the aforementioned species and only 2·5% in A. sylvaticus (Gotteland et al. Reference Gotteland, Chaval, Villena, Galan, Geers, Aubert, Poulle, Charbonnel and Gilot-Fromont2014). Higher seroprevalence was also observed in North America in Peromyscus spp., (between 23 and 31%) while in another study the species Mus musculus and Microtus californicus were negative (Dabritz et al. Reference Dabritz, Miller, Gardner, Packham, Atwill and Conrad2008).
Little is known of genotypes of T. gondii circulating in wild populations of Apodemus. In our study, Type II and III banding patterns were the most common in the infected animals. However, interestingly, detailed analysis of banding patterns indicated that possible mixed strain infections might be occurring in this population of wood mice. It is commonplace to assign genotypes using a 10 RFLP system (Su et al. Reference Su, Zhang and Dubey2006; Shwab et al. Reference Shwab, Zhu, Majumdar, Pena, Gennari, Dubey and Su2013), however; it was not possible for us to assign such a system to these mice due to an inability to consistently amplify the other markers directly from these tissue samples. Furthermore, there was no opportunity for us to isolate viable parasites to verify the presence of mixed strains. As mixed genotypes have rarely been reported before, this is potentially a very interesting observation but requires future investigation to explore in more detail.
The presence of putative mixed infections observed in these mice could possibly be due to recombinant genotypes produced if the definitive host is present within the transmission system. Interestingly, in the location studied here, this appears not to be the case as cats have been rarely reported (Hughes et al. Reference Hughes, Thomasson, Craig, Georgin, Pickles and Hide2008). The routes of transmission operating in this study location are unclear. The putative mixed genotypes are suggestive of infection of the Apodemus by ingestion of oocysts. However, if that were the case then we would expect an increase in prevalence with age due to older animals having a greater opportunity to contract the infection. But in our study no significant age prevalence effect was observed, although this could be due to the difficulty in establishing age in wild wood mice or to other confounding effects. Interestingly, also, our data suggest that the infection status of A. sylvaticus is more closely linked to genetic population structure rather than location. There are several possible interpretations for this. Firstly, different populations have some genetic differences in susceptibility of infection. As far as we can ascertain, there are no examples of this reported, in wild rodents, although laboratory studies have shown that inbred lines of rodents differ in their susceptibility to T. gondii (Li et al. Reference Li, Zhao, Zhu, Ren, Nie, Gao, Gao, Yang, Zhou, Shen, Wang, Lu, Chen, Hide, Ayala and Lun2012; Lilue et al. Reference Lilue, Muller, Steinfeld and Howard 2013 ; Zhao et al. Reference Zhao, Zhang, Wei, Li, Wang, Yi, Shen, Yang, Hide and Lun2013). Another interpretation is that vertical transmission is occurring and that T. gondii is being selectively transmitted through related lineages. In this study, a possibility of addressing this could have been available by tracking parasite genotypes through host genetic populations. However, the mixed genotypes we observed prevented us from testing any association of parasite genotype with host genotype. There is evidence that vertical transmission can occur in rodents (Marshall et al. Reference Marshall, Hughes, Williams, Smith, Murphy and Hide2004; Hide et al. Reference Hide, Morley, Hughes, Gerwash, Elmahaishi, Elmahaishi, Thomasson, Wright, Williams, Murphy and Smith2009) including in Apodemus (Owen and Trees, Reference Owen and Trees1998). Previous studies on sheep (Morley et al. Reference Morley, Williams, Hughes, Terry, Duncanson, Smith and Hide2005, Reference Morley, Williams, Hughes, Thomasson, Terry, Duncanson, Smith and Hide2008) have shown that when pedigree analysis is carried out on family lineages, there is evidence that the parasite is unevenly distributed amongst families even when they are exposed to the same environment (and therefore, presumably, at the same risk of infection from oocysts). In order to investigate this possibility further in this Apodemus population, population genetic data were analysed using a program called COLONY which can use microsatellite genotypes to assign sibling pairs to enable construction of family relationships. Unfortunately, many families were generated suggesting that it would not be possible to get large enough within family sample sizes to statistically address this question. Indeed, there was no significant difference in prevalence of T. gondii between families, and the very large 95% confidence intervals suggested that this was almost certainly due to small sample sizes (n = 2 to n = 7) of mice in each family. To conduct future work on such a very detailed family-based analysis like this, on natural populations of Apodemus, will involve sampling on a considerably greater scale.
Despite the detailed analysis conducted here, it is clear that it will remain difficult to investigate the importance of the different transmission routes of T. gondii infection in natural populations of wild animals. The link, reported here, to host genotype is interesting. Whether this reflects some underlying vertical transmission of the parasite or differences in host genetic susceptibility will require further research. It also demonstrates the need for a deeper insight into the mechanics of T. gondii transmission, at a localized level, in natural populations of wild animals.
ACKNOWLEDGEMENTS
The authors acknowledge the help of undergraduate students at the University of Salford for their involvement in fieldwork and analyses which led up to this work. The authors would like to thank Dr Belgees Boufana for help with genotyping and other assistance in the Laboratory. The authors would also like to thank Malham Tarn Field Centre, and its former Director, Adrian Pickles, for the use of laboratory facilities and the National Trust for granting permission to sample within the Nature Reserve. The authors would like to thank Dr Katarina Reiterova for the SR reference strain DNA.
FINANCIAL SUPPORT
The authors would like to acknowledge the University of Salford (GTA Scheme) for funding and the British Society of Parasitology (JB, KB).