Introduction
A sharp decline in the labor market activity of the elderly male population is regarded as one of the most significant labor-market changes in America during the past century. In 1880, nearly four out of five men aged 65 and older were gainfully employed in the United States (Costa Reference Costa1998; Moen Reference Moen1987). Today, less than 20 percent participate in the labor force. Many economists have attributed the decline to the factors that influence labor supply decisions of older persons.Footnote 1 In particular, the implementation and expansion of social insurance programs such as Social Security has been regarded as the major cause of the long-term decline in the labor force participation rate (LFPR) among older men.Footnote 2 On this issue, however, the current literature often neglects that nearly half of the decline in the economic activity of older men since 1880 happened before the Social Security Act was passed. As will be surveyed in the following text in detail, it is not entirely clear what made the elderly male workers leave the labor force earlier than before, even prior to the rise of the welfare state.
According to contemporary accounts, the features of the workplace such as production technology, managerial practices, work organization, employment relations, and labor-market conditions played more important roles in determining the timing of retirement in the past than they do today. For instance, it was widely believed that the increased speed and intensity of work forced elderly workers out of the labor market either by diminishing their relative productivity or by making their employment more costly (Epstein Reference Epstein1928; Graebner Reference Graebner1980; Squier Reference Squier1912). Some claimed that the decline in job flexibility, often resulting from changes in work organization and workplace management, made it difficult for elderly employees to make gradual adjustments in response to the influences of aging. As technological advances made formal education and on-the-job training more crucial for improving productivity, employers increasingly hesitated to hire older workers probably because their skill sets have rapidly become obsolete and training them would pay off little. Some of the adverse impacts of industrial changes on the labor-market status of older workers could have been mediated by deteriorating health.
The purpose of this article is to study how industrial characteristics affected the employment of older manufacturing workers in the early-twentieth-century United States. More specifically, the article investigates how the probabilities of long-term unemployment in 1910 and retirement between 1900 and 1910 were related to the different features of the industry in which the older worker was employed, such as industry-specific labor-market conditions, size of establishment, labor productivity, input mix, hours of work, use of electric power, and employment structure. For this purpose, the Integrated Public Use Micro Samples (IPUMS) of the 1910 census and a longitudinal sample of Union Army veterans that have been linked to industry-level data compiled from the 1899 and 1909 manufacturing census reports were utilized.
This paper suggests that the incidence of long-term unemployment among older males differed considerably across industries. Industrial characteristics that were related to more favorable labor-market status of older industrial workers include higher labor productivity, less capital- and material-intensive production, a shorter workday, lower intensity of work, greater job flexibility, and more formalized employment relationship. The industrial transformations in the Industrial Era brought mixed consequences to the labor-market status of older workers, and the labor-market experiences of individual older workers were heterogeneous. This paper finds that aged industrial workers were heavily concentrated in “unfavorable” industries, which suggests that the contemporary argument of “industrial scrap heap” was reality for the majority of manufacturing workers.
The study may add new quantitative evidence to the literature regarding the labor-market status of older workers and the nature of retirement in the past. Relatively, there are abundant microlevel studies pertaining to long-term unemployment and retirement of older male workers in the early-twentieth-century United States (Carter and Sutch Reference Carter and Sutch1996; Costa Reference Costa1998; Lee Reference Lee1998, Reference Lee2002, Reference Lee2005; Margo Reference Margo1993; Moen Reference Moen1994). However, this study is distinct from previous works because it examines the roles played by industrial features, together with personal characteristics. This paper may also help understand why the LFPR of older men declined prior to the Social Security era.
Industrial Changes and Old Labor
The United States experienced rapid maturing and deepening of industrialization from the late nineteenth to early twentieth century. This period is often referred to as the Industrial Era. As a consequence, the proportion of the labor force employed in agriculture greatly shrank during the period. It is well documented how the change in the industrial structure affected the employment of older Americans during the period. It has been widely acknowledged in both contemporary and historical studies that self-employed jobs, farming in particular, were more favorable for the employment of older workers than wage jobs because of their greater flexibility. The self-employed can remain in the workforce until old age by adjusting their work efforts in accordance with changing health, preference, and economic need. This is similar to the condition in the early twentieth century.Footnote 3
This reasoning led early studies on the older labor force to a conclusion that the decline of agriculture had brought a decline in the labor market involvement of older men (Bancroft Reference Bancroft1958; Durand Reference Durand1948; Long Reference Long1958). Recent quantitative evidence has confirmed that sectoral shifts that occurred between 1880 and 1940 substantially decreased the overall LFPR of older males in the United States. Lee (Reference Lee2002) has estimated that the decrease in the labor force employed in farming accounted for nearly a quarter of the decline in the LFPR of men aged 60 and older between 1880 and 1940. Lee (Reference Lee2005) has suggested that industrialization was responsible for growth of the sectors that brought about the strong pressure on old age employment.
During the period, the US economy went through dramatic industrial and technological transformations, often called the “Second Industrial Revolution,” characterized by growth of large modern firms, emergence of new products, power sources, technologies, and changes in industrial structure (Chandler Reference Chandler1977, Reference Chandler1990). It was during this period that scientific knowledge began to be systematically applied to industrial technology, mass-production methods spread, and knowledge of scientific management was adopted in workplaces. The technological changes of that era were arguably the most critical in all of modern times in terms of the magnitude of the long-run impact on productivity and human well-being—even more important than the “First Industrial Revolution” or the “Information Technology Revolution” in the recent decades (Gordon Reference Gordon2000).
Contemporary observers believed that elderly workers were reduced to “industrial scrap heap,” victimized by the consequences of technological changes. According to these accounts, elderly industrial workers were subject to a greater probability of job loss and forced retirement due to unfavorable work conditions, such as less flexibility and greater intensity of work (Epstein Reference Epstein1928; Squier Reference Squier1912). A well-known anecdote is the exodus of the elderly operatives from the printing industry upon the adoption of a faster machine (Graebner Reference Graebner1980). It has also been suggested that industrialization brought greater disadvantages in employment associated with aging, such as more serious age discrimination and greater importance of job-specific skills that inhibited the hiring and training of older workers (Haber Reference Haber1983; Slichter Reference Slichter1919).Footnote 4
A case study of the American shoe industry has described how the mechanization of production diminished the flexibility of the work and the advantages of experienced workers as follows:
The machine ended worker control over their time; factory discipline involved far more than fixed hours for starting and stopping the workday and taking meals. The flow of work through the factory was tightly scheduled, and each step was a carefully regulated part of the whole production process. Workers had to be at their machine performing their tasks and no longer controlled the pace of flow of work. . . . The fragmentation of tasks and their mechanization greatly reduced the length of time it took to train a worker. . . . This separation was so complete that even an experienced machine operative was unproductive if put on another machine until he had gone through the same training period as a new hand.Footnote 5
Quantitative research in recent years regarding older labor during the Industrial Era provides mixed results. More optimistic results suggested that aged workers fared well economically and they voluntarily left their jobs. Costa (Reference Costa1998) estimated that 90 percent of the decline in the LFPR of older males between 1900 and 1930 could be attributed to secularly rising incomes. Carter and Sutch (Reference Carter and Sutch1996) maintained that many men in early-twentieth-century America planned their retirement based on wealth accumulation. In support of this view, Gratton (Reference Gratton1996) reported that earnings of elderly workers substantially increased between 1890 and 1950 both in absolute and relative values in comparison with the earnings of younger employees.
More pessimistic evidence provides that retirement in the past was more forced than it is today; and retirement decisions in the pre–Social Security era were perhaps influenced more strongly by demand-side factors. Long-term unemployment of older male workers in 1900 greatly reduced their chances of remaining in the labor force by 1910 (Lee Reference Lee1998). Older men who had better occupations in terms of economic and work conditions in 1900 were less likely to retire by 1910 than were those with poorer jobs, suggesting that retirement in the past was perhaps more forced than voluntary (Lee Reference Lee2005). A number of studies on Britain and France in early twentieth century also support the view that older persons in the era of industrialization, especially those in the working classes, were generally poor and that their retirement decisions were probably more strongly determined by the absence of appropriate employment opportunities, rather than substantial assets or nonlabor income (Baines and Johnson Reference Baines and Johnson1999; Bourdieu et al. Reference Bourdieu, Kesztenbaum and Postel-Vinay2011; Johnson Reference Johnson1984, Reference Johnson1994).
The current study is distinct from previous works on this issue in several respects. First, it focuses exclusively on the experiences of manufacturing workers who were perhaps most strongly influenced by the technological changes during the Industrial Era. Second, it compares measures of labor-market status of older workers across narrowly classified industries within the manufacturing sector, which allows us to examine how the impact of industrial changes varied across men employed in different industries. Finally, it investigates how the employment of older workers was affected by industrial features related to production technologies and work environment, together with personal characteristics.
Data
To study how industrial characteristics affected the labor-market activity of older workers, it would be desirable to use firm-level data that contain information on both the technological and managerial characteristics and the employment status of workers employed in each firm. Unfortunately, no such data are currently available for the period this study is looking into. This data limitation is circumvented by matching microsamples of population censuses (which provide information on labor-market status of individuals) with published manufacturing census reports (which offer average statistics on various technological and managerial characteristics of each industry), as will be explained in the following text. Of course, it is not completely satisfactory to rely on industry-level analyses, ignoring differences across firms within each industry. However, if industries are classified into reasonably narrow categories, as in this study, the between-industry variations in job characteristics are likely to capture a large fraction of the overall variations.
Published Manufacturing Censuses of 1899 and 1909
Measures of industry-specific technological characteristics have been constructed from the published manufacturing census reports of 1899 and 1909. These volumes provide various average statistics for each manufacturing industry.Footnote 6 The method of classifying industries, and the contents and definitions of statistics differ between census years. The entire manufacturing sector is classified into 350 industries in the 1899 manufacturing census report, and into 260 industries in the 1909 report.
To connect these original industry-level data sets to microsamples of population censuses, the industries in the manufacturing censuses have been reclassified according to the industry coding schemes of the 1950 population census.Footnote 7 The 1950 census classifies industries more broadly than the published manufacturing census reports.Footnote 8 Accordingly, multiple industries in the manufacturing censuses have been combined into a single category and classified as the same industry in the 1950 population census.Footnote 9
In merging multiple manufacturing-census industries into a broader category, the sum (in the case of the total amount or number) or the weighted average (in the case of the mean or percentage) of each variable has been computed and assigned to the industrial category. In these computations, the number of wage earners employed in each industry was used as its weight, because the major purpose of this study is to examine the labor-market experiences of workers. As a consequence of this merging process, the original 260-industry data set, compiled from the 1909 manufacturing census, was transformed into a new data set composed of 56 more broadly classified manufacturing industries. Similarly, the original 350-industry data set, drawn from the 1899 manufacturing census, was reshaped into a data set containing 60 industries.
IPUMS of the 1910 Census
To study how the technological characteristics of a particular industry affected the probability of long-term unemployment of the workers employed in the industry, the industry variables drawn from the published 1909 manufacturing census have been linked to the IPUMS of the 1910 census (Ruggles and Sobek Reference Ruggles and Sobek1998). The 1910 census was the first to report information on both industry and the length of unemployment of individuals. The empirical analyses were based on a sample of 4,549 male manufacturing workers aged 45 and older. Where the industry variables were utilized, the sample was further restricted to those who were employed in the 56 manufacturing industries covered by the matched data set.
Longitudinal Sample of Union Army Veterans
A longitudinal sample is needed for studying the probability of retirement. For this purpose, a sample of white Union Army veterans who had been linked to the 1900 and 1910 censuses, as well as military, pension, and surgeons’ medical records have been matched to the industry-level data sets explained previously. Considering the age distribution of individuals included in the data (the mean age of the veterans in 1900 was about 58), the Union Army sample linked to the 1900 and 1910 population censuses should be suitable for examining retirement patterns.
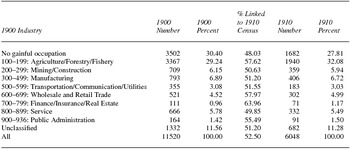
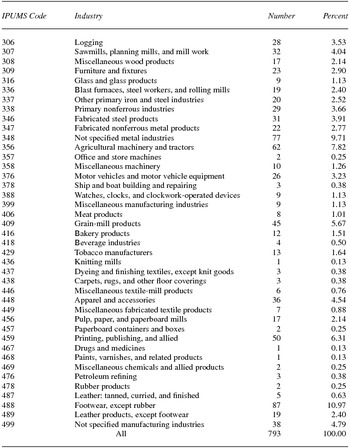
In using this sample, a difficulty arose. The 1900 population census did not provide information on the industry in which a given person was employed. However, occupational descriptions recorded in the census can be used for the identification of the industry that the majority of the individuals in the sample was employed in.Footnote 10 By exploiting this information, the three-digit 1950 industry codes for 6,699 veterans out of 8,469 men with nonmissing occupational titles was determined. Of these veterans, 793 men (12 percent of the sample) were employed in a manufacturing industry. This sample was further restricted to men who were linked to the 1910 census and who were gainfully employed in 1900.Footnote 11
Industrial Differences in Long-Term Unemployment of Older Workers
The long duration of unemployment has been cited as one of the major indicatives of the fragile labor-market status of older workers in the early twentieth century. Previous studies have suggested that though older workers were less likely to be unemployed than younger workers, they had greater difficulty locating new jobs once laid off (Keyssar Reference Keyssar1986; Margo Reference Margo1993; Slichter Reference Slichter1919).Footnote 12 Deteriorating physical strength and health, obsolete skills and knowledge, and lack of formal education as compared with their younger cohorts are some of the potential factors that may have limited employment opportunities for elderly workers. In addition, formal or informal discrimination against elderly workers made it difficult for them to find new jobs.Footnote 13
Long-term unemployment, often defined as being unemployed for six months or longer during a given year, has also been acknowledged as a major reason for leaving the labor force in the early twentieth century. Margo (Reference Margo1993) reported that long-term unemployment among the elderly circa 1900 was an intermediate step toward nonparticipation. Lee (Reference Lee1998) found that elderly men who were unemployed six months or more in 1900 were more likely to be out of gainful employment ten years later. Lee (Reference Lee2005) suggested that older workers were more likely to leave their job between 1900 and 1910 if initially employed in an occupation in which the relative incidence of long-term unemployment was higher. In the light of these results, a greater probability of long-term unemployment among older workers in the early twentieth century may be regarded as indicative of a greater pressure toward leaving the labor force.
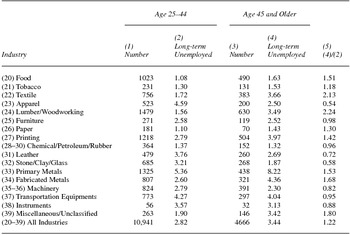
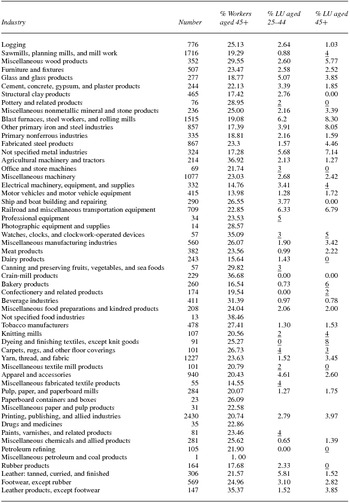
Table 1 presents the percentage of manufacturing workers in the IPUMS of the 1910 census who were unemployed for 24 weeks or more during the 1910 census year, separately for prime-age workers (aged 25 to 44) and older employees (aged 45 and older). Men aged 45 and older were classified as “older workers,” on the basis of the contemporary accounts that many industrial workers in the early twentieth century began to face various disadvantages in employment associated with aging from their mid-forties. The 1910 population census did not report the weeks of unemployment for a fraction of individuals. Hence, the full sample was used for the computation, with the assumption that the individuals who did not report the weeks of unemployment were not the long-term unemployed.Footnote 14 The 56 manufacturing industries were grouped into 17 broader industrial categories for this computation.Footnote 15
Incidence of long-term unemployment by industry in 1910.

Source: IPUMS of the 1910 census.
Note: Two-digit Standard Industrial Classification code is given in parentheses.
The absolute incidence of long-term unemployment for older workers (column 3 of table 1) is not a completely appropriate index of disadvantages in the labor market associated with aging. It is well documented that fluctuations in demand for labor, especially those resulting from seasonality and industry-specific business cycles, were important causes of long-term unemployment for both young and old workers during the period under study. In this respect, it would be sensible to look at a relative measure of long-term unemployment of the older workers in comparison with prime-age workers in the same industry.Footnote 16 Accordingly, the final column of table 1 offers the ratio of the incidence of long-term unemployment among male workers aged 45 and older to that among men aged 25 to 44.
The result reported in table 1 shows that the incidence of long-term unemployment among older manufacturing workers considerably differed across industries even within the manufacturing sector. The probability of being unemployed for 24 weeks or more in 1910 was particularly high, both absolutely and relatively, among older workers employed in the textile, lumber and wood working, printing, primary metals, and fabricated metals industries. In contrast, older workers were much less likely to experience long-term unemployment than prime-age workers in the apparel, leather, stone, clay, and glass industries.
Logistic regressions were performed to compare the probability of long-term unemployment with controlling the personal characteristics of the worker across industries. This is done to see how much of the observed industrial disparities in the incidence of long-term unemployment were attributable to the influences of industry-specific employment conditions rather than the heterogeneity of the labor force across industries. Regressions were performed for both the full sample and for the subsample for which the weeks of unemployment was known. Because the results of the regressions based on the two samples were very similar, subsequent discussions will be based mainly on the results obtained from the subsample with the complete information on unemployment.
Age, race, nativity, marital status, household headship, literacy, family size, home ownership, city size, region, and occupation that have been widely employed in previous studies as determining factors of retirement decisions were included in the analysis as variables pertaining to personal characteristics.Footnote 17 Variables on region and the population size of the place were added to consider differences in labor-market conditions by location. The percentage of male workers aged 25 to 44 who were unemployed for 24 weeks or longer (Young Unemployed) was included as an indicator of industry-specific labor-market conditions. Inclusion of this variable would allow one to identify the interindustry differences in labor-market disadvantages associated with aging, eliminating the effects of variations in seasonality and general labor-market conditions. The apparel industry was chosen as the omitted category because it had the lowest relative incidence of long-term unemployment.
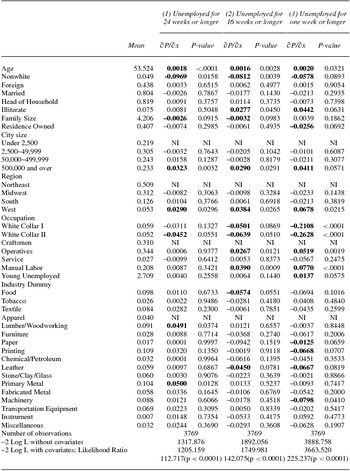
The first column of table 2 presents the result for the probability of unemployment for 24 weeks or more (denoted by P U, hereafter). The relatively high incidence of long-term unemployment among older workers employed in several industries remained visible even if personal characteristics were controlled. In particular, the woodworking and primary metals industries stood out as having the highest P U for older male workers. Printing and fabricated metals also showed particularly high P U, although they missed statistical significance by small margins (p-values are, respectively, 0.135 and 0.165). The other industries were statistically not different from the apparel industry, the control group.
Industrial differences in the probability of long-term unemployment in 1910 male manufacturing workers aged 45 and older.

Source: IPUMS of the 1910 census linked to the published 1909 manufacturing census.
Note: The dependent variable for each regression is one if the person was unemployed for 24 weeks or longer during the year prior to the enumeration of the 1910 census, and zero, otherwise. The mean of the dependent variable is 0.042 for (1), 0.069 for (2), and 0.211 for (3). The sample was limited to individuals for whom the number of weeks unemployed was reported. Statistically significant variables are given in bold numbers.
The estimated effects of individual characteristics are summarized as follows. P U increased with age, as previously reported by Ransom and Sutch (Reference Ransom and Sutch1986) and Margo (Reference Margo1993). Nonwhite workers were significantly less likely to be unemployed for 24 weeks or more than whites. Family size was negatively related to P U. The effects of race and family size could reflect a lower level of reservation wages of nonwhites and men with a large family arising from their greater economic needs. Dwellers in a city with 500,000 or more residents were subject to a greater risk of long-term joblessness than individuals who lived in a smaller place. P U among older men was significantly higher in the western region than in other regions. White-collar workers were less likely to be unemployed for a prolonged period than blue-collar workers.
The industrial differences in the probability of being unemployed for a shorter period (as offered by the results reported in columns 2 and 3 in table 2) were much different from the results for long-term unemployment. The more severe labor-market disadvantages associated with aging in the four industries cited in the preceding text were no longer present when short-term unemployment was concerned. The probability of unemployment for one week or longer (column 3 of table 2) was significantly lower in the paper, printing, leather, and fabricated metals industries than those in other industries. It is notable that there was little uniformity in the effect of industry on unemployment across the three regressions. In contrast, the effects of the variables related to personal characteristics were similar across the three specifications. Perhaps, this is the case wherein the risk of losing a job in the first place and the likelihood of finding a new job when unemployed were influenced differently by industrial characteristics.
The patterns of long-term unemployment among older male workers in the Industrial Era may not simply be explained by interindustry differences in technological progress, which is measured by productive efficiency. It is an established fact that the primary and fabricated metals and printing industries experienced major technological innovations during the late nineteenth and early twentieth century.Footnote 18 However, the woodworking industry was not a forerunner in technical progress by the turn of the twentieth century, although it was one of the symbols of the American system in the mid-nineteenth century.Footnote 19 Furthermore, the relative incidence of long-term unemployment among older males was not high in a number of Chandlerian industries such as food, chemicals (including petroleum and rubber), machinery (including electric machinery), and transportation equipment in which large modern corporations in the United States were heavily concentrated in, and which were regarded as the most capital- and technology-intensive industries of the time.Footnote 20 Thus, it is not sensible to relate the different labor-market status of older workers simply to variations in conventionally defined technical progress. This calls for looking into a broader range of industrial characteristics representing work environment as well as productive efficiency, which will be discussed in the latter part of this article.
Industrial Characteristics Related to the Employment of Older Industrial Workers
Based upon the industrial statistics reported in the 1909 manufacturing census, the variables that were likely to be related to the employment of older workers were derived. As a measure of labor productivity, the log of the value of product per production worker (Productivity) was employed.Footnote 21 Three variables, namely, the size of establishment, choice of input mix, and use of electricity were selected as both indexes of technology and measures of work environment. The size of establishment (Firm Size) was measured by the log of the value of total product. The expenditure on nonlabor inputs, such as materials and fuels, as percentage of the total costs was employed as the relative importance of nonlabor inputs (Nonlabor Input). Firm Size might capture a wide range of technical and organizational transformations accompanied by the rise of modern large firms famously documented by Chandler (Reference Chandler1977, Reference Chandler1990). Inclusion of Nonlabor Input allows one to consider the influences of capital-using and material-using biases that were present in the technical progress in US manufacturing (Cain and Paterson Reference Cain and Paterson1981).
It has been believed that electrification greatly transformed the work environment, as well as the productive efficiency in US manufacturing during the early twentieth century.Footnote 22 By 1909, electric drive accounted for 25 percent of total capacity for driving machinery.Footnote 23 When electricity was first used for driving machinery in the manufacturing sector in the 1880s, the major form of driving system was “electric line shaft drive” that replaced a steam engine with one or more electric motors, leaving the power distribution system unchanged. During the first two decades of the twentieth century, this rather primitive system was rapidly replaced by the “group drive” (referring to a system in which a group of machinery was operated by an electric motor), and then by the “unit drive.”
On one hand, these changes in power system greatly improved working environment and flexibility of production, which perhaps favorably affected the employment condition of older workers. Absence of the belts, pulleys, and shafts, required for overhead power transmission, led to improvements in illumination, ventilation, and cleanliness.Footnote 24 The group or unit drive enhanced the flexibility of production by allowing the operator to conveniently vary the speed of his or her machine. On the other hand, electrification may have increased the intensity of work. Adoption of the group or unit drive diminished time lost by making it possible to shut down only a single or a small number of machinery rather than the entire factory when a mechanical problem or need for speed change occurred. New technology and scientific management procedure, often believed to be closely related to electrification of production (Whaples Reference Whaples1990b), may have intensified the work as well. To take into account these potential impacts of utilizing electric power, the total horse power driven by electricity per production worker (Electricity) was included in the analysis.
In addition, several indirect measures of hours, intensity, and flexibility of work were employed in the study. First, the percentage of workers employed in an establishment in which the prevailing hours of work was 60 and over (Hours 60 and Over) was considered. Lengthy work was perhaps a major factor that prohibited older workers from continuing to work. A study of microcensus linked to city-level statistics has suggested that older workers had a higher LFPR when the work week fell (Whaples Reference Whaples1990a).
Second, the percentage of female workers (Female) was considered as a proxy variable of the requirement for physical strength and other types of human capital. Goldin (Reference Goldin1990: 81) has reported that the manufacturing industries circa 1900 were heavily segregated along the gender lines and that many of the male-intensive industries required substantial amounts of strength or more training. Thus, industries with a larger fraction of female employees could have been more favorable for the employment of older male workers. This conjecture seems to be consistent with the fact that Female was positively correlated with some indexes of lower work requirements and higher flexibility.Footnote 25 If female workers were inferior to male workers in the early-twentieth-century manufacturing industries, a higher proportion of women in an industry might indicate a tighter labor-market condition that led employers to turn to less-preferred job candidates. However, this conjecture was not supported well by the patterns of correlation between industry variables.Footnote 26
Third, the number of superintendents and managers per 100 production workers (Manager) was included as a proxy variable of work organization and managerial practices. Until the early twentieth century, the overall operation of work floor in manufacturing units, including decisions on employment, wage, and work organization, was largely controlled by foremen (Jacoby Reference Jacoby1985). According to a Marxist account, companies hired more managers and superintendents in an effort to curb the power of the so-called craft control during the late nineteenth and early twentieth century (Lazonick Reference Lazonick1990). Thus, Manager could have been related to the development of more formal management of workplaces. Indeed, Manager was positively correlated with some measures of the stability of employment relationship.Footnote 27 It is likely that the formalization of workplace management began in more advanced and productive industries. If this was the case, Manager should be positively correlated with measures of technological and managerial development. Indeed, this was the case. It was positively and statistically significantly correlated with capital-labor ratio, electric power use per worker, percentage of expenditure on nonlabor inputs, and the value of product per worker.Footnote 28
Finally, the number of clerks per 100 production workers (Clerk) as a measure of production technology and demand for white-collar workers was considered. It has been widely acknowledged that technology and skilled labor are complementary in production. Because white-collar workers employed in manufacturing in the early twentieth century were largely skilled workers, a higher proportion of clerks could be regarded as an index of technological progress. In fact, Clerk was positively correlated with measures of higher productivity and more advanced production technology.Footnote 29 Clerks in the early nineteenth century were recruited mostly from a pool of younger and more educated persons. Thus, compared to production workers and older workers who, on the average, were less educated, a larger value of Clerk might indicate lower demand for older workers as well.Footnote 30
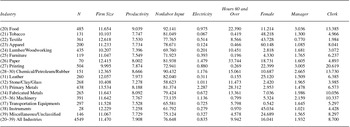
Table 3 presents the sample means of these industry variables computed for each industry group. The selected measures of work environment were markedly different across industries, even within the group of sectors in which the extent of technical progress was arguably comparable. For example, the chemicals/petroleum/rubber and primary metals industries were among the leading sectors with technical and organizational innovations in that era (Chandler Reference Chandler1977). This reputation was reflected in the result that shows these two industrial groups at or near the top of the orders of Firm Size and Productivity with relatively similar values. However, there were substantial differences between the two industries in terms of Electricity, Hours 60 and Over, Female, Manager, and Clerk. These suggest that technical improvements and organizational innovations in the manufacturing industries, though introduced for the same purpose of improving productivity, considerably differed across industries in terms of their features and their influences on the work environment of older workers.
Sample means of industrial characteristics by industry group.

Source: IPUMS of the 1910 census linked to industry-level data compiled from the published report of the 1909 manufacturing census.
Note: See text for definition of variable. N denotes the number of men aged 45 and older included in the IPUMS of the 1910 census who were employed in the given manufacturing industry.
Industrial Characteristics and Employment of Older Workers: Regression Results
Regression Analyses for Long-Term Unemployment
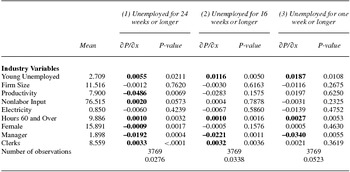
Regressions were conducted to examine how the variables pertaining to industrial characteristics introduced in the preceding section influenced the probability of long-term unemployment (P U). Standard errors were adjusted for clustering at industry level. The same variables on personal characteristics employed in the previous regressions reported in table 2 were included in addition to the industry variables. The results are reported in table 4. The regression results for individual variables were remarkably similar to those reported in table 2, and thus omitted from the table.
Industrial characteristics and the probability of long-term unemployment male manufacturing workers aged 45 and older.

Source: IPUMS of the 1910 census linked to the published 1909 manufacturing census.
Note: All the independent variables pertaining to personal characteristics (reported in table 2) were included in the regressions, but omitted from the current table. The dependent variable for each regression is one if the person was unemployed for 24 weeks or longer during the year prior to the enumeration of the 1910 census, and zero, otherwise. The sample was limited to individuals for whom the number of weeks unemployed is reported. Statistically significant variables are given in bold numbers. Standard errors are adjusted for clustering at the industry level.
A few variables pertaining to technological and managerial features exerted significant effect on P U. Young Unemployed was positively related to P U. Productivity was negatively associated with P U. By contrast, Nonlabor Input was positively related to P U, whereas, Firm Size and Electricity had no significant effect. This suggests that although more efficient production was innocuous for elderly workers, more capital- or material-intensive production technology tended to hurt their labor-market status.
As iterated previously, measures of length, intensity, and flexibility of work turned out to be significant predictors of long-term unemployment of older workers. Hours 60 and Over was positively associated with P U, and Female had a negative effect on P U. Clerk also had a strong positive effect on P U. Lastly, a more formal employment relationship was perhaps beneficial for older workers, as indicated by the strong positive effect of Manager on P U.
In addition to this baseline regression, similar regressions were performed in which the probabilities of being unemployed for 16 weeks or more and one week or more were used as dependent variables (columns 2 and 3 of table 4). A comparison of these results reveals that industry variables had a stronger effect on long-term unemployment than on unemployment for a shorter period. In contrast, occupational differences in the probability of unemployment were smaller for lengthier joblessness than for short-term unemployment. This implies that interindustry differences in technological and managerial characteristics largely affected the degree of difficulty of finding a new job when unemployed rather than the risk of losing one's job.Footnote 31
The regression results were generally consistent with the interindustry differences in the labor-market status of older workers. The particularly higher incidence of long-term unemployment in several industries (table 2) is explained reasonably well by the results reported in tables 3 and 4. For example, in case of the primary metals industry, the particularly high value of Hours 60 and Over and low value of Female were perhaps the major reasons that produced the highest incidence of long-term unemployment.Footnote 32 Similarly, the very low values of Productivity and Female, as well as the relatively high value of Hours 60 and Over might at least partially explain the high rate of long-term unemployment among older males employed in the woodworking and lumber industry. A regression result, not reported in the paper, offers that the interindustry differences in long-term unemployment (presented in table 2) were no longer present if the variables related to industry-specific technology and work environment were controlled. This indicates that different industrial characteristics captured by the variables considered in this analysis could explain a large fraction of the differences in labor-market status of older males across industries.
Regression Analyses for Retirement
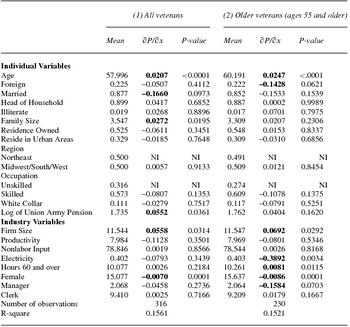
The study also investigated how industrial characteristics affected retirement decisions, using a sample of 316 Union Army veterans who were active manufacturing workers in 1900. A regression model similar to that used in analyzing long-term unemployment presented in equation 5 (replacing P U with PR , denoting the probability of leaving the labor market between 1900 and 1910) is employed.Footnote 33 Some minor modifications have been made to consider some differences in data. The log value of Union Army pensions was added to consider the previous results that stated that Union Army pensions greatly increased the probability of retirement of veterans (Costa Reference Costa1998; Lee Reference Lee1998, Reference Lee2005). Because the amount of Union Army pensions was determined based on health status, age, and military experiences, this variable might capture the effects of both nonlabor incomes and health. For industry variables, the average of the 1899 and 1909 values were used, wherever possible, to have a closer measure of work environment that the veterans were exposed to during the entire decade under study. For Hours 60 and Over, Manager, and Clerks, which were not available from the 1899 manufacturing census, the 1909 values were used.Footnote 34 Separate regressions were conducted for men aged 55 and older to consider the fact that not many males under age 55 left the labor market for good in the early twentieth century.Footnote 35 The results are reported in table 5.
Industrial characteristics and the probability of retirement between 1900 and 1910 Union Army veterans aged 45 and older.

Source: Longitudinal sample of Union Army veterans linked to 1900 and 1910 censuses, and published 1899 and 1909 manufacturing censuses.
Note: The dependent variable for each regression is one if the person was not gainfully employed when the 1910 census was enumerated, and zero, otherwise. The sample is limited to individuals for who were gainfully employed in 1900. The average of the 1899 and 1909 values were used for the following industry variables: Productivity, Nonlabor Input, Electricity, and Female; the values for 1909 were used for the following industry variables: Hours 60 and Over, Manager, and Clerk. Statistically significant variables are given in bold numbers. Standard errors are adjusted for clustering at the industry level.
In spite of some serious limitations arising from the small and selected sample used for the analysis, the regression results are at least suggestive. The estimated coefficients for Hours 60 and Over, Female, and Manager were all significant, and their signs were the same as those estimated from the regression for long-term unemployment. The parameters for Nonlabor Input and Clerk had the same signs, too, although they were statistically insignificant. However, unlike the results for long-term unemployment, PR was related positively to Firm Size and negatively to Electricity.Footnote 36
As noted previously, the present results are neither representative nor reliable. Moreover, it is difficult to determine whether differences between the two regressions are attributed to employing different measures of labor-market status of older men or to utilizing different samples. Nevertheless, if accepted as real, this result strengthens the argument that length, intensity, and flexibility of work were powerful determinants of labor-market status of older workers. This also suggests that the rise of large corporations had brought about adverse consequences for the employment of elderly workers. The negative relationship between PR and Electricity could be explained by the improvements in the working environment allowed by electrification of the workplace (Devine Reference Devine1983).Footnote 37
Conclusions and Implications
This study has explored how industry-specific technological, organizational, and managerial characteristics affected the labor-market status of older male manufacturing workers in the early-twentieth-century United States. For this purpose, industry-level data have been compiled from the 1899 and 1909 manufacturing censuses and linked to the IPUMS of the 1910 census and a longitudinal sample of Union Army veterans.
The incidence of long-term unemployment among older workers relative to that of prime-age workers, an index of labor-market status of the elderly, was particularly higher in the primary metals, woodworking, printing, and fabricated metals industries than in other sectors. The incidence is true when the personal characteristics of the workers employed in these industries were held constant. Differences in the extent of conventionally defined technical progress did not explain well the industrial differences in the employment status of elderly workers.
The regression results suggested that industrial characteristics that were favorably related to the labor-market status of older industrial workers were higher labor productivity, less capital- or material-intensive production technology, shorter workday, lower intensity of work, greater job flexibility, and more formalized employment relationship. These industrial characteristics accounted for the observed interindustry differences in the incidence of long-term unemployment.
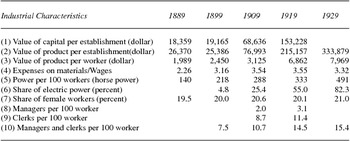
The US manufacturing industries experienced tremendous transformations in production technology, work organization, and managerial practices in the late nineteenth and early twentieth century. Table 6 offers a snapshot of these changes from 1889 to 1929 by providing selected average statistics of the whole manufacturing sector, many of which were considered in this study. It is apparent from the result that firms rapidly grew in size, labor productivity soared, and production became more heavily dependent on materials and energy especially on electric power. It has been well documented that the prevailing hours of work decreased during the period, especially after 1909, although the prevalence of shorter workdays probably came with strengthened intensity of work (Whaples Reference Whaples1990b). In addition, the number of managers per worker and the number of clerks per worker appear to have been increasing.Footnote 38 The proportion of female workers in manufacturing remained stable over the period under investigation in spite of the gradual rise in the LFPR of females.
Changes in selected average characteristics of manufacturing industries, 1889–1929.

Source: Calculated from published manufacturing censuses of 1889, 1899, 1909, 1919, and 1929, except for (5) and (6) that were drawn from Carter et al. (Reference Carter, Sigmund Gartner, Haines, Olmstead, Sutch and Wright2006), table Dd848-853.
The results of the study suggest that the transformations in the US industry had probably brought about both favorable and adverse consequences to the labor-market status of older manufacturing workers. On one hand, technical progress and organizational modifications may have improved their employment prospect by improving labor productivity, diminishing hours of work, and formalizing employment relations. On the other hand, some types of technical innovations that led to a more capital- and material-intensive production may have forced older workers out of their jobs by augmenting the requirements for physical strength, mental agility, and ability to acquire new skills. Given that the pace and features of technical change differed across industries, and possibly across firms within the same industry, the experiences of individual older workers were presumably highly heterogeneous. In some industries, a few elderly workers probably fell to the state of “industrial scrap heap,” as claimed by some contemporary critics. However, such a pessimistic view of older workers may not be generalized for the entire manufacturing industries.
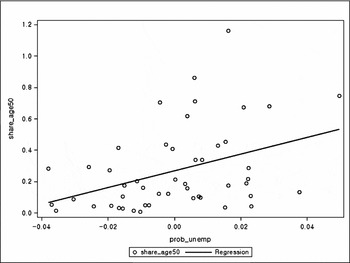
A question remains as to which of the two opposite effects was stronger. This question is related to the issue of whether the “industrial scrap heap” argument describes the experience of a typical industrial worker 100 years ago. A rough way of addressing this question is to investigate whether old manufacturing workers were more likely to be employed in industries where the negative influences of technological changes were stronger than the positive effects. For this purpose, we estimate the industry-specific probability of long-term unemployment predicted by the industry variables utilized in the regression analyses. This procedure is performed by applying the estimated regression coefficient of each industry variable (reported in table 4, column 1) to the industry average of the variable. A relatively high predicted probability of long-term unemployment in a given industry indicates that the technological features of the industry are relatively unfavorable for the employment of old workers.
We then explore how this industry-specific measure of long-term unemployment risk (denoted as “prob_unemp”) is related to the industry's share of male workers aged 50 and above (denoted as “share_age50”).Footnote 39 The result presented in figure 1 shows that the industry's share of aged workers is positively associated with the predicted probability of long-term unemployment. The regression coefficient is 5.2996 (p-value = 0.0053). This value suggests that aged manufacturing workers were heavily concentrated in “unfavorable” industries. Approximately 67 percent of manufacturing workers aged 50 and above were employed in industries where the predicted unemployment risk was above the average of the entire manufacturing sector. Although circumstantial, the evidence provided suggests that the contemporary argument of “industrial scrap heap” was applicable for most of the manufacturing workers in the early-twentieth-century United States.
Relationship between Industry Share of Male Workers 50 or Older and the Predicted Risk of Long-Term Unemployment across Industries

Appendix
Industry composition and rate of successful linkage to the 1910 census of the Union Army sample linked 1900 census.

Industry distribution of manufacturing workers in 1900.

Incidence of long-term unemployment by industry in 1910.

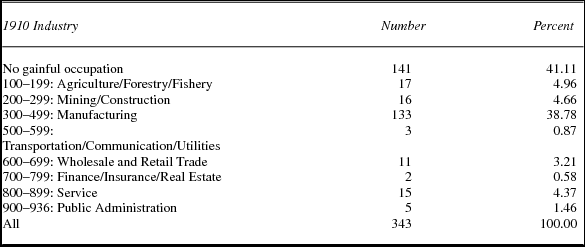
Industry changes of 1900 male manufacturing workers between 1900 and 1910.