


Housing markets have been shaped by racial discrimination and segregation throughout American history. Racially restrictive covenants in deeds, steering by real estate agents, zoning restrictions, slum clearance, the construction of large public housing projects, the routing of interstate highways, discrimination in mortgage lending, the location of segregated schools, unequal labor market opportunities, threats of outright violence directed at black families, lack of protection of property and civil rights have all profoundly affected where African Americans lived and the degree to which they could accumulate housing wealth (Kucheva and Sander Reference Kucheva and Sander2014; LaVoice Reference LaVoice2020; Brinkman and Lin Reference Brinkman and Lin2019; Carruthers and Wanamaker Reference Carruthers and Wanamaker2017; Aneja and Avenancio-León Reference Aneja and Avenancio-León2019; Rothstein Reference Rothstein2017).
The federal government first began directly influencing housing markets in 1933 with the development of the Home Owners’ Loan Corporation (HOLC) and the Federal Housing Administration (FHA). Recent discourse has focused heavily on their role, particularly the role played by maps developed by the HOLC. The HOLC purchased and refinanced over one million troubled non-farm mortgages and held roughly a tenth of all non-farm U.S. mortgages when it finished its refinances in June 1936. Established in 1934, the FHA provided insurance for home maintenance loans, rehabilitation loans, and mortgages, and the program grew to insure more than one-third of all new U.S. residential construction by 1949.
After their lending was nearly complete, the HOLC performed detailed analyses of the mortgage markets in over 200 cities. As part of this process, they developed a series of maps summarizing spatial variation in the riskiness of mortgage lending across neighborhoods in over 200 cities. Scholars have noted the concentration of black households in the highest-risk red-colored zone on these maps. Using the set of digitized HOLC security zone maps made available by the University of Richmond’s Mapping Inequality Project,Footnote 1 social scientists have used the boundaries between neighborhoods to assess the long-run implications of location on the lower-graded side on a range of issues including housing values, neighborhood racial composition, and crime (Faber Reference Faber2020; Aaronson, Hartley, and Mazumder Reference Aaronson, Hartley and Mazumder2021; Anders Reference Anders2023; Krimmel Reference Krimmel2018; Appel and Nickerson Reference Appel and Nickerson2016).Footnote 2
Missing from this literature is a systematic empirical evaluation of how the HOLC maps were constructed in the 1930s and a historically rooted discussion of how they influenced subsequent federal housing policy. This paper documents why and how the HOLC maps were created, what information they embody, and how these maps were used by federal agencies. We explore the factors that determined differences in security grade assignment across neighborhoods and the placement of HOLC boundaries. Given the prevalence of black households assigned to high-risk areas, we pay particular attention to the role race played in security grade determination and boundary placement. Did the majority of black households see their neighborhoods rated as the highest lending risk because they were living there? Or was it the case that low incomes and systemic discrimination across employment, education, and housing left black households with few options outside of segregated neighborhoods marked by crowding, dilapidated structures, and depreciating prices that would have been poor lending risks?
To understand the forces that determined security zone grades and the boundaries between zones, we developed a unique dataset that combines newly digitized versions of the HOLC maps and area descriptions with Census spatial data on individual households and neighborhoods for nine of the ten largest cities in the United States for 1930 and 1940. We first explore how housing and economic characteristics varied across security zones, both in levels in 1930 and 1940 and in trends across the decade. Using a dataset of almost 300,000 addresses matched to both census years, we then explore how demographic and economic characteristics varied at the boundary of HOLC security grades. Finally, we empirically assess the relative importance of racial discrimination in the mapping process that led to the lowest (D) rating in neighborhoods where the vast majority of black families lived.
To summarize neighborhood-level characteristics, the HOLC consulted with local real estate professionals and gave letter grades A, B, C, and D to neighborhoods with map colors of green, blue, yellow, and red, respectively. In our sample, over 95 percent of black homeowners lived in the lowest-rated red D zones. Yet, the vast majority (92 percent) of the home-owning population in the D zones was white.Footnote 3 Home values and occupational scores declined as the security grade changed from A to B to C to D. The D zones had the poorest residents and cheapest housing. Our comparison of black and white neighborhoods in the D zones shows that the white D neighborhoods had better census economic characteristics compared with black neighborhoods. This is the opposite of the pattern we would expect to see if the concentration of black families in D zones was solely the result of racist views held by the HOLC map-makers.Footnote 4
We next conduct a formal boundary analysis of the differences in socio-economic characteristics of households very close to the C-D borders. Using census data from 1930, at least five years before the first HOLC map was drawn, we find that crossing from the C side to the D side of the boundary was associated with a 9 percent fall in housing prices, a 1.3 percentage point drop in occupational income scores (implying a drop of roughly $100 in average income in 1950 dollars), and a 5 percentage point increase in percent black. Analysis of the census trends between 1930 and 1940 shows that home values were deteriorating, occupational scores were trending downward, and black population shares were increasing on the D-side of the boundary relative to the C-side. The real estate professionals consulted by the HOLC thus appear to have chosen boundaries delineating neighborhoods already on different trajectories that could impact lending risk over the long term.
Finally, we consider whether the placement of security zone boundaries reflected racial bias. Using our matched address sample, we explore the location of black households with respect to C-D borders. Identifying the potential for some clustering of black households just inside the D-boundaries, we perform simple counterfactuals in which we move households from C to D zones to eliminate potentially discriminatory outcomes associated with this clustering. We find that the HOLC map boundaries were drawn in such a way as to capture pre-existing discontinuities in neighborhood economic characteristics and that racial bias in the construction of the HOLC maps can explain between 4 to 20 percent of the observed concentration of black individuals in D zones. This result stems from the fact that the majority of black families lived more deeply within neighborhoods that met the HOLC’s criteria for the highest lending risk.
Collectively, our quantitative analysis supports the notion that HOLC maps provide meaningful and accurate information about neighborhood boundaries, characteristics, and trends. The HOLC maps primarily reflect fundamental and longstanding disparities between black and white neighborhoods rather than a determined effort devoted to targeting black neighborhoods for the lowest security grade.Footnote 5 These findings in no way conflict with evidence that documents the racist views held by many, if not most individuals involved in the construction of the HOLC maps.Footnote 6 The forms for the area descriptions tied to the maps, for example, they asked real estate professionals to consider factors like “infiltration” of black or foreign families when assessing neighborhood risk. The evidence documents just how systematic and institutionalized racism was vis-à-vis housing markets when the maps were constructed. The facts on the ground were reinforced with a sort of internal logic: racist attitudes contributed to discrimination on multiple fronts, which led to the pattern of neighborhood demographics and risk described in the HOLC maps, which then motivated a continuation of these patterns.
We conclude with a discussion of the neighborhood risk analyses performed by the HOLC and the FHA. In contrast with the HOLC, the FHA started its mapping well before the HOLC, used block-level data from hundreds of city property inventories, actively publicized the evaluation methods, and provided real estate professionals access to their maps. Scholars should therefore use caution before using the HOLC maps to study the causal impacts of FHA redlining. The HOLC maps are best viewed as providing clear evidence of how decades of systemic racism and unequal treatment effectively limited where black households could live by the late 1930s, rather than simple racial bias implicit in the construction of the maps themselves. In sum, the maps visualize the staggering level of disadvantage experienced by black individuals in early twentieth-century American cities—disadvantages that went largely unaddressed by government at any level until the 1960s.
RACIALIZED HOUSING MARKETS AND THE DEVELOPMENT OF THE HOLC MAPS
Racial segregation and white flight had increased sharply during the early twentieth century in northern cities (Shertzer and Walsh Reference Shertzer and Walsh2019), and racist attitudes were pervasive in local governments and private organizations related to housing. Racist attitudes also influenced the discussions of appraisals in real estate markets by practitioners and academics. In City Growth and Values, a book endorsed by the Executive Secretary of the National Association of Real Estate Boards (NAREB), McMichael and Bingham (Reference McMichael and Bingham1923, pp. 177–81) describe how land values were depressed “where Negroes congregate” and where the foreign-born population might spread from their initial enclaves. They went on to say that “Property values have been sadly depreciated by having a single colored family settle down on a street occupied exclusively by white residents. Segregation of negro population seems to be the reasonable solution of the problem, no matter how unpleasant or objectionable the thought may be to colored residents (p. 181).”
Accordingly, in its 1924 Code of Ethics, the NAREB stated, “A Realtor should never be instrumental in introducing into a neighborhood a character of property or occupancy, members of any race or nationality, or any individuals whose presence will clearly be detrimental to property values in that neighborhood (cited in Winling and Michney Reference Winling and Michney2021, p. 55).” Winling and Michney (Reference Winling and Michney2021) document how leading academics and practitioners discussed the importance of neighborhoods and their racial mix in evaluating real estate. The group included Frederick Babcock, Ernest Fisher, and Homer Hoyt, who were major contributors to the analysis of mortgages in the FHA, and Corwin Fergus, who developed and supervised the HOLC City Survey project (Michney Reference Michney2022).
The attitudes were also represented in local government actions and clauses in housing deeds. City governments in Atlanta, Baltimore, Birmingham, Dallas, Louisville, Norfolk, Richmond, St. Louis, and Winston-Salem (Sterner Reference Sterner1943, p. 206) passed race-based zoning laws in the 1910s. Several were invalidated by state courts, and the Supreme Court ruled against the Louisville law in 1917, but several cities continued to try to pass racial zoning ordinances afterward. As an alternative, a substantial number of neighborhoods wrote racial covenants into housing deeds, which survived court challenges until 1948 (Brooks and Rose Reference Brooks and Rose2013, pp. 38–46; Sterner Reference Sterner1943, pp. 206–9).
Meanwhile, segregation in housing increased sharply during the early twentieth century. Calculations of segregation based on neighbors on Census sheets in both rural and urban areas by Logan and Parman (Reference Logan and Parman2017) show substantial increases over time. Preliminary calculations of segregation indices at the street, enumeration district, and ward levels for 134 cities performed by Logan, Bellman, and Minca (Reference Logan, Bellman and Minca2020) show that segregation increased substantially at each of these spatial scales in each decade between 1900 and 1940, in both the North and South, and in cities with widely varying shares of black residents.
When the Great Depression hit, roughly 40 percent of home borrowers fell behind on their mortgage payments. Families struggled to refinance their loans, and many lending institutions were unable to make new loans (Rose and Snowden Reference Rose and Snowden2013). The federal government responded by establishing the HOLC on 13 June 1933 to buy and refinance home loans that were likely to be foreclosed through no fault of the borrower. When it had finished lending in June 1936, the HOLC had bought over a million loans from lenders, replacing toxic assets on their books, and then refinanced the loans for borrowers using 15-year amortized loans with 4.5 percent interest rates, better terms than in the regular market (Fishback, Rose, and Snowden Reference Fishback, Rose and Snowden2013).
The HOLC provided a substantial amount of assistance to black borrowers. They charged the same interest rate, regardless of the race of the borrower, and actively bought and refinanced loans in low-income neighborhoods for borrowers of all races. In Philadelphia, Amy Hillier (2003b) found that the HOLC refinanced 60 percent of its loans in neighborhoods later given the lowest D-rating. After matching a sample of loans to census records, she showed that black and immigrant borrowers were overrepresented in the pool of homeowners who received refinancing from the HOLC. Fishback et al. (2022b) found similar results in Baltimore, Peoria, and Greensboro. In 1940, the black share of HOLC loans was higher than the black share of homeowners in 47 cities and lower in only 17 cities (Michney and Winling Reference Michney and Winling2019, pp. 10–11). Nationwide, black households accounted for 4.5 percent of mortgages held by the HOLC in 1940, compared with only 2.6 percent held by all other lenders (U.S. Bureau of the Census 1943, pp. 7, 9). The 4.5 percent matched the black share of non-farm homeowners in 1930 and 1940.Footnote 7
In September 1935, after they had refinanced roughly 90 percent of their ultimate loan total, HOLC officials in the Mortgage and Rehabilitation Division began a city survey program.Footnote 8 The goal was to collect information on local real estate and mortgage conditions “to successfully establish policies with respect to the collection on HOLC loans, the management and ultimate sale of acquired real estate as well as to the rehabilitation of the savings and loan industry…” (National Archives n.d., p. 1; Michney Reference Michney2022). Over the next five years, they conducted thousands of surveys of mortgage lenders with questions about the number of loans, foreclosed loans, interest rates, other mortgage terms, and a variety of other factors. However, no questions on race or other characteristics of their borrowers were asked. They then wrote up general reports that were typically 30 to 60 pages long that compiled summary statistics from the lender, provided city-wide information on foreclosure rates, tax delinquencies, tax structures, the development of the city and its terrain, the demographics of the population, and a wide range of statistics about the economy. The reports also contained a section on the quality of neighborhoods in the city that covered two to five pages. The appendices then included the lender surveys, the area descriptions, and the maps. Six copies were made of the full reports. The reports were then distilled into 2- to 15-page summaries with no maps or confidential information. In June 1938, the short summaries were made available to people outside the government (National Archives n.d., pp. 2–5).
Part of the city survey project was devoted to the collection of statistics about the quality of housing and risk of lending in different types of neighborhoods in the city and the development of maps to visualize this information. The agent in charge of the mapping and area descriptions listed the names and bona fides of the professionals they consulted. The consultants influenced the assessments by summarizing information for the area descriptions and then discussing the maps before they were finished. Most cities had between 20 and 30 area descriptions and used from 4 to 12 consultants. The large cities studied here had more area descriptions and, thus, more consultants. As an example, in Cleveland, 19 realtors assisted with the field inspections and preparation of 189 area descriptions, and then a smaller group reviewed the entire map and made suggestions on how to improve it. This group included the president and past president of the Cleveland Real Estate Board, the economic advisor for the Cleveland Plain Dealer, the president of the Ohio Savings and Loan League, the secretary of the Cuyahoga County Savings and Loan League, the city zoning engineer, the city planning commissioner, and six other leaders of firms involved in real estate.Footnote 9
Once the HOLC developed standardized reporting early in 1937, the report for each city provided an explanation of the maps.Footnote 10 The opening line typically said: “The purpose of the Residential Security Map is to reflect graphically the trend of desirability in neighborhoods from a residential view-point.” After describing the meaning of the grades and colors, the explanation states:
This map and the area descriptions have been carefully checked with competent local real estate brokers and mortgage lenders, and we believe they represent a fair and composite opinion of the best qualified local people (emphasis added). In using them, we do not mean to imply that good mortgages do not exist or cannot be made in the Third and Fourth grade areas, but we think they should be made and serviced on a different basis than in the First and Second grade areas.
In addition, each of the standardized forms for the areas contained questions related to the “Availability of Mortgage Funds for a) Home Purchase and b) Home Building.”
To visualize the geography of the risk grades, HOLC officials developed “residential security maps” that assigned colors to grades: green (A); blue (B); yellow (C); and red (D). The green (A) rating signified the lowest lending risk and the red (D) rating signified the highest risk. Neighborhoods were rated based on several criteria, including the age and condition of housing, access to amenities such as transportation and parks, the neighborhood’s racial and ethnic composition, and the economic status of residents.
The printed forms for filling out area descriptions described the A areas as “‘hot spots’; they are not yet fully built up. In nearly all instances they are the new well-planned sections of the city, and almost synonymous with the areas where good mortgage lenders with available funds are willing to make their maximum loans to be amortized over a 10 to 15 year period, perhaps up to 75–80 percent of the appraisal.”Footnote 11 The B areas were “completely developed, like a 1935 automobile – still good, but not what the people are buying today who can afford a new one…good mortgage lenders will have a tendency to hold loan commitments 10 to 15 percent under the limit.” The C areas were characterized by “age, obsolescence, and change of style; expiring restrictions or lack of them; infiltration of a lower grade population; the presence of influences which increase sales resistance, such as inadequate transportation, insufficient utilities, perhaps heavy tax burdens; poor maintenance of homes, etc.” Lenders were more conservative in these zones and held commitments with lower lending ratios than those that were typical in either A or B zones. Lastly, D areas “represent those neighborhoods in which the things that are now taking place in the C neighborhoods, have already happened…The areas are broader than the so-called slum districts.” Loans were made on the most conservative terms, and some lenders refused to make any loans in D zones.Footnote 12
DATA
To better understand the HOLC’s risk assessment maps, we construct a novel spatial dataset linking data from the 1930 and 1940 censuses to HOLC residential security zones for a sample of major northern cities that have been the focus of concerns related to redlining. In earlier work, we digitized the underlying census enumeration districts for this sample of major cities in the North (Shertzer, Walsh, and Logan Reference Shertzer, Walsh and Logan2016).Footnote 13 Our sample for this paper covers Baltimore, Boston, Brooklyn, Chicago, Cleveland, Detroit, Manhattan, Philadelphia, Pittsburgh, and St. Louis. These cities and two New York boroughs are from the nine largest northern cities in 1930, covering nearly 18 million people (about half of the total in the largest 100 cities) and about 38 percent of the urban black population living outside of the states of the former Confederacy.
The demographic data used for this paper has three components. The first is census data aggregated to the enumeration district level. Enumeration districts were small administrative units used by the census and typically covered one to four city blocks in urban areas. We use them as our proxy for neighborhoods. The second component is at the level of the HOLC security zones. To study these areas, we use data both from the HOLC surveys themselves and from census data on individual households that we aggregate to these zones, both of which will be discussed in more detail. The third component is a dataset containing census data for individual addresses that were matched across the 1930 and 1940 censuses.
We digitized both the residential security maps and the detailed survey that accompanied the maps for each of our cities, yielding observations for a total of 927 HOLC security zones.Footnote 14 The dates of creation for the maps themselves range from 1937 to 1940.Footnote 15 The associated surveys documented housing characteristics, including housing prices, construction type (brick, frame, or other), and the general state of repair (excellent, good, fair, or poor), as well as population characteristics, including rough estimates of the typical occupation, average income, and racial composition of neighborhood residents. The surveys include retrospective data reaching as far back as 1929 for the highest and lowest housing values for up to three types of housing and the highest and lowest rents for up to three types of rental properties. These surveys also report the perceived future desirability trend for each zone.
Descriptive characteristics from HOLC surveys are presented by security grade in the first four columns of Panel A in Table 1.Footnote 16 The mid-points between the highest and lowest house values and rents are for the year closest to 1935 in each survey. Recall that neighborhoods with an “A” rating signified the lowest level of perceived lending risk, while a “D” rating signified the highest. These summary statistics based on HOLC survey data show that income, housing values, and rents were all negatively correlated with perceived lending risk, while the shares of black and foreign-born residents were associated with higher risk, with black households located almost exclusively in the highest-risk “D” neighborhoods. Only ten zone C (yellow) neighborhoods out of 286 were reported to have a black population share above 4.3 percent (the mean across all HOLC zones). The correlations we document here are consistent with earlier analyses of race and security grade determination (for instance, Greer (Reference Greer2012)).
1930 CENSUS AND HOLC SURVEY DATA SUMMARY STATISTICS BY ZONE

Notes: Standard deviations are reported in parentheses below the means. We limit our sample to only enumeration districts that are at least 90 percent contained in a given zone. Black zones represent zones with an above-average share of black residents, and white zones represent zones with fewer than the average share of black residents of 4.3 percent.
Sources: Data in this table come from both aggregated census enumeration districts as well as HOLC survey data. Dataset described in text.
To augment the neighborhood-level information reported in the HOLC surveys, we attach HOLC security zone identifiers to individual census observations by overlaying the HOLC maps on census enumeration district (1930) and census tract (1940) maps for our nine-city sample. We proceed by calculating the share of each enumeration district or tract lying within each security grade and then attaching individuals from the census to each security grade using areal interpolation. Summary statistics from the 1930 census data aggregated to security grade are presented in Columns (1)–(4) of Panel B in Table 1.
The census data confirm that, as of 1930, the majority of black households lived on city blocks that were destined to be shaded in red. Over 97 percent of black individuals and 95 percent of black-owned homes ended up in red-shaded HOLC zones. While black households were highly concentrated in red-shaded neighborhoods, it was still the case that the majority of individuals in red-shaded areas were white. Fully 49 percent of the 9 million white individuals and 39 percent of the 700,000 white homeowners in our 1930 sample lived in neighborhoods shaded red on the maps. Because of their much larger numbers, these white households accounted for 82 percent of individuals and 92 percent of homeowners in the D red-shaded areas.Footnote 17
The additional census neighborhood variables summarized in Panel B are consistent with the survey data reported in Panel A. Median housing values, median rents, occupational income scores, and the share of owner-occupied housing are negatively correlated with low security grades, while the share of black and foreign-born residents is positively associated. To further understand the role of race in shaping the HOLC’s maps, Columns (5)–(8) of Table 1 separately show summary statistics for the two highest-risk security zones (C and D), splitting into groups of neighborhoods that had above or below the average percent black at the zone level of 4.3 percent. The summary statistics show that red-shaded zones with a high black share appear to be more economically disadvantaged than red-shaded zones with a low black share, a result that holds in both the HOLC surveys and the census data.
To look more closely at the factors influencing the assignment of households around the boundaries between zones, we used a dataset of geocoded addresses that were matched between the 1930 and 1940 census waves based on their addresses by Akbar et al. (Reference Akbar, Li, Shertzer and Walsh2019). Because each observation in the panel was geocoded, each address is assigned to its associated HOLC security grade and the closest HOLC zone boundary, and the distance to the boundary is computed.Footnote 18 The summary statistics by security grade for the address sample, which are reported in Online Appendix Table A2, show overall patterns similar to the summary statistics reported in Table 1. The security grade classifications are associated with both economically and statistically significant differences in observable characteristics, with poorer neighborhoods rated as having a worse lending risk.Footnote 19
ANALYSIS
Our empirical analysis seeks to understand why so many black households were in the red districts under the HOLC maps. We focus on two competing, but not mutually exclusive, hypotheses. First, HOLC assessors may have assigned lower-risk neighborhoods with large numbers of black households to the highest risk grade because they were racially biased, either explicitly due to animus or implicitly because of racially driven beliefs about the quality and prospects of black neighborhoods. Alternatively, the economic hardships imposed on black families by decades of discrimination in education, protection of property rights, and employment combined with racial barriers in housing markets could have left them with few options outside of neighborhoods that met the criteria for the highest risk rating, independent of racial composition.Footnote 20
What Factors Determined Security Grade and Neighborhood Assessment?
We begin with a discussion of how the neighborhood surveys undertaken by the HOLC compare to the security zone-level variables we constructed using census data from 1930 and 1940. We then consider the salience of the boundaries chosen by the HOLC for these zones. While we believe it is unlikely that the production of the HOLC maps between 1937 and 1940 could have had any meaningful impact on neighborhood demographics reported in the 1940 census, we highlight the 1930 census data to be as conservative as possible regarding issues of reverse causality.Footnote 21
To get a better sense of the relationship between data reported in the potentially subjective HOLC surveys and neighborhood conditions from the 1930 census, Online Appendix Figures A3 through A6 compare the cross-neighborhood empirical distributions for median housing values, median rents, share black and share homeowners from the census with those reported on the HOLC surveys for each of the four security zone grades. For the HOLC survey data, we proxy for median values and rents using the midpoint between the reported highest and lowest housing values.Footnote 22 Housing value and rent distributions track reasonably well across the two data sources, with the survey-based distributions’ leftward shift to be expected given the secular decline in housing prices that occurred between the 1930 census and the HOLC survey years later in the decade (Fishback, Rose, and Snowden Reference Fishback, Rose and Snowden2013; Fishback and Kollmann Reference Fishback and Kollmann2014). The distribution of share black also tracks well across the two measures despite there being relatively less within-security grade variation in both the census and HOLC data. The distributions of homeownership vary quite substantially, likely because homeownership rates dropped after 1930 and the HOLC consultants focused on single-family homes when filling out the survey (Fishback, Rose, and Snowden Reference Fishback, Rose and Snowden2013).
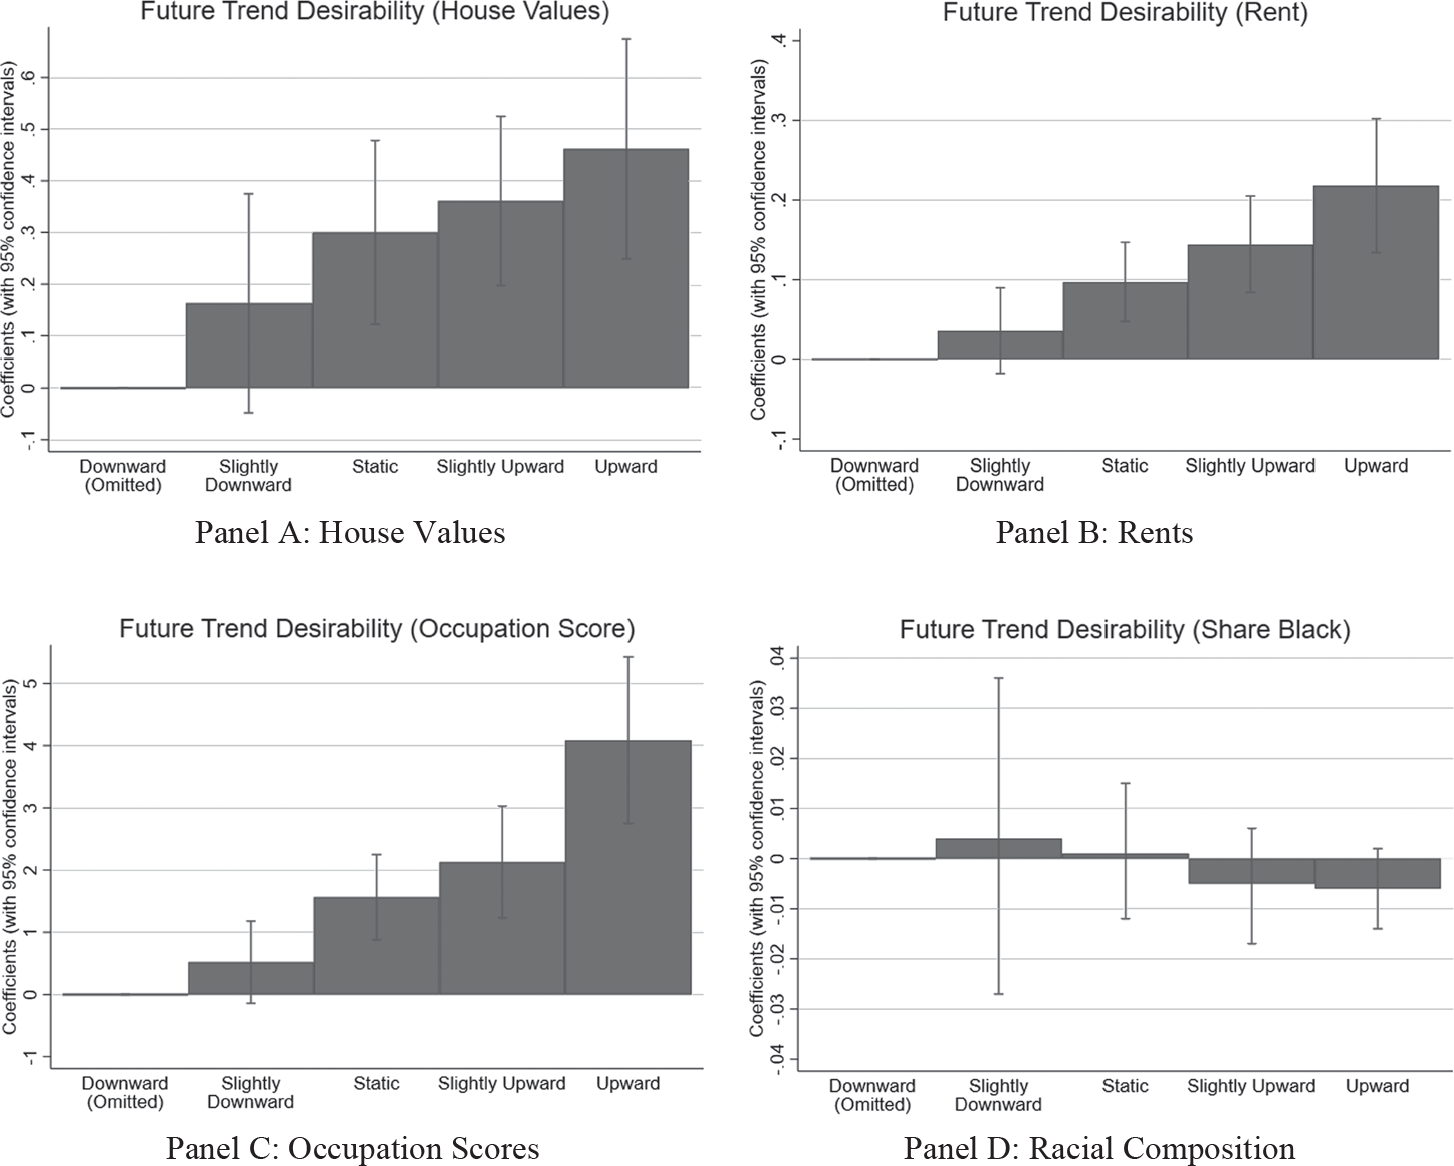
In addition to static measures, the HOLC’s zone assignment decision was also a function of the reported neighborhood desirability trend over the next 10 to 15 years (upward, slightly upward, static, slightly downward, downward). For example, 94 percent of neighborhoods assessed as having downward trends were classified into security zones C and D, while 86 percent of neighborhoods identified as having upward trends were classified into zones A and B, with none of the latter being classified into zone D. To investigate the relationship between HOLC’s trend classification and actual neighborhood change across the 1930s, we use the 1930 and 1940 census data interpolated to HOLC zones to estimate the following linear regression:
 $${y_{ic1940}} = \alpha + \sum {_j{\beta _j}{I_{tren{d_i} = j}} + {y_{ic1930}} + {\gamma _c} + {\varepsilon _{ic}},}$$
where y ic1940 is a census outcome for zone i in city c in 1940 and y ic1930 is the lagged value of the census outcome variable,
 $${I_{tren{d_i} = j}}$$
is an indicator that the HOLC survey placed neighborhood i in trend category j, and γ c are city fixed effects which control for any unobservable characteristics that are constant across all security zones in a given city. The coefficients of interest are the
 $$\beta _j^'$$
which identify the relationship between the different predicted trends and the ten-year change in the dependent variable.
Figure 1 summarizes the results of these regressions for log median housing price, log median rent, share black, and occupational income scores (a commonly used proxy for income based on an individual’s occupation).Footnote 23 These results suggest that the predicted trends captured statistically significant and economically meaningful differences in neighborhood trajectories. Each increase in the optimism of HOLC predictions is associated with a rise in the growth rates of housing values, rents, and occupation codes. The gap between HOLC predictions for upward trending and downward trending zones was associated with a growth rate that was 46 percent higher for housing prices and 22 percent higher for rents, as well as a rise in the occupational score that was the equivalent of an additional $400 (in 1950 dollars). If increases in share black were associated with the HOLC predictions of the trend in future desirability, we would have expected the values in Panel D of Figure 1 to be below zero and to become more negative as the predictions moved upward. Instead, the coefficients for “slightly downward” and “static” were positive, and none of the coefficients were statistically different from zero.Footnote 24
COEFFICIENTS AND CONFIDENCE INTERVALS FROM ZONE-LEVEL REGRESSIONS OF THE CHANGE BETWEEN 1930 AND 1940 IN CENSUS OUTCOMES AS A FUNCTION OF HOLC REPORTS OF FUTURE TREND DESIRABILITY
Notes: This figure shows the coefficient and 95 percent confidence interval for the indicator variables related to the future trend desirability of a neighborhood, with downward being the omitted category. Each regression controls for the 1930 value of the outcome variable. Regression results are also reported in Online Appendix Table A3.
Source: Dataset described in text.
Did the Security Zone Boundaries Identify Transitions between Neighborhoods?
We next explore the placement of the HOLC security zone boundaries. For parsimony, we focus our boundary analysis on neighborhoods that were assigned to security grades C and D since these zones capture nearly all the variation in racial composition across security grades. We begin by using our matched sample of geocoded single-family homes to explore variations in house and household characteristics across these boundaries. Figure 2 plots means and 95-percent confidence intervals from 50-meter bins of log house prices, log rents, occupation score, and percent black as a function of distance from each side of the C-D boundary using the address-level data for 1930.Footnote 25 The bin means clearly show substantially higher home values, rents, and occupational scores and substantially lower shares of African Americans on the C-side of the boundary than on the D-side. Seven to 10 years before the HOLC surveys and maps were developed, stark differences in these features were already in place. The situation using 1940 Census data is similar and is reported in Online Appendix Figure A8.Footnote 26 We provide a trend analog to Figure 2 in Figure 3, where we report 1930–1940 changes. While there appear to be some differential trends between the C and D zones, particularly for the race of the occupant, the raw data plotted here do not reveal any stark jumps in trends at the C-D boundary.
1930 LEVELS BY DISTANCE IN 50-METER BINS TO HOLC BOUNDARY FROM 1930 CENSUS ADDRESS DATA
Notes: This figure shows averages of 1930 census data for single-family households from 50-meter bins by distance to a C-D HOLC boundary. The red dotted line represents the HOLC boundary, positive distances represent households in the red zones, and negative distances represent houses in the yellow zones. All distances are measured in meters.
Source: Dataset described in text.

CHANGES BETWEEN 1930 AND 1940 BY DISTANCE TO HOLC BOUNDARY FROM CENSUS ADDRESS DATA
Notes: This figure shows averages of 1940 census data, controlling for 1930 values, for singlefamily households from 50-meter bins by distance to a C-D HOLC boundary. The red dotted line represents the HOLC boundary, positive distances represent households in the red zones, and negative distances represent houses in the yellow zones. All distances are measured in meters.
Source: Dataset described in text.

To provide a more statistically grounded assessment of boundary discontinuities, Table 2 presents results from a standard regression discontinuity (R-D) model of the following form:
 $${y_{ij}} = \alpha + \beta \{lgs_{ij}} + \rho dis{t_{ij}} + \varphi dis{t_{ij}}*\{lgs_{ij}} + {\gamma _j} + {\varepsilon _{ij}},$$
where y ij is the outcome for address i near boundary j, and dist ij is the distance of address i to boundary j, lgs ij equals 1 if address i is on the lower-grade (D) side of boundary j, γ j are boundary fixed effects, and is the error term. The coefficient of interest in Equation (2) is β, which measures the extent to which addresses on the lower-grade side of a boundary are discretely different from addresses on the higher-grade side. The results use the optimal bandwidth selection proposed by Calonico, Cattaneo, and Titiunik (Reference Calonico, Cattaneo and Titiunik2014a, 2014b). The results are presented for both 1930 and 1940 data, as well as a trends model that replicates the 1940 iteration of Equation (2) but includes as a control the 1930 value of the dependent variable (thus replicating the approach taken in Equation (1)). We document the robustness of all results in this table across a wide range of bandwidth choices in Online Appendix Figures A9–A11.
LEVELS AND TRENDS AT C-D BOUNDARY FROM REGRESSION DISCONTINUITY REGRESSIONS USING 1930 AND 1940 CENSUS ADDRESSES

Notes: Standard errors are in parentheses below the coefficient. Each coefficient is estimated from a separate regression. *p < .10, **p < .05, ***p < .01.
Source: We used the optimal bandwidth selection procedure proposed by Calonico, Cattaneo, and Titiunik (2014a, 2014b) on the dataset described in text.
The R-D results reported in Table 2 reinforce the visual evidence from Figure 2 and suggest trend discontinuities that are not immediately apparent in Figure 3. In particular, the boundaries drawn by the HOLC captured statistically significant and economically meaningful discrete changes in important neighborhood characteristics. We focus on the estimates from Specifications (2) and (4), which control for boundary fixed effects. The results for Specifications (1) and (3) without the fixed effects are similar. Crossing to the lower-graded side was associated with a 9 or 10 percent fall in housing prices and a 1.1 to 1.3 point drop in occupational income scores, which implies a drop of roughly $100 in average income in 1950 dollars. Crossing the boundary into the D zone meant that rents fell 1.6 to 3.7 percent, but only the result for 1940 values is statistically significant. The results for the trends from 1930 to 1940 are qualitatively similar but with smaller magnitudes and a statistically insignificant negative effect for rents.
There is also clear evidence of discontinuities in racial composition at the border, with a 4.9 percentage point jump in percent black in 1930 and a 3.5 percentage point jump in 1940 on the lower-graded side. Similarly, the trends analysis finds a discrete 1.6 percentage point jump in the rate of increase in percent black. As a point of comparison with the economic variables, the racial discontinuity in 1930 (1940) is 14.1 percent (11.5 percent) of the standard deviation across all locations in the C and D zones. The corresponding percentage for prices is 14.1 percent (14.6 percent), for rents is 2.85 percent (6.9 percent), and for occupation scores is 13.2 percent (11.5 percent).
Taken together, these results highlight the difficulty of separating the relative roles of race and economic distress in the generation of the HOLC maps. The evidence suggests that the chosen boundaries identified points of abrupt neighborhood transition, both economically and racially. We explore the racial dimensions of HOLC mapping in more detail in the next section, focusing on the relationship between security grades and the overall economic disadvantage facing black families at the time of the maps’ creation.Footnote 27
Were the HOLC Security Grades Driven Primarily by Race?
Our further analysis of the racial dynamics of HOLC map creation proceeds along two dimensions. First, we search for evidence of the importance of race at the neighborhood level by comparing the relative non-racial character of high and low black locations that were differentially classified into security grades C and D. Next, taking the overall neighborhood-level grade assignments as given, we ask: what portion of the concentration of black families in red D neighborhoods can be explained by the racially motivated assignment of these specific boundary locations? If the HOLC local experts had used neighborhood racial composition as a factor in determining risk grades, we would expect to find, on average, that red neighborhoods contained large numbers of black households with higher incomes and more valuable homes than their white counterparts. This pattern would arise because the use of race as a factor in area ratings would implicitly mean that some neighborhoods with more black households would have been assigned to D security grades even though their underlying economic situations were more in line with those of C-security-grade neighborhoods.
For this analysis, we divide our cities into small neighborhoods, each of which will constitute a single observation. We use the 1930 100 percent count census data aggregated to the enumeration district level for this analysis.Footnote 28 We first develop an index of economic distress for each enumeration district based solely on non-racial data. We begin this process by estimating the following linear probability model:
 $${I_{E{D_i} \in D}} = \beta '{X_i} + {\varepsilon _j},$$
where IEDi∈D is an indicator variable with a value of one when an enumeration district is assigned to a D-grade security zone and zero when assigned to a C-grade zone. In this regression, Xi is a vector containing the following non-race enumeration-district characteristics: share foreign born, share homeowners, average age, average occupation score, average rent, average sales price, and labor force participation rate. We then use the estimated coefficients from this linear probability model to predict the probability that each enumeration district in the sample would be classified as a D security grade, essentially yielding an index of perceived economic distress that does not explicitly include race as a factor.Footnote 29
The goal is to compare the distribution of this enumeration district-level index (predicted probability of being ranked D) across areas with large and small black populations. To that end, after computing the estimated probabilities, we divided the sample of enumeration districts (EDs) into two groups: EDs with a greater than 15 percent black population share and EDs with black population shares of 15 percent or less (15 percent is the average black share in D zones, but results are robust to a wide range of racial cutoffs).Footnote 30
In Panel A of Figure 4, the sample contains EDs that were assigned a D rating by the HOLC. The continuous line shows the distribution of our predicted index for EDs with black shares of more than 15 percent, while the broken line shows the distribution of the index for EDs with black shares of 15 percent or less. The unbroken line for a higher black share is concentrated to the right of the broken line for the lower black share, which shows that the homeowners in EDs with higher black population shares typically had worse economic characteristics, the opposite of what we would expect to see if black neighborhoods had been disproportionately targeted for the D rating. The comparison of groups with high and low black shares for EDS with actual C ratings in Panel B of Figure 5 shows similar results. The same pattern holds using 1940 census tract data as opposed to 1930 ED data (see Figure A16 in the Online Appendix).
DISTRIBUTIONS OF PREDICTED PROBABILITY THE ENUMERATION DISTRICT (ED) IS RATED D BASED ON OTHER CHARACTERISTICS WHEN PERCENT BLACK IS ABOVE OR BELOW 15 PERCENT
Notes: This figure shows the distribution of enumeration districts’ predicted probability of being in red zones.
Sources: Predicted probabilities were calculated using 1930 ED census data from regression Equation (3) in which a dummy with value 1 for Zone D is regressed on the share foreign born, share homeowners, average age, average occupation score, average rent, average sales price, and labor force participation rate. Data are for EDs with the share black greater than 15 percent and less than or equal to 15 percent. Dataset described in text.

SHARE OF BLACK FAMILIES IN 20-METER BINS BY DISTANCE TO C-D BOUNDARIES
Notes: This figure shows the relationship between race and distance to a C-D boundary. It shows the share of black residents based on distance to a HOLC boundary, with negative distances representing locations on the C side of the boundary and positive distances representing areas on the D side of the boundary.
Source: Dataset described in text.

These results once again show that black households were already concentrated in the most economically challenged neighborhoods in these cities seven to ten years prior to the development of the HOLC maps. Thus, the assignment of a D rating and red shading for high risk to those neighborhoods where the share of black families was higher would almost certainly have happened even if the HOLC decision-makers had not known the race of the families in the neighborhood.
This finding is reinforced in Figure 5, which plots the share of black-occupied single-family homes in groups at various distances from the CD boundary. As the plot moves from the vertical line at 0 to the right, the distance from the C-D boundary into the D-zone rises. As the location moves further into the district, the share of black families increases, with the share of black families being highest on the far right of the graph in the physical heart of the largest contiguous D-rated areas. It is precisely the high concentration of black families in the core of these economically distressed neighborhoods that underpins the finding in Figure 4 that, on average, D neighborhoods with high black shares had lower incomes and housing values than D neighborhoods with low black shares.
Were the Security Zone Boundaries Drawn to Capture Black Neighborhoods?
We now turn to an evaluation of the choice of specific boundary locations. Given the results of our analysis of the security grade assignment, it is likely that the homes of most black families were assigned D-ratings largely because they were embedded in the center of neighborhoods with the lowest socio-economic characteristics. Such a finding, however, does not preclude the possibility that the HOLC shifted its zone boundaries in one direction or another so that more black households would be put into D-rated neighborhoods. In fact, a close examination of Figure 5 potentially provides evidence of such behavior, with some apparent bunching of black households just inside (within 100 meters) of the D side of the border.
The coefficients in the R-D boundary analysis presented in Table 2 identify discrete changes in home value, rents, income, and race at the specific boundaries chosen by the HOLC to demarcate between C and D zones. We begin here by assessing how the coefficients in Table 2 using the actual boundaries selected by the HOLC compare with coefficients from R-D analysis when the location of the C-D boundaries are randomly assigned. Specifically, we produce a set of hypothetical boundaries, uniformly distributed at 5-meter intervals within a 250-meter buffer of the true boundaries. This procedure yields a set of 101 distinct possible boundaries between each adjacent C and D zone. We then randomly choose one boundary from this set for each zone pair and re-estimate the models from Columns (2) and (4) of Table 2 on this set of hypothetical boundaries. Replicating this process 1,000 times provides an empirical estimate of the distribution of coefficients for the economic and demographic discontinuities that arise when the C-D boundary location is randomly assigned. These distributions (along with the estimated discontinuity at the actual boundaries) are presented in Online Appendix Figure A17 for both 1930 and 1940. We also use this distribution to compute a one-tailed empirical p-value (in parentheses below each panel) that measures the probability that random assignment would have led to the boundary that the HOLC actually chose and therefore produced the coefficient from Table 2.
The empirical distributions for all four measures (value, rent, income, and race) are approximately normal and roughly centered at zero. Further, the estimated p-values for the actual boundaries suggest that the actual HOLC boundary locations were not randomly assigned because the p-values for the dimensions of housing value (p-value .016 for both years), income (p-value .005 and .011), and race (p-value .018 and .061) are low. HOLC agents specifically chose to place boundaries at locations where discrete changes occurred along economic and racial dimensions. Focusing on race, the evidence presented in Figure 5 and Online Appendix Figure A17 suggests that race itself played a role in determining the specific locations of some security-grade boundaries. Visual inspection of Figure 5 suggests that this process led to a bump upward by roughly 5 percentage points in the probability that a black household was located between 40 and 100 meters inside the D zone side of the C-D boundary.
Motivated by this clumping of black households within 100 meters of the boundary, we conclude our analysis by attempting to gauge the importance of race-based boundary selection through the construction of two counterfactuals. First, we consider the outcome if all C-D boundaries had been shifted 100 meters into the D-zone side of the boundary. This exercise ignores all other information about occupations and housing values in these locations and shifts the bump in black households from the D zone to the C zone. In doing so, we shift 2,474 black households (19.8 percent of all D-zoned black households) and 868 black-owned homes (20.9 percent of all D-zoned, black-owned homes) from a grade of D to a grade of C. Conversely, given that the share black within 100 meters of the D side of the border was much smaller than it was further inside the D zone, moving all boundaries inward 100 meters would move an even larger number (and share) of white households out of the D zone. Specifically, this change in boundary location would shift 22,980 white households (37 percent of all D-zoned white households) and 14,007 white-owned homes (36 percent of all D-zoned, white-owned homes) from a grade of D to a grade of C.
Of course, a race-neutral zone assignment would not have implied that all boundaries would shift in by 100 meters. Instead, it would likely imply that only the specific boundaries that gave rise to the bump in percent black within the first 100 meters of the D zone would be shifted. Thus, the 20.9 percent reduction in black household assignment to D zones that would have resulted if all black individuals living along the D-side of the boundary were moved to C zones likely overestimates the impact of race-based boundary selection on the exposure of black households to the D areas.
This observation motivates our second counterfactual, which we believe to be a more realistic exercise. Here, we compute the impact of the observed clustering under the assumption that, without racial bias in the choice of boundary location, we would have seen a smooth rise in the share of black residents beginning about 140 meters on the C-rated side of the C-D border and continuing about 360 meters on the D-rated side before accelerating. We thus consider the impact of relocating only the “bump” itself. We move the excess black households represented by the bump from an assignment of D to an assignment of C. This counterfactual exercise does not move any white households from the D zone to the C zone.
We start the process by fitting a nonlinear trend line to the data. We then remove the positive deviation from the trend that occurred within this band.Footnote 31 Under this exercise, 392 black households (2.8 percent of all D-zoned black households) and 93 black-owned homes (2 percent of all D-zoned black-owned homes) are moved from a D security grade to a C security grade. Thus, this more nuanced counterfactual suggests a much smaller role for racially motivated distortions in the boundary location in explaining the overall location of black households in D areas. It is also possible that the failure of HOLC map-makers to draw tight borders around black-populated city blocks simply reflected the prevalent and self-reinforcing belief among real estate professionals and the public that proximity to black neighbors increased the probability of racial transition and future erosion of housing values.Footnote 32 Thus, instead of a “bump,” there would be a “buffer.” To the extent that these concerns animated boundary locations, they served to increase the size of the white population that was included in D-zoned neighborhoods.
The notion that race played a role in the choice of specific boundary locations is consistent with the importance placed on race by real estate professionals and scholars of the day, many of whom played a central role in the development of the HOLC maps. However, our analysis suggests that this focus on race was likely responsible for the location of only a modest number of black households in red districts. The black households that were located in red areas because of these boundary adjustments represent only a fraction of the overall number of black families who found themselves in D areas. The majority, more than 80 percent and quite possibly more than 95 percent, were put in the red areas in the process of HOLC map making because they had few choices outside of northern cities’ most economically disadvantaged neighborhoods. Put differently, our results suggest that the majority of black households were in red districts due to a combination of discrimination-driven economic disadvantage, direct discrimination in housing markets, and discrimination in the provision of city services, all of which predated the creation of HOLC and the HOLC maps. These forces left black families and individuals with little choice but to live in neighborhoods that were destined to be in red D areas due to market conditions and their overall level of economic distress.
THE ROLE OF THE HOLC MAPS IN DETERMINING FEDERAL REDLINING POLICY
In recent years, substantial literature has claimed that “the HOLC’s assessment of urban neighborhoods in the 1930s was racially and ethnically discriminatory. It used the power of the federal government to formalize patterns of segregation and discrimination” (Winling and Michney Reference Winling and Michney2021, p. 42). Further, the redlining in the maps had a persistent impact on prices, demographics, and other characteristics of neighborhoods (Faber Reference Faber2020; Aaronson, Hartley, and Mazumder Reference Aaronson, Hartley and Mazumder2021; Anders Reference Anders2023; Krimmel Reference Krimmel2018; Appel and Nickerson Reference Appel and Nickerson2016).
We have already shown that the HOLC offered substantial aid to black households by charging the same interest rate to all races and providing a larger share of its mortgages to black households than other lenders did.Footnote 33 In this section, we compare the strategies followed by the FHA and HOLC with respect to timing, sources, racial mapping, and sharing of information with the public. Race played a more prominent role in the FHA’s identification of neighborhoods. The FHA actively shared information about their maps and lending practices with the public and lenders, while the HOLC started later and kept their maps confidential inside the government housing agencies. The HOLC maps had virtually no influence on the HOLC’s main program of purchases and refinancing of mortgages, and thus their influence on federal lending policies would have had to come through decisions made by the FHA. But the FHA developed its own research using more precise block-level data from property inventories in hundreds of cities. Once the HOLC maps were made available to the FHA, the FHA likely used them as a check on the FHA’s own research rather than as the basis for their decisions.Footnote 34
In their detailed analysis of HOLC records, Michney and Winling (Reference Michney and Winling2019) and Michney (Reference Michney2022) document that the HOLC started its mapping program in September 1935, after it had finished 90 percent of its original purchase and refinance program, and the information was not disseminated outside senior leadership until nearly all of the refinancing was finished. Thus, the direct impact of the maps on federal policy was restricted to how the HOLC disposed of roughly 200,000 homes on which they foreclosed. During the years when the HOLC maps were being created between 1935 and 1941, the FHA was the primary federal housing agency making decisions about mortgages that would have influenced housing segregation. We thus need to answer the question: How much did the FHA rely on HOLC maps?
As they began insuring home mortgages between July 1934 and June 1935, the FHA officials developed their own neighborhood studies and maps. Before the HOLC even started its first city survey in September 1935, the FHA already had access to block-level information, including race and seven other variables, from property inventories collected by New Deal relief agencies and cities in between 115 and 154 cities. In the fall of 1934, the FHA Division of Economics and Statistics instigated efforts by several agencies to develop a standard and comprehensive procedure for collecting the data for future property inventories and how to organize the mapping and analysis of the data.Footnote 35 On 1 January 1935 the FHA (1935a) published a 194-page report with numerous maps for Peoria, Illinois, that showed how they were using block-level data to study neighborhoods. By July 1935, the new property inventory instructions had been developed and called for the creation of several block-level maps for each city. The instructions then called for the creation of a map of economic areas based on “rent and race.” Each block with 10 percent or more non-white households was delineated on the map, and groups of four or more contiguous blocks with 10 percent or more non-whites were grouped into a non-white economic area. The remaining blocks were grouped by average rent into areas with 10 or more blocks. The non-white economic areas could be split based on rent as well.Footnote 36 Homer Hoyt (Reference Hoyt1936, 1937a, 1937b, 1937c, and 1939), the Principal Housing Economist of the FHA, then publicized these methods in the FHA’s Insured Mortgage Portfolio monthly in 1936 and 1937 and in a more technical publication in 1939. In the absence of property inventories, he argued that average rent was the best proxy (pp. 49–57) and emphasized the dynamism of cities and the importance of measuring changes. In 1938, a committee chaired by Ernest Fisher of the FHA began work on plans for property inventories in the 1940 census (Brunsman Reference Brunsman1947). In 1942, the number of cities with block-level property inventories rose to around 340 when the Census Bureau published block-level statistics, including race, for each of the nearly 200 cities with more than 50,000 people. Decennial census updates continued through at least 1970. If someone sought to discriminate against black households, the FHA’s use of block-level inventories provided much more precise information on their locations than the red designations on the HOLC maps, where the percent white in our large city sample was over 80 percent. To determine the areas with black populations, it required access to the area descriptions, of which there were only a few copies.
The FHA publicized their methods before the HOLC even started the city surveys. The FHA (1935b, 1935c) issued press releases in late July 1935 describing how they were using block data from property inventories and widely distributed copies of their underwriting manuals with their discussions of the risks associated with mixing races and classes in neighborhoods. By May 1937, FHA officials had given over 50 presentations to real estate professionals and had published a continuing stream of articles on their appraisal and evaluation methods. Research to date suggests that the first HOLC’s publication about HOLC security areas came out in August 1936 and provided a description of the long list of variables used (Hillier Reference Hillier2003a; Winling and Michney Reference Winling and Michney2021). The FHA shared much more. In June 1937, FHA official James Taylor (Reference Taylor1937) described and provided illustrations of the block maps the FHA had created with the property inventories for 77 cities. He stated further that similar information was available for another 173 cities, and practitioners were welcome to consult it at local FHA offices (see, also, FHA (1939, p. 42)). In 1942, the Census Bureau made its 1940 block-level information for nearly 200 cities available to anybody willing to pay 15 cents.
In contrast, the HOLC actively sought to keep the details of the area descriptions and precise boundaries on the maps confidential within the government. The finding aid at the National Archives (undated) states that “none of these maps have ever been given to private interests” and describes the disposition of each copy of the maps. Michney (Reference Michney2022) and Winling and Michney (Reference Winling and Michney2021) provide extensive evidence that show the efforts to maintain confidentiality about the specifics of the maps. There were likely leaks of maps for a few cities because HOLC officials gave talks in which they showed a map as an illustration.Footnote 37 So far, no one has presented evidence that the details of the area descriptions, which contained the precise locations of racial and ethnic groups, were shared with private interests.
As might be expected, given the documented underlying segregation, the identification of areas by the HOLC and FHA were correlated. Yet, the differences in the information and practices used by the FHA and the HOLC led to differences in the maps in cities where we have both. Xu (Reference Xu2022) and Online Appendices III and V document the similarities and differences between Chicago and Greensboro, NC. In Baltimore, Greensboro, and Peoria, Fishback et al. (2022b) found that the neighborhood patterns of FHA insurance were essentially the same before and after the HOLC maps were developed. The time frame for the HOLC maps’ influence was likely limited to the late 1930s and varied depending on the timing of property inventories and the HOLC’s surveys. Once the block statistics from the 1940 Housing Census were published by city in 1942, the influence of the HOLC maps on FHA policy was weakened even more.
In sum, the FHA’s decisions on insuring mortgages were only partially influenced by the HOLC map boundaries. The HOLC maps clearly state that they were documenting the opinions of location real estate professionals, and the area ratings shown in the maps were the outcome of segregation patterns that had developed over decades and were driven by a wide range of factors that include policies at all levels of government, the actions of real estate professionals, and the actions and attitudes of home buyers and sellers. However, even if the maps do not isolate federal government policy in the late 1930s and afterward, the findings that the HOLC map boundaries had a persistent influence on segregation patterns for the next several decades are valuable because they document the long-term persistence of the factors that shaped local lending risk in the late 1930s.
CONCLUSION
The HOLC maps, in conjunction with contemporaneous maps produced by the Federal Housing Agency (FHA), are at the center of debates regarding the long-run impacts of federal-government-imposed redlining. These maps are particularly salient because black households were almost entirely concentrated in the highest-risk zones on them. This concentration, combined with the fact that neighborhoods given a poor rating in the 1930s largely remain economically distressed today, has led many scholars to conclude that racial bias in the construction of the maps has had important effects over the long run.
A number of scholars and popular writers have recently claimed that the HOLC maps are a visual shorthand for federal-government-sponsored housing market discrimination in American cities. We show here that the maps were made available too late for them to be used in the HOLC’s original program of purchasing and refinancing one million mortgages, and HOLC leaders actively sought to keep their maps out of the hands of private interests. The only HOLC policy that the maps might have influenced was how they disposed of the 200,000 homes on which they ultimately foreclosed. In the final analysis of HOLC policy actions, the HOLC was likely the least discriminatory among categories of lenders in the mortgage markets. The Housing Census of 1940 shows that the loan terms and interest rates paid by black and white borrowers were the same in contrast to the rest of the market, and the black share of HOLC mortgage loans was substantially larger than for any other category of lender. Given the long history of discrimination against African Americans by governments at all levels before the 1930s, the HOLC might have been the least discriminatory government agency of that time.
Many scholars have also claimed that the FHA relied substantially on the HOLC surveys to create their maps, which led the FHA to provide mortgage insurance to only a disproportionately small share of black homeowners.Footnote 38 However, we provide evidence that the FHA created its own maps using much more disaggregated alternate sources of information in many cities before they had access to the HOLC maps and that the map boundaries were only somewhat loosely aligned.
The robust relationship between the 1930 census and information from the HOLC maps shows that characteristics and trends across neighborhoods associated with the security zone grades were largely in place before the federal programs were started. Many of the forces described in our opening paragraph had been leading to increased segregation well before the onset of the HOLC, and these forces persisted for extended periods afterward. Our quantitative analysis of the boundaries suggests that between 4 and 20 percent of the concentration of black families in D zones was driven by race, largely due to the fact that the majority of black families were already living deep within neighborhoods that met the HOLC’s criteria for the highest lending risk.
The combination of quantitative and narrative evidence in our work offers a more nuanced understanding of the mechanisms through which HOLC map boundaries are related to disparate outcomes today. While we caution against using HOLC maps to evaluate FHA policies, the HOLC maps are still a valuable tool. They provide a snapshot of how real estate professionals viewed neighborhood desirability and lending risk in the 1930s. The studies that have used them to study long-run outcomes highlight the decades-long persistence of the racial segregation and neighborhood disparities that existed by the 1930s across U.S. cities.


 Open access

