Demography is destiny.
—usually attributed to Auguste ComteDemography is not destiny.
—(Teitelbaum and Winter Reference Teitelbaum and Winter2004)Demography need not be destiny.
—(Ladner and Lips Reference Ladner and Lips2009)No self-respecting political scientist will accept the cliché that demography is destiny; political structures and rules, individuals' and groups' commitments, contingency and path dependency, and leaders' or parties' strategies intervene between raw numbers and electoral or policy outcomes. Nevertheless, as a locality's demography changes, the politics are likely to alter in response to—or reaction against—new circumstances or the desires of new residents. These changes should entice us to study new conceptual connections, empirical puzzles, causal mechanisms, and policy consequences; much research on urban politics from the past few decades may come to seem anachronistic and dated. If a city's politics do not change as its demography changes, that is an equally fascinating, though more stress-filled, phenomenon. In either case, demographic change opens new and exciting topics for scholars of urban and regional politics, and indeed, for political scientists in all subfields.
Of course, many political scientists are already analyzing the new racial and ethnic dynamics and their implications; I could not write this essay without a fine research base on which to build. Nevertheless, our discipline has not yet taken full account of the sea change in the United States' cities and suburbs. In this essay, I highlight some incontrovertible population dynamics and identify controversies about them that are, or should be, occupying the attention of both activists and scholars.
These disagreements about the political ramifications of demographic change raise a set of questions that are central to future research in American politics. Putting the point schematically, the study of urban politics during and about the nineteenth and early twentieth centuries grew out of questions concerning the role of nationality, immigration status, and assimilation. In contrast, the study of urban politics during and about the last half of the twentieth century grew out of questions about the role of race, inequality, and integration. The study of urban politics over the next few decades needs to meld these two perspectives, looking at how race is shaped by immigration, how immigrants respond to American racial dynamics, how urban institutions create and are created by the novel mix of nativity and race, and how political actors seek, and often fail, to manage these cross-cutting currents. Cities are the central locus for this intersection between race and nativity, but they are not the only locus; regional and national politics will also reflect it. Furthermore, issues that could seem far from questions of race and nativity—land use planning, regional transportation development, public health and housing, economic development—will necessarily be tangled up with the politics around group identity, groups' competition for resources, groups' coalitions to seek power, and ordinary daily life of new and old Americans. The impact of all of this turmoil on democracy and justice in America's communities is an issue to which I turn, very briefly, in the conclusion.
Three Demographic Trends
As all students of American politics know, the demography of the United States is changing rapidly. The census bureau estimates that by 2042, non-Hispanic whites will comprise less than half of the United States' population. The most important cause has been immigration, especially though not only from Latin America. Immigration is perhaps slowing, at least while the effects of the 2008 recession persist. But Latinos have a higher birthrate than do other native-born Americans; natural increase was responsible for twice as much of the growth in the Hispanic population in the 2000s as was immigration.
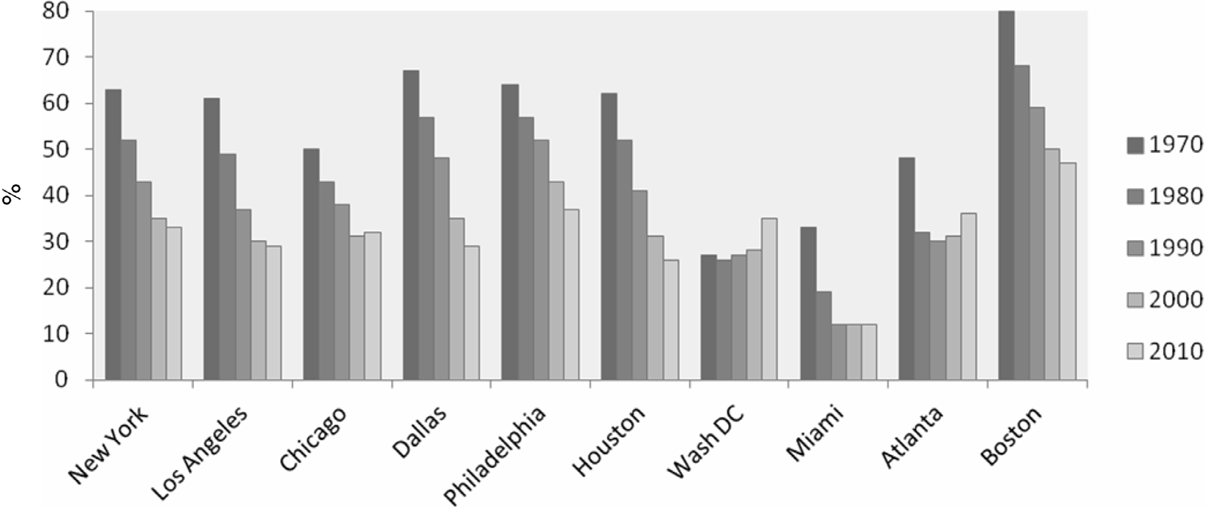
The simple fact that Latinos now comprise a larger share of the American population than African Americans do is the entry point for examining more startling demographic changes with political import. First, the largest metropolitan regions and cities have been losing non-Hispanic whites at a rapid clip for a half century, as figure 1 shows.
Proportion of non-Hispanic whites, in the cities of the 10 largest metropolitan areas, 1970–2010
*15% sample. These cities were at the center of the ten largest metropolitan statistical areas in 1970; in order to show comparable data over time, the figure provides evidence on only the central city of each MSA.
Sources: 1970, 1980, 1990: Bureau of the Census 2005; 2000: Bureau of the Census 2000; 2010: Bureau of the Census 2010.

Figure 1 is not hard to interpret. By 2010, the absolute levels of non-Hispanic whites in the United States' largest cities ranged from just under half to just over a tenth; with one (or perhaps two) intriguing exception(s), discussed below, the trajectory is steeply downward.
In order to analyze the political implications of this change, one must know the race, ethnicity, and nationality of the non-Anglo population in these and other cities. Figure 2 shows that information for 2010 for the same ten cities:
Proportion of blacks, Hispanics, Asians, and foreign-born, in 10 cities of largest metropolitan areas, 2010
Source: 2010: Bureau of the Census 2010.

The symmetry and similarity that characterize figure 1 have disappeared. Figure 2 is therefore clustered in three demographic categories rather than simply from largest to smallest as in figure 1.Footnote 1 The first cluster contains old, strongly African American, cities such as Atlanta, Detroit, Philadelphia, and Baltimore that have seen relatively few effects of immigration during the past four decades. This is the type of city addressed by most of the political science literature on race and urbanicity since the 1960s.Footnote 2 Analysis of politics in these cities starts with a focus on blacks and whites as the two most important—perhaps the only important—groups; as a first approximation, electoral politics will revolve around levels of black-white racial hostility or amity, and of intra-group cohesion or fragmentation. Other groups (as well as factors such as poverty, electoral structure, or business interests) will enter any good analysis, of course. But the rebuttable presumption is that other groups matter less than blacks and whites, or follow in the path laid down by blacks and whites, in shaping a city's political contests and policy outcomes. The concepts of discrimination, linked fate, and cross-cutting cleavages are likely to prove highly useful.
The heavily black and decreasingly white cities remain large and important, so the fact that the canonical literature about them is old does not mean that it is irrelevant or superseded. But this pattern no longer typifies the United States' largest cities. A second cluster has more equal proportions of African Americans and Hispanics, and relatively high levels of foreign-born and Asian Americans. These are the most cosmopolitan, or at least the most complicated, localities—what William Frey calls melting-pot metros and Audrey Singer calls one of several “immigrant gateway types.”Footnote 3 Analysis of politics in these cities, such as Chicago, Dallas, New York, and San Francisco, needs to focus on three, four, or even more groups, depending on whether “Latino” or “Asian American” is a politically meaningful designation or whether groups need to be understood in nationality terms. As a first approximation, electoral politics will revolve around questions of coalition formation or dissolution, pan-ethnicity, immigrant and second-generation political incorporation and mobilization, and issues of ethnic succession or retention. Analyses of tipping points, comparisons of stocks versus flows, political parties' capacities for change and the relative impact of contact versus threat are likely to contribute more in determining how to study these cities than are notions of group solidarity or discrimination.
A third cluster is becoming the most important among major cities. This configuration is dominated by Latinos; many, but a decreasing share, are foreign-born. In these cities, such as Albuquerque, El Paso, Los Angeles, and San Antonio, the largest of which are shown on the right side of figure 2, native-born blacks as well as non-Hispanic whites are a declining (and in some cases small) share of the population. A few of these cities have a relatively large share of Asian Americans, but they too are numerically swamped by Latinos. Analysis of politics in the third cluster is likely to start by focusing on the proportion of Latinos who are eligible to vote and who do so, and on the possibilities for protest or other non-electoral political action among noncitizens. As a first approximation, electoral politics will revolve around Latinos' choices of alliances across nationalities and with non-Latinos, and their shifting partisan allegiances. Analyses of immigrants' legal status, second-generation political incorporation, voter mobilization, political parties' flexibility, descriptive representation, and coalitional incentives are likely to shape research agendas.
In short, simply knowing the proportions and trajectories of different racial and ethnic groups and their citizenship status provides some hint of appropriate starting points for scholars of urban politics over the next few decades. The point is not new, but in my view our research agendas too seldom clarify the links, or reasons for a lack thereof, between a particular political dynamic and a particular demographic configuration. That, of course, is only the starting point: whether a given group is being edged out, left behind, maltreated, included, or favored—and whether a given group is inclusive, discriminatory, fragmented, or short-sighted—are questions that leave plenty of room for controversy even if we were to agree on the initial framing link between demography and politics. How demography and politics link to economic inequality and economic development is yet a further question.
A second incontrovertible fact about race or nativity and cities is the generational divide. The basic point is clear: “the nation's children are much more diverse than its older population.”Footnote 4Figure 3 shows the evidence for the nation as a whole.
Age distribution of United States residents, by race and ethnicity, 2009
Source: Metropolitan Policy Program 2010: 78.

In general, the younger the age group, the smaller the proportion of non-Hispanic whites. However, like racial demography and nationality, the distribution of groups by age differs across cities and metropolitan regions. The proportion of blacks typically varies little across age groups, although African Americans' return migration has increased the proportion of young adult blacks in some southern cities. The big impact, not surprisingly, derives from the proportion of Latinos in the city or metro region. Overall, seventeen metropolitan areas had majority minority populations in 2010, while thirty-one (across fourteen states) had majority minority populations of children.Footnote 5
Figure 4 shows these patterns in three American cities. Despite variations, two features are consistent: non-Hispanic whites comprise a much smaller share, and Latinos comprise a much larger share, of the young than of the old. These cities are not unusual; as Frey points out, “in Riverside [California], for instance, about seven in 10 children are non-white or Hispanic, while almost seven in 10 seniors are white. Phoenix [Arizona] … shows sharp disparities between its 85 percent white senior population and its 44 percent white child population.”Footnote 6
Shares of selected cities' young and old populations comprised by various racial and ethnic groups, 2009
Source: Metropolitan Policy Program 2010: 85.

Age differences in a group's share of its city's population rest on top of a generally increasing dependency ratio, in which the proportion of working-age adults (age 18 to 65) is declining in relation to the proportion of nonworkers. Again to quote Frey, “the phrase ‘demography is destiny’ was never more appropriate than when used to characterize the impending ‘age tsunami’ that is about to hit America's population.”Footnote 7 The dependency ratio has varied over the twentieth century, depending on fertility and mortality rates of young and old; by one calculation it reached a low in 1990.Footnote 8Figure 5 shows the trajectory as of 2000, with projections through 2050.
Number of dependents per 100 persons, aged 18 to 64, in the United States, selected years, 1900–2050
Source: Guyer et al. Reference Guyer2000: 1315.

As one might expect given what we have already seen of site-specific variation among racial and ethnic groups, the dependency ratio varies across regions, metropolitan areas, and cities. Cities in California, Utah, and Texas with large Hispanic or Mormon populations have high child dependency ratios; conversely, cities in Florida, Pennsylvania, and western New York with predominantly white populations and little immigration have high elderly dependency ratios.Footnote 9
Political scientists have paid little attention to dependency ratios, at least in the United States.Footnote 10 But it is not difficult to see how electoral politics, legislative action, advocacy activity, and policy outcomes will all be affected as the proportion of children to adults rises, as the proportion of elderly to the young rises, or both. Politics in cities and metropolitan regions largely revolves around the allocation of funds for and attention to services for residents. Some services are public goods for which the dependency ratio matters relatively little (libraries, fire departments, street cleaning and snow plowing, water supplies). But a large share of urban political and policy activity revolves around goods that are strongly age-inflected, such as schools, hospitals, social welfare services, housing policy or provision, and public transportation. The fact that younger city dwellers are disproportionately non-Anglos and non-citizens while older city dwellers are disproportionately white citizens complicates the already fraught politics and policies of the dependency ratio. Analysis of politics around the racially-inflected dependency ratio needs to focus on coalitional formations, the capacity of some to speak for others, the fiscal implications of various policy choices, budgetary maneuvering, the political standing of immigrants, and, as always, racial and ethnic advocacy and electoral activity.
A third incontrovertible demographic fact should also influence the study of urban politics. That is geographic mobility—into and out of cities, suburbs, and regions. Political scientists have traditionally depicted cities as the location of poor, nonwhite residents (in both senses—a disproportionate share of urban residents were poor and nonwhite, and a disproportionate share of poor nonwhites lived in cities). For example, my co-author and I published a book in 2003 that was replete with distinctions between generally successful suburban school systems and generally unsuccessful urban school systems. To give only one instance:
If poor urban children could attend schools in wealthier (and whiter) districts, it would increase racial and class integration for all students…. But … the politics of choice begin to resemble the politics of desegregation…. Few nonurban politicians … can risk supporting a program that permits a large number of poor non-Anglo children from the city to attend public schools (and sometimes even private schools) in the suburbs.Footnote 11
The point here is not our analysis of the politics of school choice; it is that in analyzing the politics of school choice, we implicitly equated poor, non-Anglo, and urban, and also implicitly equated wealthier, whiter, and suburban. Even if we were right to do so a decade ago, those are no longer accurate equations; as one important study points out, “for the first time, a majority of all racial/ethnic groups in large metro areas live in the suburbs.”Footnote 12
Overall, whites still predominate in the suburbs of large metro areas; they comprise about two-thirds of suburban residents, compared with just over four-tenths of city dwellers. They are even more dominant in places that Frey and his colleagues deem emerging suburbs and exurbs. Nevertheless, suburbs of some cities are gaining non-Anglo residents, as figure 6 shows.
Racial and ethnic composition of selected cities and suburbs, 2008
Source: Metropolitan Policy Program 2010: 61.

As always, there is a dominant pattern surrounded by great variation. In all of these and other metropolitan areas, cities contain a larger proportion of blacks and Hispanics, and a smaller proportion of whites, than do the surrounding suburbs. But that pattern is reversed in some locations for Asian Americans. Most importantly, the proportion of suburbanites who are not white has been steadily increasing over the 2000s; it now ranges from not quite one-fifth in Detroit to half in Atlanta and two-thirds in Los Angeles. In a few locations, whites have been entering cities while nonwhites have been moving to the suburbs (whether directly from their country of origin or from the city varies by group and location). We see this in figure 1 for Washington D.C. and Atlanta; it is also the case in about ten other of the 100 largest cities.
A move to the suburbs is not necessarily a sign of improving economic status or an indicator of access to better schools, more amenities or jobs, or less crime. Reasons for and impacts of such a move are empirical questions whose answers are likely to be complex and to vary across groups and metropolitan areas; they form many of the controversies discussed briefly below. But geographic mobility into and out of cities implies that the conventional trope of understanding political tensions through the lens of nonwhite city versus white suburb warrants reconsideration. Analysis of politics around racially-inflected geographic mobility will need to focus on geographic and political municipal fragmentation, inter-governmental relations, regional policy initiatives, and the political incentives of allocative, distributive, and redistributive policies within and across boundaries.
Demographers have a great advantage over political scientists; if their data are of high quality, their conceptualizations persuasive, and their methods appropriate, they can obtain straightforwardly correct answers to the questions they ask. They can also make empirically convincing projections; we know now roughly what the adult-child dependency ratio will be in two decades because all of the children who will be workers then have already been born. Political scientists have the much more difficult (and interesting) task of explicating the political implications of demographic change, and perhaps of projecting political dynamics into the future. Not surprisingly, they—we—disagree vehemently about these things. I turn now to controversies surrounding the three incontrovertible demographic phenomena.
Political Science Controversies around the Three Demographic Trends
First, consider the implications for both protest and electoral politics of the rising Latino and Asian populations in many American cities. Although that phenomenon points us toward an array of important issues, here I can focus on only one, the formation and maintenance (or lack thereof) of political coalitions.
Urban researchers have articulated three central theoretical frameworks for explicating coalitions; they are not only in tension with one another but also generate internal debate. The oldest, arguably most appropriate to the first cluster of cities in figure 2, depicts black political activism as the starting point for understanding urban politics. In some cases, this is a prescriptive call for a progressive black politics that can lead less politicized individuals and groups into appropriate protest, advocacy, or campaign activity. As Michael Dawson puts it,
The African American community mobilized in support of Barack Obama [in 2008] at levels not seen in a very long time…. This electoral mobilization has not as of yet been effectively translated into substantial political gains …. For that to occur, it will have to evolve beyond electoral politics into a movement working to transform political and economic structures responsible for disadvantaging African Americans as well as so many other marginalized communities within the United States.Footnote 13
In the hands of other scholars, for example those listed in note 2, it is a more descriptive and analytic explanation for urban political change.
Controversy within this framework revolves around questions of whether or when a racialized or deracialized political campaign is most effective; whether or when switching from protest activity or litigation to electoral politics, or vice versa, is most effective; whether or when the black population can be understood as a single community or is fragmented by class, occupation, nationality, or neighborhood; and whether or when the black population can ever emerge from a discriminatory hierarchy to claim its fair share of power and resources. Despite fierce debates, an identifiable cluster of research starts from within black politics in predominantly black cities and develops from there; the crucial question for contemporary urban scholarship is the continuing relevance of that venerable tradition.
The second framework for studying coalitions starts from that issue of relevance: is the black politics framework generalizable to predominantly Latino cities? Scholars disagree on whether research should start by modifying the black politics framework, or by developing a new, group-specific analysis focused around nationality and immigration status for cities such as those on the right side of figure 2. This question is analogous to, and substantively connected with, the issue of whether the concepts of linked fate or group consciousness are unique to African Americans:
Maybe we should take a step back to consider the implications of employing concepts intricately intertwined with the oppressive history of Blacks in the United States, and measures developed during a time of civil rights activism, civil strife, and racial conflict between white and black Americans…. Scholars should acknowledge potential problems in their [i.e., measures of group consciousness] transference.Footnote 14
After all, Latinos' perceptions of shared fate decline across generations away from immigration, while Asian Americans' comparable perceptions decline and then rise across post-immigration generations.Footnote 15 Neither of those dynamics resembles blacks' persistent group identity over centuries. Relatedly, “Latinos” may or may not be a sufficiently coherent group so that urban politics in predominantly Hispanic cities parallels black urban politics. Furthermore, being an immigrant or having a particular legal status may imply a very different political stance than being a native-born or long-term American. Thus some argue that one must study the politics surrounding immigrants and their descendants differently from the politics of descendants of enslaved African Americans.Footnote 16 But just how to do so is not at all clear; given that more than half of Latinos identify as white and substantial minorities label themselves conservative or Republican, perhaps heavily Hispanic cities should not be studied through the lens of minority politics at all.
So scholars differ within the black politics framework, within the Latino politics framework, and across the two. But the most intense controversies and the least well developed frameworks revolve around the middle cluster of cities in figure 2—those in which no group dominates the population. How should we understand and analyze the creation, maintenance, or failure of intergroup coalitions? Many scholars have analyzed conditions under which effective coalitions are formed; perhaps just as many have analyzed conditions under which alliances fail or never start. This line of research includes excellent case studies and comparisons across groups, policy arenas, locations, and coalitional strategies. I teach them, use them in my research, and recommend them to others. Nevertheless, the scholarship has not cumulated into a robust, supple theory of coalitional formation, persistence, dissolution, or nonexistence that travels well across time, space, or groups. Theories risk being tautological (leadership is effective if coalitions develop and are sustained, but coalitions require effective leadership in order to develop), specific to one case (Miami's Cubans are too different from Miami's Haitians to form a non-white coalition), capable of explaining coalitional breakdown or success but not both (white elites work to keep poor people of color from allying, or progressives coalesce around shared convictions), or otherwise insufficient. But this deficiency can be turned into an asset; the fact that so many American cities are undergoing demographic transitions offers a rich source of comparative evidence from which robust theories of coalitional politics can be developed and tested.
Next, consider the implications of the second incontrovertible demographic fact, the growth of the dependency ratio. A few scholars have developed a fruitful debate on the political implications of this trend; it is a debate into which political scientists should insert themselves vigorously. On one side are the pessimists, or at least the cautious. The pediatrician Bernard Guyer and his colleagues describe the dependency ratio (reproduced in figure 5) as “the challenge for the 21st century”:
Debates about allocation of scarce resources will increasingly need to achieve a delicate balance between the health and resource needs of children with those of the elderly, a debate that is likely to become more favorable to the elderly population based on their numbers alone and their political will…. The future for our children and subsequent generations depends on our advocacy for children in the ongoing political debate.Footnote 17
William Frey echoes this concern for what Guyer and his colleagues characterize as “our most vulnerable population,” adding to it attention to the racial and nativity divide in cities' growing dependency ratio. In Frey and his colleagues' words, “metro areas that have attracted large numbers of Hispanics and Asians display something of a ‘cultural generation gap,’ more pronounced than that which exists at the national level…. Setting public priorities and fostering social cohesion in these … regions may take on added challenges due to their unique racial/ethnic overlay.”Footnote 18 Ronald Brownstein is the most apocalyptic (as well as the most metaphorically colorful):
In an age of diminished resources, the United States may be heading for an intensifying confrontation between the gray and the brown. Two of the biggest demographic trends reshaping the nation in the 21st century increasingly appear to be on a collision course that could rattle American politics for decades…. A contrast in needs, attitudes, and priorities is arising between a heavily (and soon majority) nonwhite population of young people and an overwhelmingly white cohort of older people. Like tectonic plates, these slow-moving but irreversible forces may generate enormous turbulence as they grind against each other in the years ahead.Footnote 19
These concerns are empirically well-founded; even in the 1990s, “an increase in the fraction of a jurisdiction's population over the age of 65 tends to reduce per-child school spending, and … the effect is especially pronounced when the elderly residents are from a different ethnic group than the school-age population.”Footnote 20
Nevertheless, this pessimism is not universal; optimists see in the dependency ratio the opportunity to incorporate young non-Anglos into the good jobs, thriving neighborhoods, and universities from which the declining white population is of necessity withdrawing. Richard Alba points out that the coming retirement of workers born soon after World War II “will open up a huge swath of positions, running from the bottom to the top of the workforce. Because of the disproportionate concentration of white baby boomers in the middle and upper ranges of the occupational structure, the potential for racial and ethnic shifts will be especially large there…. There will be much more ethno-racial diversity at the middle and higher levels of the United States within the next few decades.” Alba worries that African Americans, American Indians, and second-generation Hispanics will not be positioned to move into the newly vacated high-status jobs if the United States does not reduce racial and ethnic gaps in schooling quality and attainment. Nevertheless, “the blurring of major ethno-racial boundaries is a plausible prospect for the near future” because of, in large part, the coming demographic transition.Footnote 21
Dowell Myers takes Alba's analysis a step further, arguing that incorporation of young non-Anglos is in the direct interests of current homeowners and taxpayers—and therefore of voters. After all, when aging baby boomers seek to sell their homes and move to condominiums near their grandchildren, they need buyers with resources; those will increasingly not be other whites. Furthermore, either taxes on the elderly must be raised or more young adults must be financially able to pay taxes in order to cover Medicare and Social Security; here too, older white voters' self-interest implies a need to ensure steady if not high wages for the expanding population of young immigrants and their descendants, as well as of young native-born blacks and whites.
Unlike most demographers, Myers pays attention to the political configuration needed to upgrade schooling and jobs so that the United States will have a population able to move into Alba's top-tier positions, buy boomers' houses, and pay taxes. He envisions an “intergenerational social contract” with a “cycle of roles,” from good education for children through adult productivity and taxpaying (I would add voting) and eventually to satisfying retirement.Footnote 22. He does not imagine this virtuous cycle to be easily attained, but he points out that it is in everyone's interest for it to dominate Brownstein's vicious cycle of “intensifying confrontation between the gray and the brown.” My co-author and I edged into the same political question in addressing the need to improve urban, predominantly non-white, schools:
The central question is whether political leaders will inflame these divisions [of the racially-inflected dependency ratio] or seek to ameliorate them…. [M]any policymakers, particularly elected officials, think little about the long run; the horizon until the next election is too short and the rewards for small symbolic actions too great. In the face of the new demography, some will no doubt yield to the temptation for demagoguery, especially in situations of volatile transition. Other political activists will concentrate on securing benefits for their group rather than on broader policy considerations.
But others might take a different stance. As the situation changes, some ethnic group leaders will be able to seek coalitions rather than focus on competition. And most importantly, some candidates for public office might decide it is best to try to lead all Americans by placing a priority on the democratic, collective values of participation, respect, inclusion, and opportunity. With the potential for political and social chaos so great, it is possible that more Americans will want their leaders on the high road rather than in the swamp.Footnote 23
In sum, the dependency ratio could generate a wide array of policy outcomes; their mix will be determined by the intersecting actions of political elites, advocacy groups, voters, courts, policy experts, and protesters. So far as I know, political scientists have yet to develop robust theories or empirical tests of the politics of the racially-inflected dependency ratio in the United States (indeed, other than me, no one quoted or cited in this section is a political scientist). The question of where, when, why, and how the politics of race and age in cities will confirm pessimistic or optimistic visions remains completely indeterminate, and a ripe subject for comparative research.
Finally, consider the controversies implicit in the politics of racial and ethnic groups' migration across city boundaries or directly to suburbs from sending countries. Political scientists have studied whites' movement into cities under the label of gentrification or reverse white flight; they disagree on whether affluent movers-in “take up temporary residence side by side with poorer black neighbors, before eventually pushing out the less fortunate” or whether they are urgently needed contributors to the “innumerable decisions to invest labor and materials in a place and in so doing to transform it … [—] grounding the interests of those who build and pay for building all the houses and public structures, … who sustain the churches and schools from year to year with their money and their effort.”Footnote 24 These are obviously antithetical normative judgments, but both could be empirically correct. Sociologists and economists have investigated who moves and why; more political scientists could build on this base by comparing cities to determine the political forces that affect white reverse migration and its impacts.
Similar controversies, and the same need for systematic comparative analyses, pertain with regard to the suburbs to which non-Anglos are moving. Suburban movement results from a combination of direct immigration, increasingly affluent city-dwellers' desire for upward mobility, and “poor urban residents being forced out of the inner city by a variety of mechanisms, including the destruction of public housing and gentrification.”Footnote 25 Again, sociologists, demographers, and economists have shown us who is moving and why, but they do little to address the political causes and consequences. There is much work for political scientists in understanding the electoral impact of decreases in the overall and nonwhite populations of cities, and corresponding increases in suburbs.
The broadest and sharpest controversy about geographic mobility, however, has to do with the overall pattern rather than the particular movers. The titles of two recent reports neatly frame the debate: “The End of the Segregated Century” and “The End of Segregation? Hardly.” In the first, Edward Glaeser and Jacob Vigdor show that black segregation declined between 2000 and 2010 in all ten of the United States' largest metropolitan areas. More generally,
• American cities are now more integrated than they've been since 1910. Segregation rose dramatically with black migration to cities in the mid-twentieth century. On average, this rise has been entirely erased by integration since the 1960s…. The separation of blacks from individuals of other races declined in 85 of the nation's 85 largest metropolitan areas.
• All-white neighborhoods are effectively extinct. A half-century ago, one-fifth of America's urban neighborhoods had exactly zero black residents. Today, African-American residents can be found in 199 out of every 200 neighborhoods nationwide. The remaining neighborhoods are mostly in remote rural areas or in cities with very little black population.
• Gentrification and immigration have made a dent in segregation…. [However,] the rise of black suburbanization explains much more of the decline in segregation.
• Ghetto neighborhoods persist, but most are in decline. For every diversifying ghetto neighborhood, many more house a dwindling population of black residents…. Former residents decamp for the suburbs or for the rapidly growing cities of the Sun Belt—where segregation is generally very low.Footnote 26
But the second study presents “a more nuanced story, in which the end of the era of segregation is not at hand…. [T]he pace [of residential integration] is modest and segregation remains substantial…. [especially in] ghetto-like contexts, where many poor blacks and poor Hispanics live side by side in underserved neighborhoods.” At the block level in New York City, “the general spatial contours of segregation remain intact.” Even where a neighborhood shows a “more mixed population” in 2010 than in 2000, “what is often less clear is whether these changes would qualify as meaningful and stable integration.” Finally, even if stable, “is it integration when poor Blacks and poor Latinos live together?” as Glaeser and Vigdor imply. If black and Latino co-residence is treated as segregation rather than integration, then in nine of the ten largest metropolitan areas, segregation remains a good deal higher than Glaeser and Vigdor report.Footnote 27
This debate will continue among the data analysts; the issue for scholars of urban politics is the political impact of the fact that residential segregation of blacks from others and of whites from others is declining at the same time that residential mixing of poor blacks and poor Latinos is rising. That pattern points to what might be the most important demographic change. Residential separation by income has been growing steadily over the past few decades to the point that most people are now more segregated by class than by race:
The share of the population in large and moderate-sized metropolitan areas who live in the poorest and most affluent neighborhoods has more than doubled since 1970, while the share of families living in middle-income neighborhoods dropped from 65 percent to 44 percent. The residential isolation of both the poor and affluent families has grown over the last four decades…. Income segregation among African Americans and Hispanics grew more rapidly than among non-Hispanic whites, especially since 2000.Footnote 28
Political scientists have a great deal of exciting work to do in sorting out the electoral, protest, and policy implications of these simultaneous trajectories. How will mayors, city council members, and political parties respond to the combination of rising economic segregation, declining white and black segregation, increasing black and Latino integration (or at least co-residence), movement of nonwhites to the suburbs and whites to the city, and growing numbers of immigrants from all over the world? How will members of the various groups respond to these combinations? What policies will emerge, and will they exacerbate or ameliorate the inevitable tensions generated by “these slow-moving but irreversible forces … as they grind against each other in the years ahead,” to quote Brownstein again? Furthermore, urban politics will affect urban demographics as well as the reverse; what voters, groups, elected officials, policy makers, and political institutions do in response to the mingled forces of economic and racial integration and segregation will themselves promote or retard further change.
I anticipate that political scientists will divide in not altogether constructive ways as they study these questions. For reasons that I do not understand, people now identified as “conservative” tend to see the glass of a complicated political situation as half full, while people identified as “progressive” tend to emphasize that the glass is half empty. (Put another way, sociologists and political scientists often see optimistic arguments as “conservative” and pessimistic ones as supporting progressive ideologies.) That is a reversal of many centuries of political philosophy, in which the right cautioned against change and feared that sin, corruption, or human weakness would prevent progress while the left sought innovation and experimentation based on faith that humans and their societies could be improved if not perfected. As one who defines herself as progressive but also sees genuine change for the better in American racial and ethnic dynamics,Footnote 29 I find these ideological, or perhaps psychological, reversals disturbing.
In the end, cities are full of surprises, and it behooves us as scholars and citizens to develop theories that explain and evidence that demonstrates successes as well as disasters, improvement as well as acute injustices. Perhaps the slightly cool discipline required for measuring demographic change—in race, ethnicity, immigration, age, and class—can give us a vantage point for examining what remains the same as in the early or late twentieth century, what has irrevocably changed, and what politics has to do with all of it.