Implications
This study shows that some plant extracts have the potential to improve rumen fermentation and hence animal productivity in goats; however, applying in vivo the same dosage as used in vitro in relation to rumen volume results in a proportional lower extent of improvement. Short-term (9 days) in vivo trials allowed us to test the potential of different dosages in the diet of ruminants that would need to be further confirmed in longer term trials.
Introduction
Animal production, and in particular the ruminant sector, carries with it a significant environmental cost, as enteric methane from ruminants is responsible for circa 80% of the methane emissions from the sector (Morgavi et al., Reference Morgavi, Forano, Martin and Newbold2010). In addition, methane production in the rumen may account for as much as 12% of the gross energy intake in ruminant animals (Johnson and Johnson, Reference Johnson and Johnson1995), thus representing an energy loss for the animal. If the ruminant livestock sector is to continue to flourish and grow, then new technologies to maximize efficiency should be developed. In that context, previous studies showed that plants contain an extensive variety of secondary compounds with antimicrobial activity and potential, in certain amounts, to enhance rumen fermentation (Benchaar and Greathead, Reference Benchaar and Greathead2011). However, the effects reported in the literature are variable and contradictory that may be because of the different concentrations of ingredients, basal diets used and lack of direct in vitro–in vivo comparisons (Hart et al., Reference Hart, Yáñez-Ruiz, Duval, McEwan and Newbold2008). With regard to the diet, Newbold et al. (Reference Newbold, McIntosh, Williams, Losa and Wallace2004) reported that a specific blend of essential oils affected protein degradation to a different extent, depending on the protein source used in the diet (rapeseed v. soya bean meal), and Duval et al. (Reference Duval, McEwan, Graham, Wallace and Newbold2007) suggested that essential oils interfere differently with some key rumen bacteria, depending on the starch source (wheat, barley or maize).
Although in vitro methodologies are useful to assess the effects of a wide variety of plant extracts and their compounds on rumen fermentation, there are limitations related to the extrapolation of compound doses tested in vitro to in vivo conditions (i.e. heavily buffered rumen fluid in vitro, different solid and liquid turnover rates, changes induced in the microbial ecosystem when incubated in vitro, such as a decrease in total biomass and community structure, and limited presence of fungi and protozoa; Soto et al., Reference Soto, Yáñez-Ruiz, Cantalapiedra-Hijar, Vivas and Molina-Alcaide2012). In addition, in vitro and in vivo studies are normally conducted separately and often no reference compound with a known, consistent effect is included. The majority of in vivo research has been conducted with cattle or sheep, with limited information concerning goats that sometimes respond to antimicrobial compounds differently from other ruminants (i.e. the presence of condensed tannins; Yáñez-Ruiz et al., Reference Yáñez-Ruiz, Moumen, Martin Garcia and Molina Alcaide2004). On the basis of recent literature (Benchaar and Greathead, Reference Benchaar and Greathead2011; Bodas et al., Reference Bodas, Prieto, García-González, Andrés, Giráldez and López2012) and the results in our group, eight plant compounds that have shown promise in decreasing methane production in the rumen were selected to evaluate in vitro (24 and 72 h) the effects of different doses on rumen fermentation and microbiota when two substrates differing in starch and protein source are fermented. The objective was to identify the compounds with more antimethanogenic potential and to validate to what extent the activity is confirmed in vivo in goats using the same range of dosage as in vitro.
Material and methods
Two in vitro experiments were conducted in batch cultures to assess the effects of different concentrations of a range of plant compounds on rumen fermentation by the incubation of two experimental diets over 24 h (Experiment 1) or 72 h (Experiment 2). On the basis of the results obtained in Experiments 1 and 2, an in vivo experiment (Experiment 3) was conducted on goats to further test in vitro results.
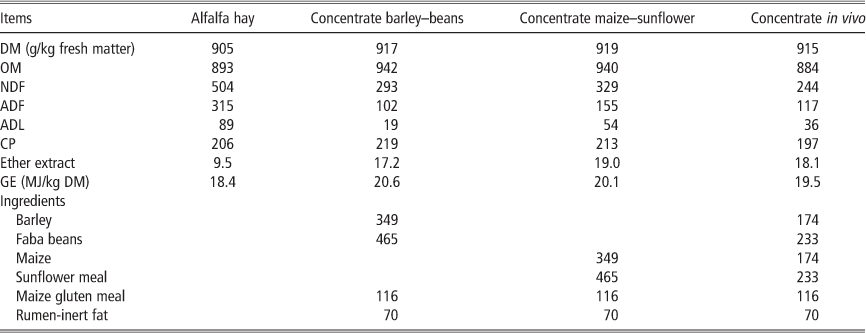
Diets, additives and animals
The experimental diets (Table 1) used in Experiments 1 and 2 consisted of a 50 : 50 forage (alfalfa hay) : concentrate, in which the concentrate included maize gluten meal (116 g/kg) and rumen-inert fat (70 g/kg) plus different protein and starch sources with high rumen degradability; barley (349 g/kg) and faba beans (465 g/kg) in concentrate (diet barley–beans); and medium degradability: maize (349 g/kg); and sunflower meal (465 g/kg) in concentrate (diet maize–sunflower). The diet used in Experiment 3 was alfalfa hay : concentrate (55 : 45), in which the concentrate was a mix (non-pelleted) of all the ingredients used in Experiments 1 and 2 (gluten meal 116 g/kg, rumen-inert fat 70 g/kg, maize 174 g/kg, barley 174 g/kg, faba beans 233 g/kg and sunflower meal 233 g/kg). Animals had access to mineral–vitamin blocks and clean drinking water.
Chemical composition of alfalfa hay and concentrates (g/kg DM) and ingredients (g/kg) of concentrates

OM=organic matter; DM=dry matter; GE=gross energy.
The compounds tested were carvacrol (CAR, 5-isopropyl-2-methylphenol, 97% purity), cinnamaldehyde (CIN, (2E)-3-phenylprop-2-enal, 93% purity), eugenol (EUG, 4-Allyl-2-methoxyphenol, 98% purity) and four garlic compounds: diallyl disulfide (DDS, 3-prop-2-enyldisulfanyl prop-1-ene, 80% purity), propyl propane thiosulfinate 75% purity (PTS), propyl propane thiosulfonate 85% purity (PTSO) and a commercial mixture (40:60) of PTS and PTSO (PTS+PTSO). In addition, bromochloromethane (BCM, halogenated aliphatic hydrocarbon) was included as a positive control (Goel et al., Reference Goel, Makkar and Becker2009; Abecia et al., Reference Abecia, Toral, Martín-García, Martínez, Tomkins, Molina-Alcaide, Newbold and Yáñez-Ruiz2012). The CAR, CIN, EUG and DDS were obtained from Sigma-Aldrich Chemical; PTS and PTSO were provided by DMC Research Center SL (Granada, Spain); the commercial mixture of PTS and PTSO (Garlicon) was obtained from Prebia Feed Extracts S.L. (Toledo, Spain); BCM (Sigma-Aldrich Chemical) was entrapped in an α-cyclodextrin matrix (May et al., Reference May, Payne, Stewart and Edgar1995). The formulation was prepared in our laboratory as dry white powder in 1 to 2 kg batches and contained 10% to 12% (wt/wt) of BCM.
Four female Murciano-granadina goats fitted with permanent rumen cannula were used as donors of rumen content for the in vitro experiments. Goats were fed ad libitum once a day (0900 h) with equal amounts of alfalfa hay and concentrate (same as in Experiment 3) and had free access to water and mineral salt blocks (Pacsa Sanders, Sevilla, Spain). In Experiment 3, 32 adult, female, non-pregnant Murciano-granadina goats (33±5.2 kg), fed at a maintenance level with alfalfa hay and concentrate (55 : 45), were used. Animals were cared for by trained personnel in accordance with the Spanish guidelines for experimental animal protection (Royal Decree No. 1201/2005) and the European Convention for the Protection of Vertebrates used for Experimental and other Scientific Purposes (European Directive 86/609). All the experimental procedures involved in this study were approved by the Animal Welfare Committee at the Institute of Animal Nutrition (CSIC, Spain).
In vitro experiments
Rumen contents were collected and pooled from the four goats before the morning feeding, and immediately taken in thermal flasks to the laboratory where they were filtered through two layers of cheesecloth while bubbled with CO2. The buffered mineral solution (Menke and Steingass, Reference Menke and Steingass1988) was heated in a water bath at 39°C and bubbled continuously with CO2, 2 h before rumen contents collection. The filtered rumen fluid was mixed with the buffer mineral solution in a 1 : 3 ratio (Menke and Steingass, Reference Menke and Steingass1988). The time required from rumen content collection to inoculation of bottles was <30 min.
Experiment 1
Three 24 h incubation runs were carried out with two bottles (per diet, treatment and dose) and two blanks in each run. Average values from two bottles in each run were used as experimental replicate. Treatments were: control (dose 0), CAR, CIN, EUG, DDS, PTS, PTSO, PTS+PTSO and BCM. Doses were 0, 40, 80, 160 and 320 µl/l, with the exception of BCM that was added at 160 and 320 µl/l doses. A commercial wireless system (AnkomRF Gas Production, Ankom Technology, NY, USA) consisting of bottles equipped with pressure sensor modules and a reception base station connected to a computer was used to measure pressure as described by Cornou et al. (Reference Cornou, Storm, Hindrichsen, Worgan, Bakewell, Yáñez-Ruiz and Abecia2013). After 24 h of incubation, the fermentation was stopped by placing the bottles in ice and the content filtered to collect a sub-sample: 0.8 ml for VFA analysis was collected and was kept at −20°C.
Experiment 2
Three 72 h incubation runs were carried out with three bottles (per diet, treatment and dose) and three blanks in each run. Average values from three bottles in each run were used as experimental replicate. On the basis of results from Experiment 1, a selection of compounds and doses was made: 160 and 320 µl/l for CA, CIN and PTS; 40 and 160 µl/l for PTSO; 80 and 320 µl/l for DDS; 160 and 320 µl/l for BCM and 0 µl/l as control. The experimental diets incubated were those used in Experiment 1. The experimental procedure was based on Theodorou et al. (Reference Theodorou, Williams, Dhanoa, McAllan and France1994). The headspace pressure and volume of gas was measured with a Wide Range Pressure Meter (Sper Scientific LTD, Scottsdale, AZ, USA) and a glass-calibrated syringe (Ruthe®, Normax, Marinha Grande, Portugal), respectively, at 2, 4, 6, 8, 12, 24, 36, 48 and 72 h after inoculation. At 2, 4, 6, 8, 12 and 24 h, a sample of the gas in each bottle was collected in a graduated syringe and transferred to a 5 ml vacuum tube and then kept at room temperature before methane content was measured by gas chromatography (GC). One of the replicate bottles per treatment was opened at 24 h to collect 1 ml from the content for DNA extraction. After 72 h, fermentation was stopped in the two remaining bottles and the bottle content was lyophilized for dry matter (DM) and NDF determination.
Experiment 3
Two groups of 16 adult goats were used to test the effects of PTS and BCM, respectively, on methane emissions. Within each group of 16 goats, four experimental blocks of four animals were made according to BWs and within each block, one goat was randomly assigned to one of the four experimental treatments (control plus three doses) for 9 consecutive days. Therefore, four goats per treatment were used. Goats were held in individual pens of 2×2 m. Doses of PTS and BCM were selected on the basis of results from Experiments 1 and 2, assuming a similar rumen content volume in both experimental groups of 11% of BW (Abecia et al., Reference Abecia, Toral, Martín-García, Martínez, Tomkins, Molina-Alcaide, Newbold and Yáñez-Ruiz2012). Doses were equivalent to: 0, 50, 100 and 200 mg/l rumen content per day of PTS and 0, 50, 100 and 160 mg/l rumen content per day of BCM. The experimental diet consisted of alfalfa hay and concentrate provided at a ratio of 55 : 45 to cover the maintenance energy requirements (Prieto et al., Reference Prieto, Aguilera, Lara and Fonollá1990). The experiment included 7 days for adaptation of animals to the additives and 2 days for feed intake and methane emission measurements. Diet and additives were provided to animals in two equal meals at 0900 h and 1400 h. The corresponding dose of PTS and BCM was pipetted and weighed, respectively, into 10 g of ground oats and wrapped in cellulose paper coated with molasses immediately before oral administration. On day 8, each animal was transferred into a cage within a respiration chamber for methane measurements for 2 consecutive days. A set of four identical chambers (1.8 m wide×1.8 m deep×1.5 m tall) were used as described by Abecia et al. (Reference Abecia, Toral, Martín-García, Martínez, Tomkins, Molina-Alcaide, Newbold and Yáñez-Ruiz2012).
Chemical analyses
DM (method ID 934.01), ash (method ID 942.05), ether extract (method ID 7.045) and CP by Kjeldhal (method ID 984.13) in samples were determined by the procedures of the Association of Official Analytical Chemists (AOAC, 2005). Gross energy was measured with an adiabatic calorimeter (Model 1356, Parr Instrument Co., Moline, IL, USA). Neutral detergent fibre with heat-stable amylase and expressed inclusive of residual ash (NDF), acid detergent fibre expressed inclusive of residual ash (ADF) and ADL contents were analysed following the methodology described by Van Soest et al. (Reference Van Soest, Robertson and Lewis1991), using an ANKOM Model 220 Fibre Analyser (Macedon, NY, USA). The individual VFA concentrations were analysed using the GC technique described by Isac et al. (Reference Isac, García, Aguilera and Molina1994). The methane concentration was determined by GC using a HP Hewlett 5890, Packard Series II gas chromatograph (Waldbronn, Germany). A sample of 0.5 ml of gas was injected using a 1 ml Sample-Lock® syringe (Hamilton, Nevada, USA).
Real-time PCR analysis
Samples collected in Experiment 2 after 24 h of incubation were freeze-dried and used to isolate DNA using QIAamp DNA Stool Mini Kit (Qiagen Ltd, West Sussex, UK) following the manufacturer’s instructions but with higher temperature (95°C) for lysis incubation. The DNA samples were used as templates for quantitative real-time PCR (qPCR) amplification. The corresponding gene copies of total bacteria, protozoa and methanogenic archaea were quantified by qPCR as described by Abecia et al. (Reference Abecia, Toral, Martín-García, Martínez, Tomkins, Molina-Alcaide, Newbold and Yáñez-Ruiz2012).
Calculations
The volume of gas produced in Experiment 1 was calculated from the readings of gas pressure in the 24 h of fermentation as described by Cornou et al. (Reference Cornou, Storm, Hindrichsen, Worgan, Bakewell, Yáñez-Ruiz and Abecia2013). The gas produced in batch cultures (Experiment 2) was adjusted to the model: y=A[1−e−c*t] (France et al., Reference France, Dijkstra, Dhanoa, Lopez and Bannink2000), where y represents the cumulative gas production (ml); t represents the incubation time (h); A represents the asymptote (potential gas volume at steady state; ml); and c represents the gas production rate (h−1). Digested NDF after 72 h of incubation was calculated as (NDF input–NDF output)/NDF input, with NDF output being NDF content in the residue after 72 h incubation. The volume of gas produced (ml) was corrected for standard conditions (105 Pa, 298 K), and the amount (µmol) of methane produced was calculated by multiplying the gas produced (µmol) by the concentration of methane in the analysed sample. The flux of methane (Experiment 3) for each chamber was calculated for the 2-day periods of measurement from the difference of fresh air intake and chamber exhaust methane concentrations and mean air flux. The air stream in each of the five ducts (chamber one to chamber four and background) was sub-sampled, and methane concentration was measured continuously using a gas analyser ADM MGA3000 (Spurling works, Herts, UK). It took 14 min to sequentially sample the airflow in each intake and exhaust ducts in the four chambers (3 min in chambers, 2 min for background).
Statistical analysis
Data from Experiments 1 and 2 were analysed as a univariate model using the MIXED procedure of SAS (version 9.3, SAS Institute Inc., Cary, NC, USA). The statistical model included the fixed effects of diet, dose and their interaction, with the period as a random effect. Data from Experiment 3 were analysed using the MIXED procedure of SAS, with the animal as the experimental unit. Linear (L), quadratic (Q) and cubic (C) components of the response to incremental amounts of each compound were evaluated using orthogonal polynomial contrasts. The CONTRAST option of the MIXED procedure used the coefficient matrix generated in PROC IML for the unequally spaced treatments. In addition, the flux of methane emissions measured in Experiment 3 was subjected to ANOVA for repeated measures using the MIXED procedure of SAS and assuming a covariance structure fitted on the basis of Schwarz’s Bayesian information model fit criterion. The statistical model included the fixed effects of dose, hour and their interaction, and the initial record measured at 0 h (covariate). Differences were declared significant at P<0.05 and considered as tendencies towards significance at P<0.10.
Results
Experiments 1 and 2 (in vitro)
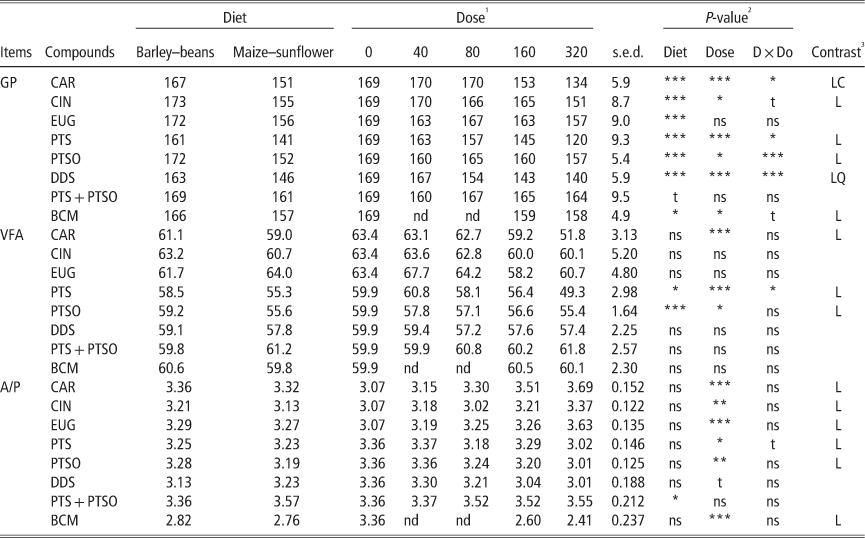
In Experiment 1, the total gas production was linearly decreased (P⩽0.012) by all compounds, with the exception of EUG and PTS+PTSO (Table 2). Significant (P⩽0.014) Diet–Dose interaction was detected for CAR, PTS, PTSO and DDS, which consisted of a stronger decrease in gas production, mainly for PTS and DDS at doses 40 and 160, respectively, when diet maize–sunflower was used. Total VFA concentration was linearly reduced (P⩽0.002) by the increasing addition of CAR, PTS and PTSO, whereas no effect (P⩾0.05) was observed for the other compounds. Diet–dose interaction was only detected (P=0.0138) for a PTS (28% decrease in bottles with maize–sunflower substrate, whereas no effect on barley–beans diet). The acetate : propionate ratio was modified by all compounds, with the exception of PTS+PTSO; however, the response differed among molecules: increasing levels of CAR, CIN and EUG linearly increased (P⩽0.002) the ratio, whereas the opposite pattern (P⩽0.003) was observed for PTS, PTSO and BCM, and a tendency was observed for DDS (P=0.064).
Effects of diet and additive doses on GP (ml gas/g incubated DM), VFA concentration (mM) and acetic : propionic ratio (A/P) after 24 h of incubation in batch cultures (Experiment 1)
GP=gas production; DM=dry matter; VFA=volatile fatty acid; A/P=acetic : propionic ratio; CAR=carvacrol; CIN=cinnamaldehyde; EUG=eugenol; PTS=propyl propane thiosulfinate; PTSO=propyl propane thiosulfonate; DDS=diallyl disulfide; BCM=bromochloromethane; nd=not determined.
1 Doses are expressed in µl/l of buffered inoculum.
2 Probability of significance effects because of diet, dose and their interaction (D×Do). nsP>0.10; tP<0.10; *P<0.05; **P<0.01; ***P<0.001.
3 Significant (P<0.05) linear (L), quadratic (Q) or cubic (C) effects of the response to incremental dose of each compound estimated by orthogonal polynomial contrast.
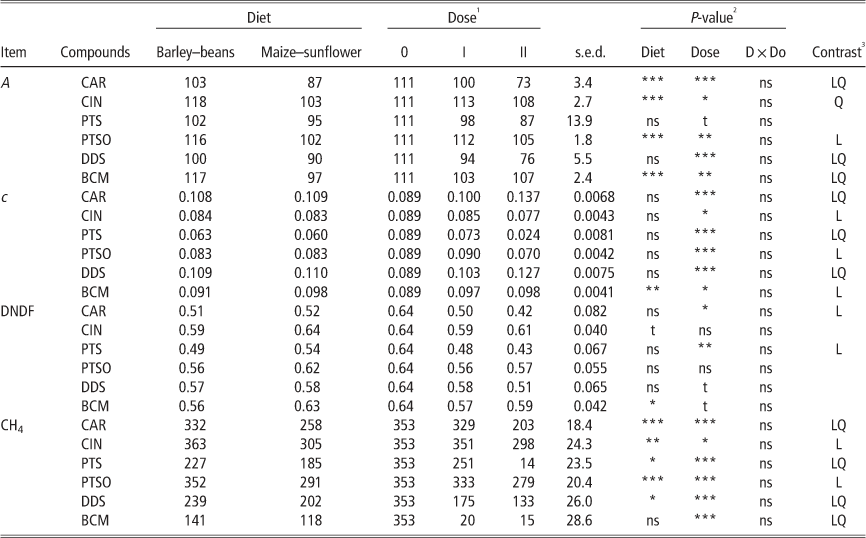
In Experiment 2, no diet–dose interaction (P⩾0.05) was observed for any of the studied parameters (Table 3). The potential gas volume (A) was significantly lowered (P⩽0.001) by all treatments, and as a tendency (P=0.095) was observed with PTS. The gas production rate (c) was linearly increased (P⩽0.008) by CAR, DDS and BCM and reduced (P⩽0.004) by CIN, PTS and PTSO. Despite the effects on (A) and (c), the DNDF after 72 h of incubation was only linearly decreased (P⩽0.004) by CAR and PTS and as a dose tendency (P⩽0.089) by DDS and BCM. Methane production measured after 24 h of incubation was linearly decreased by all compounds (P⩽0.009), although the greatest reductions were observed for PTS (up to 96%), DDS (62%) and BCM (95%).
Effects of diet and additive doses on kinetics gas parameters (A: potential gas volume at steady state, ml; c: gas production rate, h−1), digested NDF (DNDF, g/g) after 72 h incubation and on CH4 production (µmol) after 24 h of incubation in batch cultures (Experiment 2)
CAR=carvacrol; CIN=cinnamaldehyde; PTS=propyl propane thiosulfinate; PTSO=propyl propane thiosulfonate; DDS=diallyl disulfide; BCM=bromochloromethane; CH4=methane.
1 Dose I for CAR, CIN, PTS and BCM was 160 µl/l, for PTSO was 40 µl/l and for DDS was 80 µl/l; Dose II for CAR, CIN, PTS, DDS and BCM was 320 µl/l and for PTSO was 160 µl/l.
2 Probability of significance effects because of diet, dose and their interaction (D×Do). nsP>0.10; tP<0.10; *P<0.05; **P<0.01; ***P<0.001.
3 Significant (P<0.05) linear (L) or quadratic (Q) effects of the response to incremental dose of each compound estimated by orthogonal polynomial contrast.
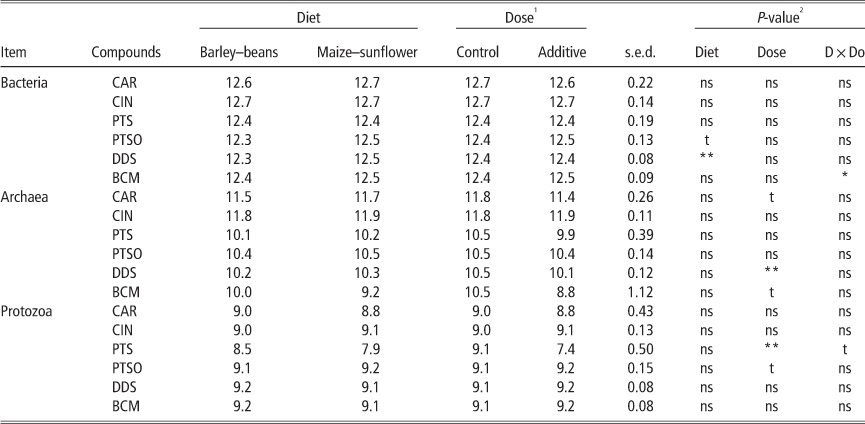
In Experiment 2, no effect of treatment on the population size of bacteria, protozoa and archaea was observed (Table 4), with the exception (P⩽0.003) of DDS and PTS that caused, respectively, a reduction of concentration in archaea (10.5 v. 10.1) and protozoa (9.1 v. 7.4).
Effects of diet and additive dose on the concentration (log gene copies/ml fresh matter) of total bacteria (16S rRNA), protozoa (18S rRNA) and methanogenic archaea (mcrA gene) in batch cultures after 24 h incubation (Experiment 2)
CAR=carvacrol; CIN=cinnamaldehyde; PTS=propyl propane thiosulfinate; PTSO=propyl propane thiosulfonate; DDS=diallyl disulfide; BCM=bromochloromethane.
1 Control correspond to dose 0; Additive correspond to dose 320 µl/l in CAR, CIN, PTS and DDS and 160 µl/l in BCM and PTSO.
2 Probability of significance effects because of diet, dose and their interaction (D×Do). nsP>0.10; tP<0.10; *P<0.05; **P<0.01.
Experiment 3 (in vivo)
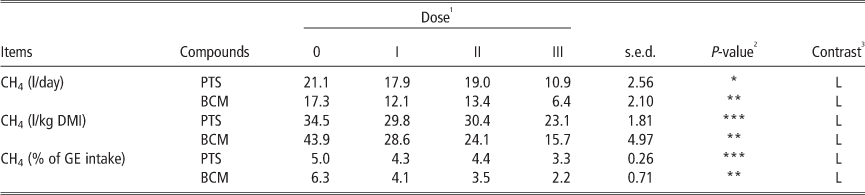
The addition of PTS and BCM linearly decreased (P⩽0.002) methane produced per kg of dry matter intake (DMI), respectively, up to 33% and 64%, compared with control (Table 5). The same effect was observed for the proportion of gross energy lost as methane. In contrast, for both compounds, the postprandial pattern of methane emissions through the day (Figures 1 and 2) consisted of larger differences among treatments over the first 5 h after the morning feeding, and then they gradually came closer towards the end of the day. When animals were treated with BCM, the hourly emissions showed differences among the three levels (P<0.001) right from the first measurements and there was no dose–time interaction (P=0.683). As for PTS, the same pattern (P=0.011) was only observed for the highest dose (200 mg/l rumen content) compared with the other two doses (50 and 100 mg/l), which resulted in a tendency to significant (P=0.099) dose–time interaction.
Effect of propyl propane thiosulfinate (PTS) addition on methane emissions by goats over 24 h. Doses I, II and III in PTS were 50, 100 and 200 mg/l rumen content, respectively. The arrows show feeding and treatment addition times.
Effect of bromochloromethane (BCM) addition on methane emissions by goats over 24 h. Doses I, II and III in BCM were 50, 100 and 160 mg/l rumen content, respectively. The arrows show feeding and treatment addition times.
Effects of different doses of PTS and BCM on CH4 emissions by goats (Experiment 3)
CH4=methane; PTS=propyl propane thiosulfinate; BCM=bromochloromethane; GE=gross energy.
1 Doses I, II and III in PTS were 50, 100 and 200 mg/l rumen content, respectively. Doses I, II and III in BCM were 50, 100 and 160 mg/l rumen content, respectively.
2 Probability of significance effects because of dose. *P<0.05; **P<0.01; ***P<0.001.
3 Significant (P<0.05) linear (L) effects of the response to incremental dose of each compound estimated by orthogonal polynomial contrast.
Discussion
The literature on the use of plant extracts to manipulate rumen fermentation is large and mostly involves in vitro assays (Benchaar and Greathead, Reference Benchaar and Greathead2011). The reported effects are variable and often contradictory, which is most likely because of differences in the plant extracts used, dose and possibly the basal diet (Hart et al., Reference Hart, Yáñez-Ruiz, Duval, McEwan and Newbold2008). The variability in concentration of compounds in plant extracts generates confusion because the effects can be contradictory, according to the content of the component in the extract and the dose used. Therefore, it is necessary either to report the concentrations of these compounds in the plant extracts used in research, or to use pure products to define activities, doses and mechanisms of action in an unequivocal form. The latest is the option chosen for this work. On the other hand, the effect of additives on rumen fermentation, and in particular on methane emissions, has been shown to depend to a certain extent on the substrate fermented (e.g. forage : concentrate ratio (Mateos et al., Reference Mateos, Ranilla, Tejido, Saro, Kamel and Carro2013) and type of forage (Castro-Montoya et al., Reference Castro-Montoya, De Campeneere, Van Ranst and Fievez2012)). The in vitro experiments in this work included two diets formulated for dairy goats and, based on previous observations, made when testing different types of essential oils (Newbold et al., Reference Newbold, McIntosh, Williams, Losa and Wallace2004; Duval et al., Reference Duval, McEwan, Graham, Wallace and Newbold2007). The ultimate goal was to test whether there was an interaction of additive×diet to ensure that the in vivo experiment was conducted using a diet that maximizes the effectiveness of the compounds and contribute to fill the gap of the lack of in vitro and in vivo experiments designed and carried out together for robust comparisons.
Experiments 1 and 2 (in vitro)
Experiment 1 was designed to screen four doses of eight compounds over 24 h incubations using two different substrates with the aim of selecting narrower dosage levels to be further tested over longer incubation periods (72 h). Although the reduction in gas production in vitro may indicate that the rumen fermentation could be compromised, most of the antimicrobial compounds tested in the literature have exhibited a depression of fermentation at a certain level of dosage (Benchaar and Greathead, Reference Benchaar and Greathead2011; Bodas et al., Reference Bodas, Prieto, García-González, Andrés, Giráldez and López2012). The challenge is to identify the dosage range to maximize the beneficial effect without compromising the overall fermentation. Only three compounds (PTS, CAR and PTSO) showed a negative effect on VFA concentration. Volatile fatty acids (VFAs) represent the main supply of metabolizable energy for ruminants, and therefore a reduction in their production would be nutritionally unfavourable for the host animal. In contrast, for most of the compounds (except DDS and PTS+PTSO), the acetate to propionate ratio was linearly modified as the doses increased. The increase in this ratio has been reported previously for different essential oils such as EUG, CIN and CAR (Macheboeuf et al., Reference Macheboeuf, Morgavi, Papon, Mousset and Arturo-Schaan2008; Mateos et al., Reference Mateos, Ranilla, Tejido, Saro, Kamel and Carro2013), whereas the lowered acetate to propionate ratio observed here for PTS and PTSO has been reported for different organosulphour compounds such as allicin, diallyl disulphide and allyl mercaptan (Hart et al., Reference Hart, Yáñez-Ruiz, Duval, McEwan and Newbold2008). This different effect on the fatty-acid profile might be a consequence of the distinct modes of action exhibited by each compound: essential oils seem to have a broader antimicrobial activity by affecting the membrane integrity and disturbing energy metabolism in the cell, wherea organosulphour compounds such as thiosulphinates specifically inhibit the growth of archaea by affecting the synthesis of their glycerol containing lipids in membranes (Busquet et al., Reference Busquet, Calsamiglia, Ferret, Carro and Kamel2005).
In Experiment 2, as discussed above, the selection of doses was made trying to cover the dosage window to maximize the effects without compromising overall fermentation. Contrary to what was observed in Experiment 1, none of the studied parameters exhibited significant diet–dose interaction. This might indicate that over short-term incubations (24 h), the effect of some compounds may be influenced by the rumen degradability of starch and protein sources; however, when the incubation lasts for 72 h this diet-dependent effect (including the gas production rate) is no longer apparent. The selection of the substrates in this work was made different: starch (barley v. maize) and protein (fava beans v. sunflower meal) sources differed in their degradability patterns in the rumen to test this hypothesis, as described previously (Newbold et al., Reference Newbold, McIntosh, Williams, Losa and Wallace2004; Duval et al., Reference Duval, McEwan, Graham, Wallace and Newbold2007). The lack of significant interaction might be owing to the fact that these ingredients are not the sole substrates but were used to formulate the concentrate of the diet that had the same forage (alfalfa hay). In that sense, it has been shown that it is the type of forage and the forage:concentrate ratio that are the main diet-related factors driving the effectiveness of antimethanogenic compounds (Castro-Montoya et al., Reference Castro-Montoya, De Campeneere, Van Ranst and Fievez2012). In the light of these results, a sole diet was used in the subsequent in vivo experiment, which included a concentrate that contained all starch and protein sources used in the in vitro experiment.
In Experiment 2, gas production was affected by all studied compounds (PTS, P=0.095); however, the values obtained for dose I were very close to control, or even numerically higher. This was also observed for the gas production rate and might suggest that at that level of dosage the fermentation was not compromised. Indeed, the DNDF was only significantly affected by CAR and PTS with a reduction of 28% in both cases, which is consistent with values reported using other garlic compounds and essential oils in vitro (Busquet et al., Reference Busquet, Calsamiglia, Ferret, Carro and Kamel2005). Although a possible overestimation of the in vitro method to estimate digestibility based on NDF residue has been reported (Getachew et al., Reference Getachew, Robinson, DePeters and Taylor2004), this method is accepted for comparative purposes; nevertheless, these results need to be confirmed in vivo in producing animals with faster passing digesta rates than the 72 h used in this in vitro assay.
The addition of CAR and CIN affected methane concentration, which is in agreement with Macheboeuf et al. (Reference Macheboeuf, Morgavi, Papon, Mousset and Arturo-Schaan2008) and Mateos et al. (Reference Mateos, Ranilla, Tejido, Saro, Kamel and Carro2013), who reported a linear decrease in methane production using similar compounds and doses. The addition of PTS and DDS inhibited methane emission up to 90% and 60%, respectively, which are comparable to values reported in other in vitro studies (Busquet et al., Reference Busquet, Calsamiglia, Ferret, Carro and Kamel2005; Soliva et al., Reference Soliva, Amelchanka, Duval and Kreuzer2011). Despite the methane reduction observed with the addition of PTS, DDS and BCM, only protozoal and archaeal abundances were affected by the highest dose of PTS and DDS, respectively, whereas the concentration of total bacteria remained unchanged for all treatments. A decrease in protozoa abundances in batch cultures was also observed by Kongmun et al. (Reference Kongmun, Wanapat, Pakdee and Navanukraw2010) when garlic powder was added. Similarly, in vivo results reported by Ohene-Adjei et al. (Reference Ohene-Adjei, Chaves, McAllister, Benchaar, Teather and Forster2008) showed that garlic oil did not affect the total number of methanogenic archaea in sheep as quantified by archaeal 16S rRNA gene copies. However, these authors showed an increased phylogenetic diversity of methanogenic archaea, which may have resulted from changes in associated protozoal species. The overall lack of effect on archaea concentration supports recent observations, which suggest that methanogenesis in the rumen depends, to a large extent, on the distribution of different archaea species rather than their absolute numbers (Zhou et al., Reference Zhou, Hernandez-Sanabria and Guan2010).
The results observed for PTS and DDS on rumen fermentation and methane production were similar to those observed when adding BCM, although the highest dose (320 µl/l) of PTS tended to negatively affect rumen fermentation.
Experiment 3 (in vivo)
On the basis of results obtained from Experiments 1 and 2, PTS was selected as the compound to be tested with BCM as the positive control. The doses used were 50, 100 and 200 mg/l rumen content for PTS that were within the dosage range needed to decrease methane production but below the high dose tested in vitro (320 µl/l) that potentially may compromise rumen fermentation. Although in vitro and in vivo experiments were not run in parallel with the same rumen samples and animals in this study, they were sequentially designed using the same diets, type of animals, compounds and same positive control (BCM). This may allow in vitro v. in vivo comparison of effectiveness in methane inhibition. Methane emissions measured in vivo (l/kg DMI) decreased over 33% with PTS at the highest dose (200 mg/l). This is equivalent to the reduction (27%) observed in vitro with the dose of 160 µl/l and far less than the reduction (87%) achieved with a dose of 320 µl/l in vitro. In contrast, the reduction observed with BCM in vivo (34% to 64%) was not as high as that obtained in vitro (96%); however, it was similar to the decrease (30%) achieved in our group with dairy goats treated over 2 months using the same compound and similar dosage (Abecia et al., Reference Abecia, Toral, Martín-García, Martínez, Tomkins, Molina-Alcaide, Newbold and Yáñez-Ruiz2012). Similar differences between in vitro and in vivo studies have been observed by Mohammed et al. (Reference Mohammed, Ajisaka, Lila, Hara, Mikuni, Hara, Kanda and Itabashi2004) using Japanese horseradish oil, who reported substantially greater inhibitions of methane production in vitro (89%) than in vivo (18.7%). The disagreement in the effectiveness observed between results obtained in vitro and in vivo with the same doses strongly supports the need for testing in vivo what it is previously observed in vitro and may be explained by a number of factors: (i) the compounds used in this study had very low solubility in water, and therefore the homogenous distribution across the rumen compartments might have not been fully achieved; (ii) the degradation rate of the compounds may differ in vitro and in vivo; and (iii) there is a reported decrease in microbial densities and changes in bacterial community structure when rumen content is processed before inoculation in vitro, which could be attributed to the exposure of microorganisms to oxygen and the discard of the main part of solids during the filtration process (Soto et al., Reference Soto, Yáñez-Ruiz, Cantalapiedra-Hijar, Vivas and Molina-Alcaide2012). In addition, the direct extrapolation of concentrations from in vitro to in vivo did not take into account the rumen outflow, which in our conditions, with animals fed restricted intake, was estimated to be around 3%/h (Yáñez-Ruiz et al., Reference Yáñez-Ruiz, Moumen, Martin Garcia and Molina Alcaide2004). This would require an increase in the daily dosage of about 80% in vivo in comparison with the dose used in in vitro conditions and would explain the proportionally lower reduction achieved in vivo as compared with in vitro.
The pattern of methane emissions throughout the day reveals a distinctive pattern that consists of larger differences between treatments over the first 5 h after the morning feeding, and then they gradually came closer towards the end of the day. This distinct pattern between control and effective treatments agrees with Thornton and Owens (Reference Thornton and Owens1981), who using monensin in steers observed that inhibition of methane production declined with time postprandially. However, in our case, the effective treatment of BCM (dose 100 and 160 mg/l rumen content) showed a slight recovery towards the end of the day. This raises the question of the difficulty of achieving a sustained anti-methanogenic activity in the rumen throughout the day. In the case of BCM, cyclodextrin was used as an encapsulating material aiming at reducing the volatile nature of the ingredient; however, it is likely that the use of two ‘shots’ in this study may have diminished the potential methane reduction effect as compared with a more homogeneous application if the additive was completely mixed with the diet.
With regard to intakes, the highest dose of PTS (200 mg/l) showed a numerical reduction in DMI (478 v. 601 g/day) that was not observed with BCM. These data need to be taken with caution, given that the animals had been adapting to the treatment for only 7 days, and therefore it cannot be considered as a conventional intake experiment. The literature shows that the effect of garlic-derived compounds on feed intake is rather variable. Yang et al. (Reference Yang, Benchaar, Ametaj, Chaves, He and McAllister2007) did not observe detrimental effects of garlic oil on daily intakes by growing lambs and dairy cows, whereas Patra and Saxena (Reference Patra and Saxena2010) reported that the addition of garlic bulb (10 g/kg DM intake) to a concentrate mixture reduced its intake for the initial 10 to 15 days in buffaloes and sheep probably because of the pungent smell of garlic oil. Once animals were adapted to garlic, feed intake was not affected. In this study, we attempted to confirm in vivo the results obtained in vitro using short-term (9 days) treatments. This has the advantage of allowing the study of different levels of inclusion, and once an optimum dosage is identified longer treatment periods should be used.
In conclusion, the results obtained in this work suggest that applying in vivo the same dosage as used in vitro in relation to rumen volume results in a proportional lower extent of methane inhibition. This may be related to the lack of homogenous distribution of compounds within the rumen, lower microbial concentration in vitro than in vivo and to the higher dilution rate in vivo compared with in vitro conditions. Of the compounds tested here, PTS at doses between 50 and 200 mg/l of rumen contents has the potential to reduce methane emissions in goats. Whether the reduction in methane observed in vivo persists over longer periods of treatments and improves feed conversion efficiency requires further research.
Acknowledgements
This research was supported by the Science and Innovation Spanish Ministry (Project AGL2008-04707-C02-01). The authors acknowledge J. Fernández, T. García, E. Jiménez, I. Jiménez and F. Ramos-Morales for their technical assistance, P. Frutos for constructive criticism of design and analysis, and DMC Research Center S.L. for providing PTS and PTSO. G. Martínez gratefully acknowledges the FPI grant from the Spanish Science Ministry.