



1. Introduction
A starting jet is defined as the transient flow development produced by the sudden ejection of a fluid column into a quiescent environment. It can either evolve into a steady jet if there is continuous discharge of fluid from the source or produce a single jet pulse with finite discharged volume. For the former, the starting jet can be taken as the initial stage of a continuous steady jet. For the latter, the starting jet with finite discharged volume is equivalent to a single-pulsed jet, which can be regarded as the fundamental unit of a continuously pulsed jet (or denoted as a pulsed jet for short).
A starting jet is used commonly in nature as a basic component in a variety of unsteady flows for effective mass and momentum transport. This unsteady mechanism is observed in the locomotion patterns of several aquatic creatures, such as squid (Anderson & DeMont Reference Anderson and DeMont2000; Bartol et al. Reference Bartol, Krueger, Stewart and Thompson2009, Reference Bartol, Krueger, Jastrebsky, Williams and Thompson2016), jellyfish (Daniel Reference Daniel1983; Dabiri et al. Reference Dabiri, Colin, Costello and Gharib2005; Dabiri, Colin & Costello Reference Dabiri, Colin and Costello2006), siphonophores (Costello et al. Reference Costello, Colin, Gemmell, Dabiri and Sutherland2015) and salps (Sutherland & Madin Reference Sutherland and Madin2010; Sutherland & Weihs Reference Sutherland and Weihs2017). Research on biological jet propulsion has focused largely on the time-averaged thrust and efficiency, identifying techniques by which animals optimize jet behaviour for different locomotion tasks (Dabiri et al. Reference Dabiri, Colin, Katija and Costello2010; Sutherland & Madin Reference Sutherland and Madin2010). The earlier theoretical study of Weihs (Reference Weihs1977) suggested the significance of the vortical wake evolution to the production of impulse and thrust by a pulsed jet. It is now well established that an unsteady pulsed jet and the associated vortex formation are capable of boosting thrust generation (Krueger & Gharib Reference Krueger and Gharib2003, Reference Krueger and Gharib2005) and increasing propulsive efficiency (Moslemi & Krueger Reference Moslemi and Krueger2010; Ruiz, Whittlesey & Dabiri Reference Ruiz, Whittlesey and Dabiri2011), relative to an equivalent steady jet. All these studies imply the significance of vortex ring formation on the performance of jet-based propulsive devices. Since the short-duration starting jet is equivalent to the formation of a single vortex ring, it would serve as a fundamental framework for the study of effects of vortex ring formation on the production of propulsive quantities in a pulsed jet.
On a more fundamental level, the formation process of the leading vortex ring by a starting jet is found to affect remarkably impulse and thrust generation. Recently, Kreuger & Gharib (Reference Krueger and Gharib2003) suggested that the vortex ring formation at the initial jet discharge increases the local pressure at the exit of the propulsor to above the ambient pressure in the free stream, and in turn augments the generated thrust. The need for over pressure is associated with the acceleration of additional fluid during the initial jet ejection, which conceptually consists of two components, i.e. the entrained ambient fluid and the added mass. The vortex formation process has also been observed to augment entrainment of ambient fluid in the wake of the propulsor (Dabiri & Gharib Reference Dabiri and Gharib2004; Olcay & Krueger Reference Olcay and Krueger2008). The effect of augmented entrainment is to increase propulsive efficiency by reducing the magnitude of kinetic energy losses in the wake. Ruiz et al. (Reference Ruiz, Whittlesey and Dabiri2011) concluded that the nozzle exit over pressure and vortex ring entrainment are responsible for the advantages of the pulsed jet in propulsive applications.
Particular emphasis has been placed on understanding of the evolution of the local pressure field near the jet exit due to its dominant role as the direct origin of the thrust boost associated with starting jets. An analytical model for jet exit pressure distribution was derived by Krueger (Reference Krueger2001), using a potential flow approximation in a control volume surrounding the vortical wake of the starting jet. Krige & Mohseni (Reference Krige and Mohseni2013) showed that the pressure of any unsteady axisymmetric jet can be determined solely by the jet kinematics (i.e. the axial and radial velocity distribution and evolution) at the jet exit. For rapidly initiated jets, Krueger (Reference Krueger2001, Reference Krueger2005) thus obtained analytically the initial over pressure at the exit boundary by equating the starting jet flow to the potential flow in front of a translating circular disk. It is noted that this approximation of potential flow oversimplified the initial vortex ring formation process by neglecting the growth of the vortex ring diameter and the ambient fluid entrainment. According to the potential flow model, the over pressure during the initial jet ejection can also be related to the curvature of streamlines at its exit plane, corresponding to radial acceleration of the ambient fluid in front of the jet exit (Athanassiadis & Hart Reference Athanassiadis and Hart2016).
Although the vortex ring formation is regarded as the key dominant feature of an unsteady pulsed jet, there is, to the authors’ knowledge, no direct evidence on the relationship between the instantaneous jet exit pressure variation and the vortex ring formation process. The contribution of pressure variation during the jet termination and associated vortex formation are also not considered in previous studies. For instance, the previous study of Krueger & Gharib (Reference Krueger and Gharib2003) was based on the propulsive quantities per jet pulse as a function of the jet stroke length-to-diameter ratio  $({L_m}/D)$, rather than the transient variation of the pressure impulse during jet development. Conversely, James & Madnia (Reference James and Madnia1996) and Jiang & Grosenbaugh (Reference Jiang and Grosenbaugh2006) delved into the transient evolution of the impulse and thrust generation of a starting jet. Thus, their analysis and conclusion should serve as an indirect answer to the underlying relationship between thrust augmentation and the vortex ring formation process. Moreover, the initial over pressure of a starting jet is found to be dependent on the rapid acceleration of the discharged fluid in the analytical model of Krueger (Reference Krueger2005). It is interesting to note that this model actually neglects the vortex ring formation under an appropriate potential flow approximation. Therefore, it is worth investigating further the transient development of propulsive quantities in order to illuminate the contribution of the vortex ring formation to the advantages of unsteady jet propulsion, which is highly relevant to the optimization of unsteady propulsive devices.
In this study, we intend to clarify the physical mechanisms in the starting jet responsible for the propulsive benefits achieved by the flow unsteadiness, by means of examining the detailed development of the thrust and impulse during the initial vortex ring formation process. We re-examine the relationship between vortex ring formation and the impulse supplied to the flow by individual starting jets, which was discussed previously in Krueger & Gharib (Reference Krueger and Gharib2003). The starting jet with finite fluid discharged can serve as a simplified model of a pulsed jet for elucidating the connection between the local pressure field evolution at the jet exit and the development of the vortex-dominated wake structure.
The paper is organized as follows. The physical problem description and the numerical methods are introduced in § 2. In § 3, the evolution of the propulsive characteristics of the starting jet with different generation conditions is presented. This is followed by a discussion of the effects of the near-wake dynamics on the pressure impulse at the jet exit plane as well as the effects of jet generation conditions on the overall propulsive performance. The paper ends with brief concluding remarks in § 4.
2. Problem description and numerical method
The starting jet with finite fluid discharged was simulated using the domain geometry sketched in figure 1. Since axisymmetric flow is assumed, the domain is shown in the  $x\mbox{--}r$ plane. Its dimensions were chosen as
 $19D$ in the axial direction (with the jet exit plane located at
 $4D$ downstream of the upstream boundary) and
 $5D$ in the radial direction, where
 $D = 2\;\textrm{cm}$ is the diameter of the nozzle exit. Previous numerical studies (Olcay & Krueger Reference Olcay and Krueger2010; Gao & Yu Reference Gao and Yu2016) have verified that the axial and radial dimensions of the domain are sufficiently large to ensure that the outer boundary conditions do not influence the flow evolution. The motion of a piston was modelled by specifying a time-dependent uniform velocity
 ${U_0}(t)$ on the nozzle inlet plane
 $(x/D ={-} 4,\textrm{ }0 \le r/D \le 0.5)$ as the velocity inlet boundary condition. The no-slip condition was enforced on the nozzle wall boundary
 $( - 4 \le x/D \le 0,\; \textrm{ }r/D = 0.5)$ with zero thickness. For the far-field boundaries, the pressure outlet condition (which prescribes the static (gauge) pressure of zero at the outlet boundary) was specified that allows backflow at the far field, which is the case for the radial far-field boundaries.
Schematics of computational domain and boundary conditions for the starting jet flow simulation.

The evolution of the starting jet was determined by solving the unsteady, incompressible, axisymmetric and laminar Navier–Stokes equations using the finite-volume technique implemented by the computational fluid dynamics package ANSYS Fluent 15.0. Second-order-accurate temporal and spatial schemes have been used with pressure implicit with splitting of operators (PISO) pressure–velocity coupling. MATLAB routines developed in-house were used to conduct post-processing of the numerical results for the quantities associated with the propulsive performance and flow dynamics. The domain was discretized using a non-uniform rectangular grid of  $399 \times 99$ nodes, with the greatest node density near the nozzle exit plane and the shear layer region in order to resolve the areas of large velocity gradient. To assess the grid independence, the hydrodynamic impulse
 ${I_h}$, which is of great interest in the present study and is given by (3.2) below, was computed for the starting jet case 20 (see table 1) using three grids with nodal dimensions of
 $299 \times 79$,
 $399 \times 99$ and
 $599 \times 149$. Comparing
 ${I_h}$ for the three grids exhibits less than 1 % difference between the two finest grids. Thus, the
 $399 \times 99$ grid was used to obtain the results for this investigation. Similarly, for the temporal convergence study, the evolution of the hydrodynamic impulse was also calculated using three constant time steps, i.e.
 $\Delta t = 2 \times {10^{ - 3}}\;\textrm{s}$,
 $1 \times {10^{ - 3}}\;\textrm{s}$ and
 $0.5 \times {10^{ - 3}}\;\textrm{s}$. The discrepancy in the hydrodynamic impulse between the smallest time steps was lower than 1 % and, therefore, the fixed time step of
 $\Delta t = 1 \times {10^{ - 3}}\;\textrm{s}$ was selected.
Summary of simulation parameters for the starting jet with different velocity programmes and stroke ratios.

Similar to the piston–cylinder apparatus for starting jet generation, the time-dependent, mean jet velocity at the nozzle exit  ${U_0}(t)$ is defined as the velocity programme. In the present numerical simulation, the functional form of the velocity programme, which is prescribed at the velocity inlet boundary, is given by
 \begin{align}\frac{{{U_0}(t)}}{{{U_m}}} = \begin{cases}{\dfrac{t}{{{T_a}}} - \dfrac{1}{{2\pi}}\sin \dfrac{{2\pi t}}{{{T_a}}}}&{(t \le {T_a}),}\\ 1&{({T_a} \lt t \le {T_a} + {T_c}),}\\ {\dfrac{{{T_0} - t}}{{{T_d}}} + \dfrac{1}{{2\pi}}\sin \left[ {\dfrac{{2\pi}}{{{T_d}}}(t - {T_a} - {T_c})} \right]}&{({T_a} + {T_c} \lt t \le {T_0}),}\\ 0&{(t \gt {T_0}),} \end{cases}\end{align}
where  ${U_m} = 0.1\;\textrm{m}\,{\textrm{s}^{ - 1}}$ is the maximum jet velocity,
 ${T_a}$,
 ${T_c}$ and
 ${T_d}$ are the acceleration period, constant-velocity period and deceleration period, respectively, and
 ${T_0} = {T_a} + {T_c} + {T_d}$ is the total jet period. For the starting jet with finite fluid discharged, another critical parameter is the jet stroke ratio
 ${L_m}/D$, which is defined as ratio of the total stroke length of a starting jet to the jet exit diameter, i.e.
 \begin{equation}{L_m} = \int_0^{{T_0}} {{U_0}(t)\,\textrm{d}t} .\end{equation}
In order to investigate the effects of jet acceleration features as well as the jet stroke ratio, three types of velocity programme, i.e. variable acceleration and deceleration (VAD), fast acceleration and deceleration (FAD) and fast acceleration and slow deceleration (FASD), were adopted in the present study, with the stroke ratio in the range of  $1.5 \lt {L_m}/D \lt 8$. As shown in figure 2, the VAD velocity programme is characterized by the symmetric increasing and decreasing of the jet velocity, with no constant-velocity period, while the FAD and FASD velocity programmes are defined by the fixed acceleration and deceleration periods (
 ${T_a}{U_m}/D = {T_d}{U_m}/D = 0.5$ for FAD and
 ${T_a}{U_m}/D = 0.5,\; \textrm{ }{T_d}{U_m}/D = 2.5\; $ for FASD) with variable constant-velocity periods for different stroke ratios. It is noted that, similar to the triangular velocity programmes used in Krueger & Gharib (Reference Krueger and Gharib2003) and Olcay & Krueger (Reference Olcay and Krueger2008, Reference Olcay and Krueger2010), the acceleration magnitudes of VAD velocity programmes would decrease as
 ${L_m}/D$ (or equivalently
 ${T_0}$) increases. In order to examine the effects of the jet acceleration and the jet stroke ratio independently, the FAD and FASD velocity programmes were introduced in the present study, in which the acceleration magnitudes are fixed, and the constant-velocity period is elongated for larger stroke ratio. Accordingly, the effect of jet stroke ratio, which is closely related to the vortex ring formation process, on the impulse and thrust generation can be considered exclusively. In addition, throughout the present numerical simulations, liquid water was considered as the working fluid, with the density of
 $\rho = 998.2\;\textrm{kg}\,{\textrm{m}^{ - 3}}$ and the kinematic viscosity of
 $\nu = 1.01 \times {10^{ - 6}}\;{\textrm{m}^2}\,{\textrm{s}^{ - 1}}$. Therefore, the jet Reynolds number, defined as
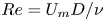 $Re = {U_m}D/\nu $, is set to be a constant of 2000. A summary of the flow parameters for the cases explored here is presented in table 1.
Jet velocity programmes for the cases with  ${L_m}/D = 2$. ‘FAD’ indicates the fast acceleration and deceleration velocity programme; ‘VAD’ indicates the variable acceleration and deceleration velocity programme; and ‘FAD’ indicates the fast acceleration and slow deceleration velocity programme.

3. Numerical results and discussion
3.1. Evolution of propulsive quantities of the starting jet
Before dwelling on the effects of unsteady vortex ring formation on the propulsive characteristics of the starting jet, we first examine the temporal variation of the propulsive quantities of the starting jet in different flow conditions. To understand the effect of stroke ratio and velocity programme on the overall propulsive performance, the hydrodynamic impulse of the starting jet is calculated from the velocity and vorticity field in its wake as
 \begin{equation}{\boldsymbol{I}_h} = \frac{1}{2}\rho \int {\boldsymbol{x} \times \boldsymbol{\omega }\,\textrm{d}V}. \end{equation}
In an unbounded fluid with confined vortical region, the rate of change of the hydrodynamic impulse is equal to the total non-conservative body forces acting on the fluid (Saffman Reference Saffman1992). Therefore, the hydrodynamic impulse can be considered as the total mechanical impulse required to generate the flow from rest. In the case of axisymmetric flow, the x-component of the hydrodynamic impulse can be expressed as
 \begin{equation}{I_h} = \pi \rho \int_0^\infty {\int_{ - \infty }^\infty {{\omega _\theta }{r^2}\,\textrm{d}x\,\textrm{d}r} } = {I_j},\end{equation}
where  ${\omega _\theta }$ is the azimuthal component of vorticity and
 ${I_j}$ is the total mechanical impulse of the starting jet. In an infinite domain, and in the absence of external forces, the hydrodynamic impulse is invariant even in the presence of viscosity (Batchelor Reference Batchelor1967; Saffman Reference Saffman1992).
The temporal variation of the hydrodynamic impulse, normalized by  ${I_0} = \rho A{U_m}{L_m}$, versus the dimensionless formation time
 ${t^\ast }$ (
 ${t^\ast } = \overline {{U_0}(t)} t/D$, where
 $\overline {{U_0}(t)} $ is the running average of the jet velocity) is shown in figure 3. Note that
 ${I_0}$ is not a constant but a function of the jet stroke ratio. It can be observed that the transient development of the hydrodynamic impulse exhibits distinctive features for the three stages of jet ejection. At jet initiation
 $(t \lt {T_a})$, there is an abrupt increase in the hydrodynamic impulse, indicating large thrust generated during jet acceleration. Afterwards
 $({T_a} \le t \le {T_a} + {T_c})$, it increases almost linearly with the formation time due to the constant momentum flux through the jet exit during this stage. When the jet enters deceleration
 $({T_a} + {T_c} \lt t \le {T_0})$, there is a slight drop in the hydrodynamic impulse, which should correspond to the negative thrust at the end of the jetting. After the jet is shut off
 $(t \gt {T_0})$, a gradual recovery of its value can be observed following this sudden drop. James & Madnia (Reference James and Madnia1996) were the first to report the evolution of impulse during the vortex ring formation process in a starting jet. Using a velocity programme similar to FAD in the current study, they found that, after the jet is shut off, the impulse initially decreases and then increases at a very slow rate.
Temporal variation of the normalized hydrodynamic impulse against the formation time for the three velocity programme cases at (a)  ${L_m}/D = 1.5$, (b)
 ${L_m}/D = 2$, (c)
 ${L_m}/D = 4$ and (d)
 ${L_m}/D = 6$.

Although the general trends are similar, the evolution of the hydrodynamic impulse will be affected quantitatively by the type of the velocity programme. It is apparent by comparing the FAD and FASD cases with the VAD cases that the more rapid flow acceleration would result in a greater initial rise of the hydrodynamic impulse. The results of Krueger & Gharib (Reference Krueger and Gharib2003) indicate that the impulse supplied by over pressure decreases as the jet is initiated more gradually. Similarly, the more rapid flow deceleration corresponds to a greater and more sudden drop in the hydrodynamic impulse at the jet termination. No previous studies have highlighted the influence of jet deceleration on the impulse delivered by the starting jet into its near wake. The current results indicate that a rapidly decelerated velocity programme provides higher total hydrodynamic impulse to the starting jet wake, given that all the other generating conditions are identical. Owing to their fast acceleration and deceleration feature, the FAD cases produce the largest total hydrodynamic impulse in total, while the VAD cases have the lowest hydrodynamic impulse due to their slow acceleration and deceleration behaviours.
Based on the control volume analysis of the fluid region external to the jet generator by Krueger & Gharib (Reference Krueger and Gharib2003), the total jet impulse  ${I_j}$ can be decomposed into two parts, i.e. the impulse due to the momentum flux
 ${I_u}$ and the pressure impulse
 ${I_p}$, as
 \begin{align}{I_j}(t) &= {I_u}(t) + {I_p}(t),\end{align}
 \begin{align}{I_u}(t) &= \rho \int_0^t {\int_A {u_0^2(r,\tau )\,\textrm{d}S\,\textrm{d}\tau } } ,\end{align}
 \begin{align}{I_p}(t) &= \int_0^t {\int_A {[{p_0}(r,\tau ) - {p_\infty }]} \,\textrm{d}S\,\textrm{d}\tau } ,\end{align}
where A is the cross-sectional area of the nozzle exit,  ${p_\infty }$ is the ambient pressure at infinity, and
 ${u_0}(r,t)$ and
 ${p_0}(r,t)$ are the axial velocity and pressure at the nozzle exit plane, respectively. The results for
 ${I_u}$ and
 ${I_p}$ can thus be determined from the velocity and pressure data obtained by the current numerical simulation.
The evolution of the normalized total jet impulse as well as its two components for the cases with the FAD velocity programme is shown in figure 4. The results of the hydrodynamic impulse are also included for comparison. It is shown that the total jet impulse produced by the starting flow is almost identical to the hydrodynamic impulse in the jet wake. The quantitative match between  ${I_h}$ and
 ${I_j}$ suggests that the rate of momentum discharged and the pressure force at the jet exit plane can be regarded as non-conservative forces to generate the total starting flow. It is also observed that
 ${I_p}$ is significant only during the jet initiation, implying the short-lasting period of the nozzle exit over pressure effect (Krueger & Gharib Reference Krueger and Gharib2003), while
 ${I_u}$ increases almost linearly with
 ${t^\ast }$ and becomes greater than
 ${I_p}$ shortly after the initial acceleration stage.
The evolution of various impulse quantities for the cases with FAD velocity programme at (a)  ${L_m}/D = 2$ and (b)
 ${L_m}/D = 6$. The blue dash-dotted reference lines indicate the growth rate of
 ${I_u}$ from the slug model.

Using the slug model, which assumes that the fluid is ejected with a uniform axial velocity and no radial velocity (Glezer Reference Glezer1988; Shariff & Leonard Reference Shariff and Leonard1992), as well as with an impulsively started velocity programme (Krueger Reference Krueger2005), i.e.  ${T_a} \to 0$, the impulse due to the axial momentum flux can be simplified to
 ${I_u} = \rho AD{U_m}{t^\ast }$. It accounts for the approximately linear growth of
 ${I_u}$ with
 ${t^\ast }$, especially during the constant-velocity stage. Moreover, it is well established that the axial velocity distribution on the nozzle exit plane, usually dubbed as the velocity profile, is non-uniform and evolves with time under the influence of the growth of the boundary layer on the cylinder wall (Didden Reference Didden1979; Rosenfeld, Rambod & Gharib Reference Rosenfeld, Rambod and Gharib1998; Shusser et al. Reference Shusser, Gharib, Rosenfeld and Mohseni2002; Rosenfeld, Katija & Dabiri Reference Rosenfeld, Katija and Dabiri2009). The development of the velocity profile would lead to a higher increase rate of
 ${I_u}$ over the slug model prediction. During the jet termination, the sudden drop in the hydrodynamic impulse is found to be associated exclusively with the rapid decrease in
 ${I_p}$, which counteracts to some extent the initial over pressure contribution and reduces remarkably the pressure impulse per jet pulse. As a result,
 ${I_p}$ is generally one order of magnitude smaller than
 ${I_u}$ when the jet is stopped. It is also surprising to notice that the pressure impulse after the jet termination becomes negative for the small stroke ratio case, as shown in figure 4(a), implying that the pressure impulse actually serves to reduce the total momentum of the starting jet flow. The present results highlight the adverse influence of the pressure term during the jet termination, which has not yet been reported in previous studies.
To further explore the effect of the unsteady behaviour of the jet velocity on the pressure contribution to the total jet impulse, we focus on the transient development of the pressure force and pressure impulse for cases with different velocity programmes. The pressure force  ${f_p}$ is obtained by differentiating
 ${I_p}(t)$ using a first-order central difference scheme with second-order accuracy. The results for the pressure force and impulse for the cases with
 ${L_m}/D = 2$ and 6 are presented in figure 5. The pressure force is normalized by
 ${f_0} = \rho AU_m^2$ and the pressure impulse is normalized by
 ${I_{0\_1}} = {f_0}D/{U_m}$, which is not dependent on the stroke ratio, for a better comparison between the cases with
 ${L_m}/D = 2$ and 6. It is observed that the generation of pressure force is found to be associated primarily with the magnitudes of the acceleration and deceleration of the jet velocity. As shown in figure 5(a,c),
 ${f_p}$ increases rapidly due to the initial pressure rise at the nozzle exit for the FAD and FASD cases with the fast acceleration. This over pressure effect has also been identified by Krueger (Reference Krueger2005) to provide a significant contribution to the total circulation of a starting jet. Under the influence of a slower acceleration, the initial growth of
 ${f_p}$ is proportionally weaker for the VAD velocity programme. After its initial growth,
 ${f_p}$ drops rapidly to a negative value near the end of the acceleration stage, which corresponds to the decrease in the pressure impulse after its peak as shown in figure 5(b,d).
Evolution of thrust and impulse due to pressure contribution as functions of the formation number: (a)  ${f_p}$ for the cases with
 ${L_m}/D = 2$, (b)
 ${I_p}$ for the cases with
 ${L_m}/D = 2$, (c)
 ${f_p}$ for the cases with
 ${L_m}/D = 6$, and (d)
 ${I_p}$ for the cases with
 ${L_m}/D = 6$.

The evolution of the pressure thrust and impulse after the initial stage is found to be dependent on the jet stroke ratio. For the large  ${L_m}/D$ cases as shown in figure 5(c), the pressure force gradually recovers from a negative value to approximately zero as the jet proceeds. It indicates that the initial over pressure contribution becomes negligible for the large formation time until the jet starts to decelerate. Specifically,
 ${f_p}$ for the FAD and FASD cases is nearly zero for
 ${t^\ast } \gt 2$. If the jet terminates at sufficiently large formation time that the initial pressure variation disappears,
 ${f_p}$ during the jet deceleration drops suddenly to its negative peak, followed by rapid recovery to a slightly positive value. The negative peak value of
 ${f_p}$ is observed to be proportional to the jet deceleration magnitude. Therefore, the slower deceleration process for the FASD case results in a milder decrease in
 ${I_p}$, which in turn leads to higher
 ${I_p}$ than the FAD case after the jet is stopped. On the other hand, for the small
 ${L_m}/D$ cases, the recovery of
 ${f_p}$ from the negative minimum after its initial peak is affected by the jet deceleration process. This feature can be illustrated distinctively by comparing the
 ${f_p}$ results for the FASD cases with
 ${L_m}/D = 2$ and 6. As shown in figure 5(a),
 ${f_p}$ of case 16 is still negative when the jet starts to decelerate at
 ${t^\ast } \approx 1$. However, for case 21 as shown in figure 5(c),
 ${f_p}$ has approached approximately zero when the jet deceleration begins at
 ${t^\ast } \approx 5$. Therefore, under the combined influence of the jet deceleration and the residual negative pressure thrust associated with the jet initiation, the starting jet with small
 ${L_m}/D$ would experience greater decrease in
 ${I_p}$ during the jet termination than the large
 ${L_m}/D$ cases, even though the deceleration magnitudes of the two cases are identical. The influence of the initial pressure variation on the jet deceleration process is also identified to be responsible for the negative pressure impulse after jet termination for case 9 with the FAD velocity programme and
 ${L_m}/D = 2$. Besides the recognition of the significance of pressure rise and fall related to the magnitude of the initial acceleration and final deceleration, respectively, the present study suggests that the overall pressure impulse produced by a starting jet should also be dependent on the maximum stroke ratio.
According to the preceding analysis on the transient characteristics of the pressure force and impulse under various jet generation conditions, one can conjecture that, at the same Reynolds number, the FASD velocity programme and sufficiently large stroke ratio should be capable of generating larger final pressure impulse. For all cases tested in the present study, the final pressure impulse per jet as a function of the stroke ratio  ${L_m}/D$ is presented in figure 6(a) and the significance of the pressure impulse is illustrated in figure 6(b), where the fraction of
 ${I_j}$ contributed by
 ${I_p}$ is plotted. Note that the result of
 ${I_p}$ at sufficiently large formation time
 $({t^\ast } = 12)$ is adopted as the value of pressure impulse per jet, given that
 ${I_p}$ generally remains constant after the influence of jet termination disappears.
The variation of (a) the pressure impulse per pulse and (b) the percentage of pressure impulse in the jet impulse as functions of jet stroke ratio  ${L_m}/D$ for the three velocity programmes. The red dashed line indicates the line of zero total pressure impulse.

As shown in figure 6(a), the result of  ${I_p}$ per jet verifies the proposed strategy for generating greater pressure impulse by a starting jet. It is seen that
 ${I_p}$ for the FASD velocity programme is greater than the other two velocity programmes. As
 ${L_m}/D$ increases,
 ${I_p}$ first increases quickly for small
 ${L_m}/D$ and gradually approaches a constant value for sufficiently large
 ${L_m}/D$. A similar variation against
 ${L_m}/D$ can also be observed for the FAD velocity programme, where
 ${I_p}$ rises from a negative value to nearly zero as
 ${L_m}/D$ increases. Given the identical initial acceleration between the FASD and FAD velocity programmes, it is realized that the upward translational displacement of the
 ${I_p}$ curve for the FASD cases relative to that for the FAD ones should be attributed to the slower deceleration in the FASD velocity programme. A distinct feature for the VAD cases is the slight decline of
 ${I_p}$ after reaching a maximum at around
 ${L_m}/D = 3$. This is understandable by considering that, according to the characteristics of its velocity programme, the magnitude of acceleration and deceleration of the VAD cases diminishes as
 ${L_m}/D$ increases. In addition, the
 ${I_p}/{I_j}$ results shown in figure 6(b) suggest that, even though the FASD cases have the highest pressure impulse among the three cases, its pressure impulse accounts for no more than 4 % of the total impulse supplied by the jet generator. The decrease of its fraction in the total impulse for
 ${L_m}/D \gt 2$ is mainly ascribed to the increase of
 ${I_u}$ with the stroke ratio.
Based on the transient development of the pressure force and impulse for the starting jets under different flow conditions, it is realized that, besides the well-known over pressure effect at jet initiation, the pressure drop at the nozzle exit during jet termination plays a comparably significant but negative role in the pressure impulse production. In addition, the negative-pressure field at the jet exit following the initial over pressure is found to degrade further the pressure drop during jet termination, especially for the small stroke ratio cases. Therefore, in order to enhance the pressure impulse production of the starting jet with finite fluid discharged, it is desirable to adopt the FASD velocity programme with a sufficiently large stroke ratio.
3.2. Effects of the unsteady wake dynamics on pressure impulse
The preceding results and discussion provide detailed knowledge of the pressure impulse evolution during the entire time history of the starting jet as well as the effects of jet generating conditions, i.e. the type of velocity programme and the jet stroke ratio, on the pressure impulse production. With an improved understanding of the transient pressure impulse characteristics over the previous results based on the per-pulse quantities (Krueger & Gharib Reference Krueger and Gharib2003), it is of fundamental and practical importance to explore further the physical mechanisms for the pressure thrust and impulse production in a starting jet, in terms of the unsteady vortex dynamics in its near wake.
Although the formation dynamics of the leading vortex ring in starting jets has been studied extensively, very few efforts exist on the characteristics of the stopping vortex during jet termination. We first examine the transient development of the coherent vortical structures in the jet wake under different flow conditions, with emphasis on the period after the jet is shut off. The evolution of the contours of the azimuthal vorticity  ${\omega _\theta }$ for starting jets with FAD and FASD velocity programmes and
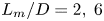 ${L_m}/D = 2,\; 6$ is presented in figure 7. During the constant-velocity period, there is steady discharge of vorticity in the separated shear layer from the nozzle edge. As the jet begins to shut off, a stopping vortex with opposite-signed vorticity develops near the nozzle exit plane. It is found by comparing the stopping vortex development for the two velocity programmes at the same stroke ratios that the abrupt halt of the jet for the FAD cases leads to a stronger stopping vortex (in terms of its size and circulation) than the FASD cases with gentler jet deceleration. This can be discerned distinctly from the middle plots in figure 7(a–d), which exhibit the vorticity contours at the moment immediately after the jet is shut off completely.
Vorticity contours for cases (a) with FAD velocity programme and  ${L_m}/D = 2$, (b) with FASD velocity programme and
 ${L_m}/D = 2$, (c) with FAD velocity programme and
 ${L_m}/D = 6$, and (d) with FASD velocity programme and
 ${L_m}/D = 6$. The blue solid lines indicate the positive-vorticity contours and red dashed lines indicate the negative-vorticity contours. The thick black lines indicate the nozzle wall.

Another significant feature that can be revealed by the vorticity contours is the influence of the jet termination process on the dynamics of the leading vortex ring, especially for small stroke ratio cases. This effect can be appreciated by comparing the translational dynamics of the vortex ring between the FAD and FASD cases with  ${L_m}/D = 2$, as shown in the lower plots in figure 7(a,b). Given that the FAD and FASD velocity programmes differ only in the final jet deceleration period, one can speculate that the longer time the leading vortex ring takes to reach the same axial position of
 $x/D = 4$ by the FASD velocity programme than by the FAD velocity should be attributed to the earlier and longer jet deceleration for the FASD case. The experimental results of Didden (Reference Didden1979) also suggests that for a starting jet with a stroke ratio of
 ${L_m}/D = 1.4$, the induced flow of the stopping vortex ring contributes partly to a decrease of the leading vortex ring diameter. In contrast, the leading vortex rings for the two cases with
 ${L_m}/D = 6$ exhibit almost identical translational velocity as shown in figure 7(c,d), implying that the different jet deceleration process has an insignificant effect on the dynamics of the leading vortex ring.
Based on the vorticity contours analysis, it is realized that the formation and development of the leading vortex ring at jet onset and the stopping vortex at jet termination would be the two significant flow structures affecting the pressure impulse development at the nozzle exit plane. During the initial acceleration stage, the local pressure distribution could be manipulated dramatically due to the proximity of the forming leading vortex ring to the nozzle exit plane. The evolution of the pressure field around the nozzle exit at the end of the jet acceleration stage is presented in figure 8, for the fast acceleration cases (i.e. the FAD and FASD velocity programmes in the present study). During the initial acceleration stage  $({t^\ast } = 0.153)$, there is strong over pressure at the nozzle exit, as indicated by the positive-pressure contours with great favourable pressure gradient inside the nozzle and immediately downstream of its exit plane. However, it is interesting to note that there exists a negative-pressure region close to the nozzle edge, corresponding to the forming leading vortex ring.
The evolution of the pressure field for cases with the fast acceleration (i.e. the FAD and FASD velocity programmes). The blue solid lines indicate the positive-pressure contours and red dashed lines indicate the negative-pressure contours. The thick black lines indicate the nozzle wall.

As shown in figure 8(a), the majority of the exit plane is under the influence of the over pressure, leading to the positive instantaneous pressure force. The effect of the forming leading vortex ring, however, gradually becomes dominant as the jet acceleration disappears  $({t^\ast } = 0.25)$. As a result, the pressure distribution at the exit plane drops to negative values under the influence of the leading vortex ring. This is in agreement with the experimental results of Schlueter-Kuck & Dabiri (Reference Schlueter-Kuck and Dabiri2016) that a low-pressure region in the shear layer (i.e. near the region
 $r/D = 0.5$) coincides with the core of the leading vortex ring. The current results thus indicate that the development of the leading vortex ring is responsible for the transient negative pressure impulse after the initial jet acceleration. This finding that a negative pressure develops near the nozzle exit plane was not observed in the previous study of Krueger & Gharib (Reference Krueger and Gharib2003) because their results focus on the net pressure impulse per pulse.
As it grows in strength, the effect of the leading vortex ring on the nozzle exit pressure distribution intensifies. The induced negative-pressure field at  ${t^\ast } = 0.35$ should account for the initial minimum pressure thrust shown in figure 5(a,c). After its rapid growth near the nozzle edge during jet initiation, the leading vortex ring starts to travel downstream under its self-induced velocity. Even though its growth continues by the vorticity flux from the trailing shear layer, its influence on the nozzle exit area diminishes rapidly, as shown in figure 8(d). As the jet proceeds at a constant discharge velocity, the absolute pressure at the nozzle exit would eventually recover to the ambient value (i.e. with zero gauge pressure) given that the stroke ratio is sufficiently large, resulting in negligible pressure thrust. In that sense, the starting jet gradually approaches its steady state as the nozzle boundary layer becomes fully developed, in which the jet impulse is provided solely by the momentum flux component. While the leading vortex ring is associated with the instantaneous negative pressure impulse immediately after the acceleration stage, its influence is relatively small compared to the initial over pressure effect caused by the rapid jet fluid acceleration and would diminish gradually when the vortex ring translates downstream away from the nozzle exit plane.
Although the negative peak of the pressure force during the final termination stage of the starting jet is affected primarily by the deceleration of the jet fluid, the subsequent positive overshoot is found to be associated with the formation of the stopping vortex. We first look into the large  ${L_m}/D$ cases in which the influence of the induced pressure field of the leading vortex ring can be regarded to be insignificant near the exit plane of the nozzle. The evolution of the pressure field of the case with FAD velocity programme and
 ${L_m}/D = 6$ (its deceleration stage is
 $5.75 \lt {t^\ast } \lt 6.25$) is presented in figure 9(a). Opposite to the initial acceleration stage, the deceleration of the jet results in a huge negative pressure inside the nozzle and around its exit plane at
 ${t^\ast } = 6.15$, with strong adverse pressure gradient to prevent the fluid flowing out of the nozzle. Similar to the effect of the leading vortex ring, the opposite-signed stopping vortex induces negative-pressure region near the nozzle exit edge.
The evolution of (a) the pressure field, (b) the streamline patterns and (c) velocity vector plots for case 14 with the FAD velocity programmes and  ${L_m}/D = 6$. The thick black lines indicate the nozzle wall. In the pressure contour figures, the blue solid lines indicate the positive-pressure contours and red dashed lines indicate the negative-pressure contours.

After the jet is shut off completely  $({t^\ast } = 6.25)$, the stopping vortex grows close to the nozzle edge and starts to influence the pressure distribution along the exit plane. Although the stopping vortex core coincides with the negative-pressure region near the nozzle edge, the majority of nozzle exit area is occupied by a positive-pressure field. As illustrated by the transient streamline pattern in figure 9(b), the induced velocity of the stopping vortex would draw the ambient fluid outside the nozzle towards its inner region. However, this induced ambient fluid flow cannot negotiate the nozzle exit plane to fill its fixed internal volume, but instead is pushed away from the nozzle by the local pressure rise at the nozzle exit plane. The velocity vector plots presented in figure 9(c) indicate that the weak axial flow in the near wake after the jet has stopped
 $({t^\ast } \gt 6.25)$ is a direct result of the induced local high-pressure region at the nozzle exit. Therefore, the formation of the stopping vortex is responsible for the slight overshoot of the pressure thrust after its sudden drop during jet termination, as shown in figure 5(c). Afterwards, as the stopping vortex is weakened by viscous diffusion, its effects near the exit plane, i.e. the induced inward flow and the high-pressure region, gradually disappear. Consequently, the pressure impulse of the jet remains constant for the long-time behaviour.
In the short  ${L_m}/D$ regime, the development of the pressure impulse during the jet termination stage is complicated further by the close proximity of the leading vortex ring to the nozzle exit. As shown by the evolution of the pressure contours in figure 8, the leading vortex ring induces a low-pressure region near the nozzle exit which would degrade rapidly as the vortex ring travels downstream. For the short
 ${L_m}/D$ cases in which the starting jet enters the deceleration stage at small
 ${t^\ast }$, the forming vortex ring may not be far enough away from the nozzle exit during the jet termination process to have a negligible influence on the nozzle exit plane.
The variations of the pressure coefficient distribution at the nozzle exit plane are presented in the figure 10 for the starting jets with the FAD velocity programme. At the onset of the jet deceleration stage, the pressure coefficient on the nozzle exit plane is negative for small  ${L_m}/D$ and increases with
 ${L_m}/D$ until
 ${L_m}/D \approx 4$. A similar dependence of the pressure distribution on
 ${L_m}/D$ can also be observed at the end of the jet deceleration stage, as shown in figure 10(b). The lower value of pressure distribution at the nozzle exit during the whole deceleration stage for short
 ${L_m}/D$ is associated with the interaction between the formation of the leading vortex ring and the jet termination process, which has not been recognized in prior studies (Krueger & Gharib Reference Krueger and Gharib2003; Krige & Mohseni Reference Krige and Mohseni2013). As a result of this interaction, the starting jet with short
 ${L_m}/D$ typically possesses smaller total pressure impulse than the large
 ${L_m}/D$ case, in which the effect of the leading vortex ring can be safely ignored because it has travelled sufficiently downstream during the jet deceleration stage. Owing to the localized nature of the induced pressure field of the leading vortex ring and its gradually increased distance to the nozzle exit at jet deceleration as
 ${L_m}/D$ increases, the total pressure impulse per pulse is found to increase with
 ${L_m}/D$ initially and to level off for sufficiently large
 ${L_m}/D$ (e.g.
 ${L_m}/D \gt 4$ for the FAD velocity programme), as shown in figure 6(a).
The distribution of pressure coefficient at the nozzle exit plane for the starting jets with the FAD velocity programme and the stroke ratio ranging from 1.5 to 5 at (a) the beginning and (b) the end of the jet deceleration stage. Pressure coefficient is defined as  ${C_p} = 2p/\rho U_m^2$.

The examination of the unsteady wake dynamics of the starting jet highlights the effects of the two major flow structures, i.e. the leading vortex ring and the stopping vortex, on the pressure impulse production. This finding could shed light on a more complete understanding of the physical mechanisms for the total pressure impulse generated by a starting jet with finite fluid discharged. First, as explained by Krueger (Reference Krueger2005), the initial abrupt increase in the pressure impulse results from the fast acceleration of the jet from rest. They attributed the over pressure to the acceleration of the ambient fluid near the nozzle exit plane. Second, after the initial jet acceleration, the formation of the leading vortex ring induces a negative-pressure region at the nozzle exit when it grows in size but does not translate appreciably downstream. Afterwards, as it travels downstream under its self-induced velocity, its influence gradually becomes negligible at the exit plane and the pressure thrust recovers to almost zero. Third, similar but opposite to the initial acceleration stage, the jet termination is characterized by the adverse pressure gradient inside the nozzle, which is responsible for the rapid flow deceleration. It leads to the negative pressure thrust until the jet is shut off completely. Finally, a stopping vortex is generated very close to the nozzle edge during jet termination. After the jet flow disappears, its induced velocity field would generate a positive-pressure region at the nozzle exit and contribute favourably to the pressure impulse.
Among these four mechanisms, it is realized that the initial acceleration and final deceleration are more significant for determining the total pressure impulse for the starting jet with finite volume discharged, and the influence of the leading vortex ring and the stopping vortex is secondary. As to the total pressure impulse per pulse, its dependence on the jet stroke ratio should be interpreted in terms of the interaction of the leading vortex ring and the jet termination process, which diminishes with the increase of the stroke ratio until a critical value is reached (i.e.  ${L_m}/D \approx 4$). For the starting jet with sufficiently large stroke ratios, the effect of the leading vortex ring on the pressure field at the nozzle exit becomes negligible, resulting in the independence of the total pressure impulse on the stroke ratio.
4. Concluding remarks
The propulsive characteristics of starting jets with finite discharged volume have been investigated in order to elucidate the physical mechanisms for the propulsive benefits provided by an unsteady jet as confirmed by several previous researches. The starting jets generated by the piston–cylinder apparatus with different velocity programmes and stroke ratios were modelled numerically. The analysis on the transient development of the propulsive quantities revealed that the total thrust supplied by the starting jet is determined primarily by the momentum flux and secondarily by the pressure term at the nozzle exit. Besides the nozzle over pressure generated during the initial stage, the negative-pressure field was identified in the jet near wake during the termination stage, resulting in a sudden decrease in the pressure impulse. Thus, for the starting jet with finite fluid discharged, the pressure impulse per jet actually depends on both the positive contribution from the initial over pressure as well as the negative effect of the final jet deceleration.
According to the transient development of pressure impulse during the jet ejection, the effects of the vortex ring formation on the impulse and thrust generation can be inspected more directly than in the previous experimental studies. It is suggested that the dynamics of vortical structures in the starting jet, i.e. the leading vortex ring and the stopping vortex, play less significant roles in pressure impulse generation than the jet acceleration and deceleration. It is interesting to observe that the forming leading vortex ring induces a negative-pressure region near the nozzle exit, and thus leads to a slight drop in the pressure impulse. On the other hand, the stopping vortex generated close to the nozzle edge would generate a positive-pressure region at the nozzle exit by its induced velocity and contribute favourably to the pressure impulse. Moreover, for the starting jet with small jet stroke ratio, the leading vortex ring formation would interact with the jet deceleration and the formation of the stopping vortex, leading to further decrease in the pressure impulse. Therefore, the degraded influence of the induced negative pressure by the leading vortex ring at the jet termination should account for the increase of the total pressure impulse when the jet stroke ratio is sufficiently small.
As a final concluding remark, it should be noted that the initial fluid acceleration and the vortex formation could not be regarded as independent events in the starting process of the jet flow, because the leading vortex ring formation by rolling-up of the separated shear layer from the nozzle edge is an inevitable flow structure associated with the starting process. Even though the effect of the leading vortex ring itself is negative to the instantaneous pressure impulse, its growth and downstream translation as  ${L_m}/D$ increases in combination with the over pressure effect from the initial acceleration can be understood as a positive contribution to the total pressure impulse per pulse.
Acknowledgements
Financial support from Sichuan University is gratefully acknowledged.
Declaration of interests
The authors report no conflict of interest.



