INTRODUCTION
The Qinghai–Tibetan Plateau (the third pole on Earth) and Arctic store more snow, ice, and glaciers than anywhere else in the Northern Hemisphere (Yao et al., Reference Yao, Thompson, Yang, Yu, Gao, Guo and Yang2012). They play a vital role in the ecological and environmental changes of the polar regions and also impact other regions to varying degrees through atmospheric and oceanic circulations and the water cycle (Tao and Ding, Reference Tao and Ding1981; Wu et al., Reference Wu, Liu, He, Bao, Duan and Jin2012; Pithan and Mauritsen, Reference Pithan and Mauritsen2014; Sévellec et al., Reference Sévellec, Fedorov and Liu2017; Gao et al., Reference Gao, Duan, Chen and Wu2019). Thus, the “two poles” in the Northern Hemisphere are typified by their multi-layer interaction with the global climate system (Yao et al., Reference Yao, Xue, Chen, Chen, Thompson, Cui and Koike2019; Li et al., Reference Li, Che, Li, Wang, Duan, Shangguan and Pan2020).
The past millennium includes both the Modern Warm Period, which has been dominated by anthropogenic forcing, and the Medieval Warm Period and Little Ice Age, which were mostly controlled by natural forcing. It therefore provides an opportunity to understand the relative contribution of human and natural factors and their impacts on the changing climate of the Qinghai–Tibetan Plateau and Arctic. Previous studies focused mainly on individual temperature reconstructions in the Qinghai–Tibetan Plateau (Yang et al., Reference Yang, Bräeuning and Shi2003; Liang et al., Reference Liang, Shao and Qin2008; Liu et al., Reference Liu, An, Linderholm, Chen, Song, Cai and Sun2009) and Arctic (Kaufman et al., Reference Kaufman, Schneider, McKay, Ammann, Bradley, Briffa and Miller2009; Shi et al., Reference Shi, Yang, Ljungqvist and Yang2012; McKay and Kaufman, Reference McKay and Kaufman2014) separately. Several studies have investigated the impact of the internal mode of Arctic climate variability (i.e., the North Atlantic Oscillation) on the climate of the Qinghai–Tibetan Plateau (Wang et al., Reference Wang, Thompson, Davis, Mosley-Thompson, Yao and Pu2003; Liang et al., Reference Liang, Shao and Qin2008; Fang et al., Reference Fang, Gou, Chen, Li, D'Arrigo, Cook and Yang2010; Wang et al., Reference Wang, Yang, Qin, Kang, He and Wang2014). However, few studies have considered the temperature relationship between these two cryosphere-dominated regions in the Northern Hemisphere.
The two classifications used here are the climate index reconstruction and climate field reconstruction (Christiansen and Ljungqvist, Reference Christiansen and Ljungqvist2017; Shi et al., Reference Shi, Zhao, Guo, Goosse and Yin2017b). The polar temperature index reconstruction uses ice core records obtained from an ice sheet or a high mountain glacier. The oxygen isotope variations of four ice cores in the Qinghai–Tibetan Plateau (the Puruogangri, Guliya, Dasuopu, and Dunde ice cores) distinctly characterize the temperature change there over the past millennium (Thompson et al., Reference Thompson, Mosley-Thompson, Brecher, Davis, Leon, Les and Lin2006; Yao et al., Reference Yao, Duan, Thompson, Wang, Tian, Xu and Wang2007). International programs such as the Greenland Ice Core Project (GRIP) in the Arctic region provide key materials for analyzing Arctic temperature variations over the past 2,000 yr (Greenland Ice core Project (GRIP) Members, 1993). As the physical meaning of the oxygen isotopes in different areas is not always clear (Cheng et al., Reference Cheng, Edwards, Sinha, Spötl, Yi, Chen and Kelly2016; Liu et al., Reference Liu, Chen, Chen, Zhang and Chen2017; Clemens et al., Reference Clemens, Holbourn, Kubota, Lee, Liu, Chen and Nelson2018), other proxy records, such as tree rings, which provide additional independent evidence, help to identify the real temperature variations in polar regions. Pioneering research in the early twenty-first century has reconstructed the temperature variations on the Qinghai–Tibetan Plateau from the past two millennia based on 16 multi-proxy records (Yang et al., Reference Yang, Bräeuning and Shi2003). Further proxy records, developed with rigorous data quality control measures, reconstructed regional temperature variations in China, including the Qinghai–Tibetan Plateau (Ge et al., Reference Ge, Zheng, Hao, Shao, Wang and Luterbacher2010). In the Arctic, 21 multi-proxy records were used to develop Arctic summer temperature variations over the past two millennia with decadal resolution (Kaufman et al., Reference Kaufman, Schneider, McKay, Ammann, Bradley, Briffa and Miller2009). With the updates of Shi and colleagues (Reference Shi, Yang, Ljungqvist and Yang2012) and McKay and Kaufman (Reference McKay and Kaufman2014), we use the improved temperature index with annual resolution in our work.
The climate field reconstruction estimates past climate patterns from before the instrumental period using climate proxies and homogenization methods (Mann et al., Reference Mann, Bradley and Hughes1998; Riedwyl et al., Reference Riedwyl, Kuttel, Luterbacher and Wanner2009; Neukom et al., Reference Neukom, Steiger, Gómez-Navarro, Wang and Werner2019b). The gridded climate field reconstruction in the Arctic has been released recently (Werner et al., Reference Werner, Divine, Ljungqvist, Nilsen and Francus2018), and there has been great progress in the integration and assimilation of global temperature field reconstructions, along with the publication of the Past Global Changes project (PAGES) 2k dataset (Neukom et al., Reference Neukom, Steiger, Gómez-Navarro, Wang and Werner2019b; Tardif et al., Reference Tardif, Hakim, Perkins, Horlick, Erb, Emile-Geay and Anderson2019). The Asia 2k regional group, as part of the PAGES2k Network, agreed to independently produce two gridded reconstructions of East Asian summer temperatures from the past millennium using two approaches (Sano et al., Reference Sano, Shi and Nakatsuka2012): one based on tree ring data (Cook et al., Reference Cook, Krusic, Anchukaitis, Buckley, Nakatsuka and Sano2013) and the other based on multi-proxy records (Shi et al., Reference Shi, Ge, Yang, Li, Yang, Ljungqvist and Solomina2015). The tree ring reconstruction utilizes multiple high-quality tree ring width chronologies in the Qinghai–Tibetan Plateau, developed by Edward R. Cook's team and Xuemei Shao's team. These were not included in the multi-proxy reconstruction. On the other hand, some tree ring chronologies in the Qinghai–Tibetan Plateau developed by Bao Yang's team, along with some other types of proxy records (Wang et al., Reference Wang, Wen, Luo, Dong, Zhao and Yang2007), were not used in the tree ring reconstruction, but were used in the multi-proxy reconstruction. The reconstructions of Cook and colleagues (Reference Cook, Krusic, Anchukaitis, Buckley, Nakatsuka and Sano2013) and Shi and colleagues (Reference Shi, Ge, Yang, Li, Yang, Ljungqvist and Solomina2015) were conducted independently, and integrating these two reconstructions can provide better information about temperature changes in East Asia.
In this study, based on existing temperature reconstructions, we compare the summer temperature variations in the Arctic and Qinghai–Tibetan Plateau over the past millennium. We then analyze the correlation between these over different time scales and explore the physical mechanisms responsible for the variations.
DATA AND METHODS
Data
High data quality was ensured in our study as follows: (1) the resolution of the reconstruction is on an annual scale, which facilitates the subsequent analysis of the temperature lead-lag relationship, and (2) the gridded climate reconstruction was prioritized, since homogenization can effectively remove the inherent non-climatic errors of single-proxy records (e.g., the low-frequency trend in one tree ring record is usually indistinguishable because of the mitigating effects of tree age bias).
We utilized 12 datasets covering the period 900–1999 CE, including two summer temperature gridded datasets from the Qinghai–Tibetan Plateau (Cook et al., Reference Cook, Krusic, Anchukaitis, Buckley, Nakatsuka and Sano2013; Shi et al., Reference Shi, Ge, Yang, Li, Yang, Ljungqvist and Solomina2015), two summer temperature series from the Arctic (Shi et al., Reference Shi, Yang, Ljungqvist and Yang2012; McKay and Kaufman, Reference McKay and Kaufman2014), a summer temperature gridded dataset from the Arctic (Werner et al., Reference Werner, Divine, Ljungqvist, Nilsen and Francus2018), six global gridded annual temperature reconstruction datasets (Neukom et al., Reference Neukom, Steiger, Gómez-Navarro, Wang and Werner2019b), and a last millennium reanalysis dataset with seasonal resolution (Tardif et al., Reference Tardif, Hakim, Perkins, Horlick, Erb, Emile-Geay and Anderson2019).
Comparison of the summer temperature reconstructions in the Qinghai–Tibetan Plateau and Arctic over the past millennium (900–2000 CE) (Supplementary Fig. S1) shows that the temperature anomalies in the two regions both have a visibly increasing trend over the last century, and that the consistency of the Arctic summer temperature series is better than that of the Qinghai–Tibetan Plateau. However, there are still distinct differences in phase, magnitude, and amplitude between different reconstructions for the same region. Thus, a combination of various reconstructions is needed to mitigate their distinct regional coverage.
The summer temperature anomalies (with respect to 1961–1990 CE) from the CRUTEM4v temperature dataset (Jones et al., Reference Jones, Lister, Osborn, Harpham, Salmon and Morice2012) during the period 1880–2019 CE was taken as the reconstruction target. The differences among the instrumental datasets during the instrumental period were ignored, since it is not the main factor affecting the uncertainty of the reconstruction record.
The Community Earth System Model Last Millennium Ensemble (CESM-LME) experiments (Otto-Bliesner et al., Reference Otto-Bliesner, Brady, Fasullo, Jahn, Landrum, Stevenson and Rosenbloom2016) and LOch-Vecode-Ecbilt-CLio-agIsm Model-Large Common Era Ensemble (LOVECLIM-LCE) experiments were used to explore the mechanisms controlling the temperature correlation between the Qinghai–Tibetan Plateau and Arctic. The main forcings (including volcanic eruptions, greenhouse gases, and solar activity) used to drive the CESM-LME/LOVECLIM simulations are those recommended by the third/fourth phase of the Paleoclimate Modelling Intercomparison Project (PMIP3) (Schmidt et al., Reference Schmidt, Jungclaus, Ammann, Bard, Braconnot, Crowley and Delaygue2012; Jungclaus et al., Reference Jungclaus, Bard, Baroni, Braconnot, Cao, Chini and Egorova2017). There are 13 members in the CESM-LME simulation and 70 members in the LOVECLIM-LCE simulation.
The range of latitudes used to calculate the integrated temperature in the Arctic (60°N–90°N) is consistent with previous studies (Shi et al., Reference Shi, Yang, Ljungqvist and Yang2012), while the area of the Qinghai–Tibetan Plateau (27°N–36°N, 77°E–106°E) is defined with regard to distinctive climatic and geographical characteristics (Zhou et al., Reference Zhou, Wen, Xu, Song and Zhang2014). The average regional temperature series were calculated as the latitude-weighted averages of the global gridded temperature data according to the above ranges.
Optimal information extraction method
The optimal information extraction (OIE) method is a variant of the composite-plus-scale method (Bradley and Jones, Reference Bradley and Jones1993), which is based on the ensemble-local method (Christiansen, Reference Christiansen2011; Shi et al., Reference Shi, Yang, Ljungqvist and Yang2012), generalized likelihood uncertainty estimation method (Wang et al., Reference Wang, Hoffmann, Six, Kaplan, Govers, Doetterl and Van Oost2017), and ensemble reconstructions (Neukom et al., Reference Neukom, Gergis, Karoly, Wanner, Curran, Elbert and González-Rouco2014).
We used the OIE version 2.0 method (Neukom et al., Reference Neukom, Barboza, Erb, Shi, Emile-Geay, Evans and Franke2019a) to reconstruct the summer temperatures in the Qinghai–Tibetan Plateau and Arctic. The reconstructions shown in Supplementary Figure S1 have a high correlation because of the same target and similar dataset (i.e., the six global reconstructions were derived from the same proxy dataset; Neukom et al., Reference Neukom, Steiger, Gómez-Navarro, Wang and Werner2019b). Thus, the elastic net regularization is introduced to deal with multi-co-linearity in the OIE method. The elastic net regularization is a convex combination of ridge and Lasso regressions that penalizes the sum of the squared coefficients and sum of the absolute values of the regression coefficients. This method is designed to improve the simple linear regression model and reduce over-fitting via 10-fold cross-validation (Zou and Hastie, Reference Zou and Hastie2005). Random labeled predictor variables during the different calibration periods were also applied as recommended by McShane and Wyner (Reference McShane and Wyner2011), because the different calibration periods have substantial influence on the regression model. The high correlation between the instrumental and reconstructed temperatures in Supplementary Figure S2 shows the robust performance of our reconstruction, as verified through a random 10-fold cross-validation.
Data assimilation method
Data assimilation for paleoclimate combines proxy climate records and the underlying dynamical principles from climate models to develop mechanistically consistent estimates of paleoclimate variations (Evans et al., Reference Evans, Goosse and Khatiwala2017). Two approaches (off-line and online methods) have previously been applied in paleoclimate data assimilation (Goosse et al., Reference Goosse, Crespin, Dubinkina, Loutre, Mann, Renssen and Sallaz-Damaz2012). The difference between these methods is whether the climate model propagates the proxy information forward in time or not (Matsikaris et al., Reference Matsikaris, Widmann and Jungclaus2015).
In this study, an off-line approach is used to assimilate the temperature data in the two regions under consideration. The weighted-mean of the covariance between the model simulation and the proxy reconstruction is calculated by:

where the term x1i.j is the simulated temperature in the Qinghai–Tibetan Plateau for ensemble member i in the year j, and the term y1j is the reconstructed temperature in the Qinghai–Tibetan Plateau in the year j. The terms x2i,j and y2j are the corresponding temperatures in the Arctic. The term $w_{i, j}^{\prime}$ is the weight of the simulated temperature for ensemble member i in the year j. The weights are non-negative, at most one, and sum up to one. Thus, the weight is revised according to Equation 2,

where the term w i,j is the final weight for ensemble member i in the year j, and n is the number of ensemble members; n = 13 for the CESM-LME experiments (Otto-Bliesner et al., Reference Otto-Bliesner, Brady, Fasullo, Jahn, Landrum, Stevenson and Rosenbloom2016) and n = 70 for the LOVECLIM-LCE experiments.
Ensemble empirical mode decomposition method
The ensemble empirical mode decomposition (EEMD) method (Wu and Huang, Reference Wu and Huang2009) was used to decompose the original signal into different modes of temporal variability. The ratio of the standard deviation of the added white noise to the original signal was set to 0.3, and the number of ensemble members was set to 1,000, following Qian (Reference Qian2016). Two noise amplitudes (0.2 and 0.3) were used to assess the decomposition performance; we found the differences to be minor. The large ensemble approach means the method is largely invariant to moderate levels of added noise (Qian, Reference Qian2016). The classification of the different modes of temporal variability was made following previous studies (Mann et al., Reference Mann, Park and Bradley1995; Shi et al., Reference Shi, Fang, Xu, Guo and Borgaonkar2017a).
RESULTS
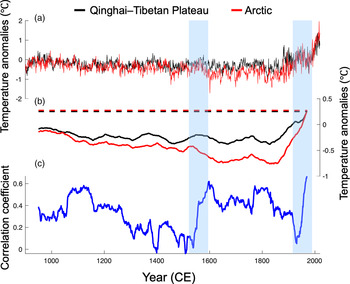
The reconstructed summer temperature anomalies during the period (900–2019 CE) in the Qinghai–Tibetan Plateau and Arctic are shown in Figure 1a and Supplementary Figure S3. The correlation coefficient between the reconstructed temperatures in the two regions over the past 1,120 yr is 0.57. The mean temperature over the most recent 100 yr (1920–2019 CE) in these two regions is larger than in other periods, which indicates that the Modern Warm Period is unprecedented within the last millennium (Fig. 1b). The temperature difference between the two regions is very small during the Medieval Warm Period, reaches a maximum during the Little Ice Age, and then decreases to a minimum during the Modern Warm Period (Fig. 1b). The temperature correlation between the two regions exhibits an obvious centennial variation during the period (900–2019 CE) (Fig. 1c). A prominent feature is that an abrupt transition from a weak to a strong temperature correlation during the sixteenth century is similar to that occurring during the twentieth century. This is supported by independent evidence from the summer temperature in Europe (Luterbacher et al., Reference Luterbacher, Werner, Smerdon, Fernández-Donado, González-Rouco, Barriopedro and Ljungqvist2016) (Supplementary Fig. S4), where the correlation with the Arctic temperature also shows an abrupt weak-to-strong transition around the sixteenth century, indicating that volcanic eruptions at that time had a widespread influence.
Comparison of the composited summer temperature anomalies (unit: °C, with respect to 1961–1990 CE) over the period 900–2019 CE in the Qinghai–Tibetan Plateau (black line) and in the Arctic (red line). (a) The raw data, (b) 100-yr moving average, where the dashed lines indicate the 100-yr (1920–2019 CE) average temperatures, and (c) 100-yr moving correlation of the proxy-based reconstructed temperatures (blue line). The blue shaded bars indicate transitions from a weak to a strong correlation. (For interpretation of the references to color in this figure legend, the reader is referred to the web version of this article.)

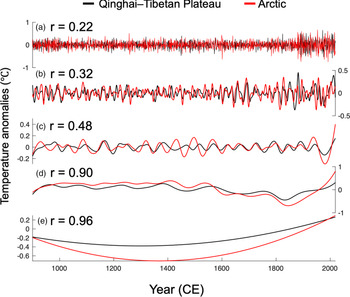
The various modes of temporal variability in the two regions are shown in Figure 2, obtained using the EEMD method. The correlation and variance of these modes increase from interannual to multi-decadal scales (Fig. 2a–c). The most significant correlation occurs on a centennial scale (Fig. 2d) except for the trend correlation in Figure 2e. The long-term temperature trend in these two regions gradually decreases from the Medieval Warm Period to the Little Ice Age, and then gradually increases to the Modern Warm Period (Fig. 2e), which is in line with the overall variation of the temperature in the Northern Hemisphere (Shi et al., Reference Shi, Yang, Mairesse, von Gunten, Li, Bräuning and Yang2013). However, one marked and dominant difference between the regions is that the temperature decrease during the Little Ice Age is substantially bigger in the Arctic than in the Qinghai–Tibetan Plateau (Fig. 2e).
(color online) Comparison of temperature anomalies (unit: °C, with respect to 1961–1990 CE) in the Qinghai–Tibetan Plateau and in the Arctic over the period (900–2019 CE) based on the ensemble empirical mode decomposition (EEMD) method with their correlation coefficient (r). (a) The interannual, (b) interdecadal, (c) multi-decadal, and (d) centennial components, and (e) long-term tendency.

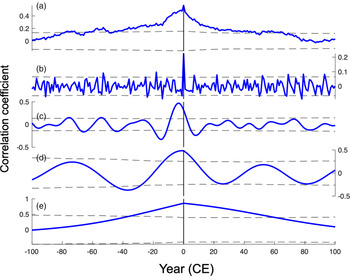
The lead-lag relationship of the summer temperature variability in the two regions over different time scales is shown in Figure 3. The interdecadal and multi-decadal components of the summer temperature variation in the Arctic lead that of the Qinghai–Tibetan Plateau by three years and one year, respectively (Fig. 3c–d). The raw data and other modes of variability in Figures 3a, 3b, and 3e all show a clear contemporaneous correlation. These results imply that the interaction mechanism is one that occurs on quasi-biennial and multi-decadal time scales and needs to be further explored.
(color online) The lead-lag correlation of the composited summer temperature anomalies (with respect to 1961–1990 CE) in the Qinghai–Tibetan Plateau and in the Arctic. (a) The raw data and (b) interannual, (c) interdecadal, (d) multi-decadal, and (e) centennial components. Negative (positive) lags mean that the temperature in the Qinghai–Tibetan Plateau lags (leads) that of the Arctic.

DISCUSSION
To understand the mechanism controlling the temperature correlation in these two regions, a simple data assimilation method was used to incorporate the CESM and LOVECLIM simulations (Supplementary Figs. S5–S6). The proxy-based temperature reconstructions compare well with those obtained through data assimilation. The correlation coefficient between the proxy-reconstructed and CESM data assimilation–based temperatures in the Qinghai–Tibetan Plateau over the period (900–2005 CE) is 0.60 in Supplementary Figure S5a, whereas the value is 0.21 for the correlation between the proxy-reconstructed temperature and ensemble mean temperature of the CESM-LME simulations (figure not shown). Correspondingly, the same correlation coefficient but for the Arctic is improved from 0.43 to 0.72 during the period (900–2000 CE). Comparing the proxy-reconstructed and data assimilation–based temperatures in the Qinghai–Tibetan Plateau (Supplementary Fig. S5a) and Arctic (Supplementary Fig. S5b), the temperature response to volcanic eruptions is more significant in the assimilation than in the reconstruction (e.g., the volcanic eruption in 1258 CE). The 100-yr moving correlation between the data assimilation–based temperatures in the two regions is broadly consistent with that of the reconstructed temperatures, except for some high levels (e.g., the correlation coefficient between the data assimilation-based temperatures in the two regions is at a high level around 1258 CE; Supplementary Fig. S5c). This suggests the influence of volcanic activity on the temperature correlation between the two regions may be important.
The LOVECLIM data assimilation–based results are highly consistent with those from the CESM (Supplementary Fig. S6), indicating that the result does not strongly depend on which of the two climate models is used for data assimilation. There is greater consistency between the proxy-reconstructed and data assimilation–based temperatures from the LOVECLIM simulations than from the CESM simulations. The correlation coefficient between the proxy-reconstructed and data assimilation–based temperatures in the Qinghai–Tibetan Plateau is 0.69, whereas the value is 0.25 for the correlation between the reconstructed temperature and the ensemble mean temperature of the LOVECLIM-LCE simulations, and in the Arctic the same correlation coefficient is improved from 0.41 to 0.84. Compared with the results of the FESM-LME results in Supplementary Figure S5, the 70-member LOVECLIM-LCE simulation performs better than the 13-member CESM-LME simulation. It also means that the identification of a mechanism to explain the temperature correlation between the two regions can be investigated just as well using the data assimilation–based reconstructions as the proxy reconstructions.
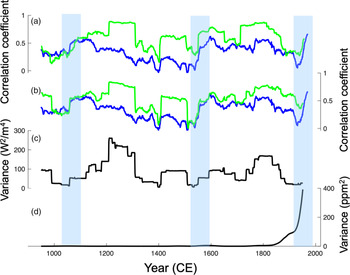
The 100-yr variance of volcanic eruptions in the Northern Hemisphere and the 100-yr variance of global CO2 concentrations were used to explore their link with the temperature correlation between the Qinghai–Tibetan Plateau and Arctic. The variance of volcanic eruptions over the past millennium (Fig. 4c) has a high correlation with both the data assimilation–based temperature reconstructions of the CESM-LME (Fig. 4a) simulation and the LOVECLIM-LCE simulation (Fig. 4b) data assimilation–based temperature correlation between the two regions.
The 100-yr moving correlations of the temperature anomalies (with respect to 1961–1990 CE) in these two regions for the proxy-based reconstruction (blue line) and data assimilation (green line) temperatures using the (a) CESM-LME and (b) LOVECLIM-LCE simulations. Also depicted are the 100-yr variances of (c) volcanic eruptions (unit: W2/m4) in the Northern Hemisphere and (d) global CO2 concentrations (unit: ppm2). The blue shaded bars indicate the transitions from weak to strong temperature correlations. (For interpretation of the references to color in this figure legend, the reader is referred to the web version of this article.)

While the two quick transitions from a weak to a strong correlation during the eleventh and sixteenth centuries appear to be primarily attributable to volcanic eruptions (as radiative forcing in the form of an equivalent Total Solar Irradiance) (Fig. 4c), the rapid transition in the Modern Warm Period is more linked to the 100-yr variance of the global CO2 concentration (Fig. 4d). The interregional correlations, as part of the hemispheric mean signal, are likely stronger when the forcing itself is stronger, but it is difficult to quantify the relative contributions of various local feedbacks and influence of internal variability on the amplitude of the signal.
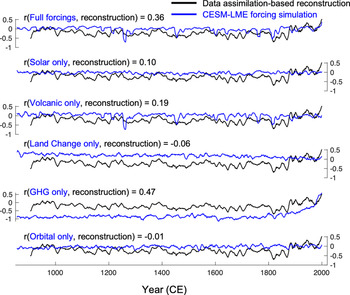
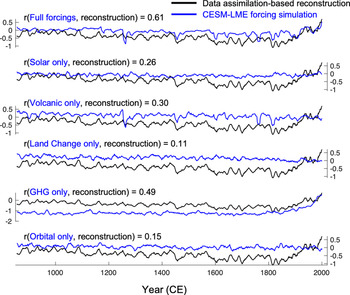
Figures 5 and 6 compare the data assimilation–based temperature reconstruction from the CESM with the temperature simulated in the CESM-LME single- and full-forcing experiments in the Qinghai–Tibetan Plateau and Arctic, respectively. The temperature variability in the full-forcing experiment is dominated by volcanic forcing; the correlation coefficient between the full-forcing experiment and volcanic single-forcing experiment is 0.83 for the Qinghai–Tibetan Plateau and 0.69 for the Arctic (figure not shown). However, when considering the data assimilation–based reconstruction, greenhouse gas forcing is the dominant factor; the correlation coefficient between the data assimilation–based reconstruction and greenhouse gas single-forcing experiment is 0.47 for the Qinghai–Tibetan Plateau and 0.49 for the Arctic (Figs. 5–6). The influence of solar activity is significant but is less important than the volcanic activity and greenhouse gases; the correlation coefficient between the data assimilation–based reconstruction and solar single-forcing experiment is smaller than the above two factors. Land change and orbital forcing are not important, as indicated by their small correlation coefficients with the proxy-based reconstruction. The correlations of the CESM-LME single-forcing experiments with the full-forcing experiments and data assimilation–based reconstructions both indicate that volcanic forcing has directly modulated the temperature variability in the Qinghai–Tibetan Plateau and Arctic over the last millennium.
Comparison of the data assimilation–based temperature anomalies (unit: °C, with respect to 1961–1990 CE, black lines) and the CESM-LME simulated temperature anomalies (unit: °C, with respect to 1961–1990 CE, blue lines) using single-forcing and full-forcing in the Qinghai–Tibetan Plateau. Smoothing is applied with an 11-yr running mean. The “r” value is the correlation coefficient between the simulation and data assimilation during the period (855–2000 CE). (For interpretation of the references to color in this figure legend, the reader is referred to the web version of this article.)

Comparison of the data assimilation–based temperature anomalies (unit: °C, with respect to 1961–1990 CE, black lines) and the CESM-LME simulated temperature anomalies (unit: °C, with respect to 1961–1990 CE, blue lines) using single-forcing and full-forcing in the Arctic. Smoothing is applied with an 11-yr running mean. The “r” value is the correlation coefficient between the simulation and data assimilation during the period (855–2000 CE). (For interpretation of the references to color in this figure legend, the reader is referred to the web version of this article.)

CONCLUSIONS
The summer temperature variations in the Qinghai–Tibetan Plateau and Arctic during the period (900–2019 CE) were compared using the OIE method, based on previous regional and global reconstructed datasets. The reconstructed results show that the summer temperatures in the Qinghai–Tibetan Plateau and Arctic during the Modern Warm Period (1920–2019 CE) are unprecedented in the last 1,120 yr (900–2019 CE), highlighting how greenhouse gas emissions have amplified warming in the Arctic and on elevated plateaus. Compared with the temperature anomalies in the Qinghai–Tibetan Plateau, there was more significant cooling in the Arctic region during the Little Ice Age, and somewhat colder temperatures during the Medieval Warm Period. The simulations fail to reproduce the warming during the Medieval Warm Period and the cooling during the Little Ice Age shown in the proxy-based temperature reconstructions.
In the past millennium, the correlation between summer temperatures in the Qinghai–Tibetan Plateau and Arctic has varied on a centennial time scale, which appears to be related to the centennial variations in volcanic forcing. The simulated temperature variations exhibit a high sensitivity to volcanic activity. Furthermore, the abrupt transition from a weak to a strong temperature correlation between these two regions in the Modern Warm Period is analogous to the weak-to-strong transition that occurred in the sixteenth century. The former was forced by changes in greenhouse gases, and the latter was linked with the impact of volcanic eruptions.
The summer temperatures in the Qinghai–Tibetan Plateau in the past millennium were found to lag the Arctic summer temperature by three years on an interdecadal time scale and by one year on a multi-decadal time scale. However, the teleconnection mechanism controlling the lead-lag relationship between summer temperatures in the Qinghai–Tibetan Plateau and Arctic remains unclear and should be further investigated.
Supplementary Material
The supplementary material for this article can be found at https://doi.org/10.1017/qua.2021.3
Acknowledgments
We thank Hugues Goosse for help with the discussion.
Financial Support
This work was jointly funded by the Strategic Priority Research Program of the Chinese Academy of Sciences (Grant Nos. XDA19070103, XDA19070404, and XDB26020204), National Natural Science Foundation of China (Grant Nos. 41888101, 41690114, 41877440, and 42077406), the Ministry of Science and Technology of the People's Republic of China (Grant No. 2016YFA0600504), and Key Research Program of the Institute of Geology & Geophysics, CAS (Grant IGGCAS-201905). Feng Shi is funded by the Youth Innovation Promotion Association, CAS. Qiuzhen Yin is a Research Associate of Fonds de la Recherche Scientifique-FNRS (F.R.S.-FNRS) and acknowledges the F.R.S.-FNRS for grant MIS F.4529.18 for funds supporting her research. John Bruun gratefully acknowledges Models2Decisions grant (M2DPP035: EP/P01677411) funded by the UK Research Council, ReCICLE (NE/M00412011), and the China Services Partnership (CSSP grant: DN321519) funded by Newton, which helped fund this research. Computational resources have been provided by the supercomputing facilities of the Université Catholique de Louvain (CISM/UCL) and Consortium des Équipements de Calcul Intensif en Fédération Wallonie Bruxelles (CÉCI) funded by the F.R.S.-FNRS de Belgique under convention 2.5020.11.
Data Availability
The reconstructed summer temperature anomalies over the past 1,100 yr (900–1999 CE) in the Qinghai–Tibetan Plateau and over the past 1,101 yr (900–2000 CE) in the Arctic in Figure 1a are available at: https://www.ncdc.noaa.gov/paleo/study/32514.