Economists still know relatively little about the repertoire of peculiar adaptations factories might have implemented to overcome missing or thin input markets and other obstacles encountered while industrialization was ongoing, especially in primarily agricultural or late-industrializing contexts. Firms in modern-day developing economies, for example, may have lower rates of turnover, higher productivity dispersion, higher rates of concentration, and a size distribution with a “missing middle” (Tybout Reference Tybout2000). This paper examines part-year operation, a once-wide-spread industrial practice seldom discussed by more recent literature in economics or economic history, particularly when describing contexts outside the United States or Great Britain.Footnote 1 Part-year operation has likely been relatively neglected in the literature because data requirements are substantial. Sources listing factory working time, even at the aggregate level, are rare in modern data, let alone in historical contexts. Moreover, unpacking the elemental relationships among a factory’s working time, location, technology, and productivity requires detailed firm-level or enterprise-level data.
This paper investigates the relationships among part-year operation, labor force composition, and production technology in a rapidly-modernizing late-industrializing country, Imperial Russia. Whether the Russian Empire could continue to develop, or whether its peculiar political and economic institutions doomed the country to poverty (or revolution), is one of the most intriguing questions in social science. At the end of the nineteenth century, the Russian Empire remained intensely agrarian, but its industrial sector grew rapidly.Footnote 2 Because of the preeminence of seasonal agriculture in the economy and the difficulty of attracting industrial labor, many factories located outside of cities in the country adjusted worktime to accommodate labor-intensive agricultural seasons. We find that factories that operated fewer days per year tended to be located in rural areas and districts with fewer factories in their industry, used less machine power, had fewer females and children in their workforces, and were less productive. Part-year factories were also more likely to perish before 1900, which suggests that part-year operation may have gradually disappeared from Russian industry over the long run. Furthermore, Russia’s patterns of part-year operation resembled those in earlier periods in countries like the United States, Great Britain, or France that eventually industrialized, so in this sense, Russian factories were not uniquely backward.
This investigation relies on a remarkably detailed factory-level dataset covering over 13,500 factories in 1894 that lists the number of working days per year that each factory operated and a wealth of other critical variables.Footnote 3 The dataset’s rich detail permits an investigation of the relationships among key variables, including the days per year the factory worked, the machines each factory used, the factory’s total annual revenue, the precise activities undertaken by the enterprise, and the factory’s labor force composition. Matching to an additional factory-level dataset from 1900 permits us to test whether part-year factories were more likely to exit. A different source providing 1900 industry-province aggregates allows us to investigate industrial wages. Finally, we examine the relationship between part-year industrial operation, agricultural production, and other regional characteristics to explain why some factories operate part-time in the first place.Footnote 4
If part-year operation is costly, it may represent a transitional stage of industrial development. Factories that operated for only one part of the year left any capital investments idle during the part of the year they shut down. A theory of Smithian growth through the division of labor would predict that part-year operating factories would become obsolete and eventually disappear. Under this framework, we expect to find that factories operating more days of the year should have more fixed capital as measured by machine power, be more productive, and be more likely to survive past 1894. Additionally, part-year operating factories may be more likely to be located in rural areas, where factories would shut down to accommodate agricultural labor demands, and in areas with fewer other factories and hence perhaps less-dense labor markets. If part-year operation constrained firm size, factories operating part-year would be smaller as measured by total workers. Finally, we examine an ambiguous prediction about workforce composition: full-year factories may employ more women and children due to the division of labor made possible by mechanization, though part-year factories may employ women and children to substitute for scarce male labor.
Our paper’s results contribute to literatures in economics and economic history by broadening our empirical historical understanding of part-time factory operation in a late industrializing region; by better understanding a factory’s interrelated decisions over operating time and production methods thanks to highly detailed data; and by applying a comprehensive dataset to a set of canonical questions in Russian history previously explored with limited snapshots and anecdotes. The highly detailed U.S. Census of Manufactures enabled an influential line of inquiry describing U.S. factory development as it unfolded. The Russian data permits a rare comparison to this case. Our paper finds that many of the relationships uncovered in this literature, for example, the relationships among size, mechanization, and part-year operation, also appear to characterize factories in the Russian Empire, a very different setting, suggesting some economic laws of motion governing factory operating time. At the same time, thanks to more detailed data, we can reconcile some unusual or unexpected findings in that literature. For example, Atack, Bateman, and Margo (Reference Atack, Bateman and Margo2002) find a negative relationship between working time and steam power, while we find a more expected positive relationship. Furthermore, we consider operating time alongside characteristics of the factory’s district or province location, which has rarely been attempted empirically though is often suggested by narratives in the literature.Footnote 5 Though extrapolating the causes of Russia’s long-run economic and political trajectory from our single snapshot should be undertaken with caution, our study clarifies the nature of obstacles confronting Russia’s long process of industrialization.
A long line of literature on Russia’s economic history debates the impact of Russia’s peculiar institutions on the country’s long-run economic and political trajectory. Recent studies have documented the economic effects of serfdom on the Imperial economy and Russia’s long-run economic trajectory (Markevich and Zhuravskaya Reference Markevich and Zhuravskaya2018; Buggle and Nafziger Reference Buggle and Nafziger2021). Serfdom’s negative effects may have persisted so long because, when serfdom was ended, peasants were not given full property rights in their plots and faced other restrictions on movement.Footnote 6 Chernina, Dower, and Markevich (Reference Chernina, Dower and Markevich2014) document that the Stolypin Reform of 1906, which gave former serfs property rights (titles) to their plots, implied an economically significant increase in migration, particularly to Siberia. However, Cheremukhin et al. (Reference Cheremukhin, Golosov, Guriev and Tsyvinski2017) argue that Russian institutions do not pose an economically significant obstacle to labor reallocation from agriculture to industry. Like Gregg (Reference Gregg2020), they stress the importance of entry barriers to the industry as a key friction in the Imperial Russian economy.
Our study of part-year operation shows a concrete connection between Russia’s still-dominant agricultural sector,Footnote 7 the geography and institutions of the Russian labor market, and industrial development.Footnote 8 While Cheremukhin et al. (Reference Cheremukhin, Golosov, Guriev and Tsyvinski2017) rely on a neoclassical growth model applied to aggregate data, we employ finer factory and district-level evidence. Unlike their study, we find some support for a connection between part-year operation and Russia’s peculiar institutions, like communal agriculture, and social disturbances like strikes. However, we also show that factories faced pressures both from the agricultural economy, which reduced labor supply, and the demands of achieving greater efficiency, which encouraged them to operate continuously. Factories that faced volatile labor markets and that also could not cheaply substitute machines for labor likely failed.Footnote 9 In this way, Russian factories were very much like those in France or the United States in earlier periods or in a variety of industrializing contexts. This is an important conclusion, both for developing a more nuanced understanding of Russia’s economic history and for forming a broader picture of industrializing economies.
Seasonal labor markets and their relationship to labor tying have been well-documented in the agrarian sectors of developing economies. In such economies, workers and landowners reach an agreement for permanent smooth employment during the idle season in exchange for workers’ commitment to work during the busy harvest and planting seasons (e.g., Bardhan Reference Bardhan1983). Sometimes these arrangements involve explicit restrictions on workers’ ability to move (Domar Reference Domar1970; Mukherjee and Ray Reference Mukherjee and Ray1995; Naidu and Yuchtman Reference Naidu and Yuchtman2013). In highly agrarian but rapidly industrializing contexts like the Russian Empire, these seasonal agricultural labor markets affected industrial labor markets as well, a relationship largely neglected by the development economics literature.
Finally, our paper closely relates to ongoing debates that seek to understand the sources of productivity differences across countries.Footnote 10 Hsieh and Klenow’s (2009) result that misallocation of inputs between more and less productive firms explains a large percentage of total factor productivity (TFP) differences between the United States and India or China has encouraged an inquiry into the sources of productivity differences across firms within the same industry. Micro-level studies of how firms in developing contexts actually operate, for example, Bloom and Van Reenen (Reference Bloom and Van Reenen2007), shed enormous light on potential sources of these differences, stressing the role of management. Our paper’s examination of part-year operation and its relationship to factory technology and productivity shows how fundamental drivers of development like market integration, institutions, and technology influence industrial development through a factory’s decisions over operating time.
The paper proceeds as follows. First, we outline a literature that relates seasonal operation, mechanization, and the composition of the factory’s labor force in other contexts before turning to the Russian literature on seasonal factory operation. Next, we relate these literatures to Russian industrial development to form a set of hypotheses about part-time factory production and its regional determinants. We test these hypotheses using 1894 factory data and regional sources, and conclude by discussing the implications of our future research.
EMPIRICAL STUDIES OF PART-YEAR OPERATION, PRODUCTION TECHNOLOGY, AND LABOR MARKETS IN THE UNITED STATES, GREAT BRITAIN, AND FRANCE
Accounts of part-year operation stress the relationship between part-year operation and seasonal agriculture and the consequences of part-year operation for factory production and performance, particularly when part-year operation relates to transitions from home production to artisanal shop manufacturing and to industrial factory production. For industrial leaders like the United States and Great Britain, the transition to full-year factory operation occurred in the early to mid-1800s. France transitioned several decades later. In Russia, such processes were still unfolding by the end of the nineteenth century. Notably, in the United States, Great Britain, and France, part-year operation emerged without the agricultural labor market distortions usually stressed in the Russian case.
Two key issues frame the economic history of industrial transitions: first, whether such changes in factory organization were associated with improvements in productivity or firm survival (e.g., Sokoloff Reference Sokoloff1984), and second, why such changes happened when and where they did. Sokoloff and Dollar (Reference Sokoloff and Dollar1997) show that, due to a higher land-to-labor ratio, agriculture in the United States was more varied and less seasonal. Workers could concentrate in manufactories without consistent seasonal pressure from the agricultural labor market. In the United Kingdom, however, a lower land-to-labor ratio resulted in a higher reliance on grains, which are highly seasonal, leading industrial entrepreneurs to adopt the cottage industry model, which allows workers the flexibility to accommodate varying demand for agricultural labor. Similarly, Sokoloff and Tchakerian’s (1997) study of manufacturing in the rural South and Midwest using the 1860 U.S. Census of Manufactures shows that manufacturers were less productive and more seasonal in locations practicing wheat agriculture.
Even though U.S. manufacturers were less sensitive to seasonality than British producers, manufacturing firms in the United States were still somewhat tied to the labor demands of agriculture. Atack, Bateman, and Margo (Reference Atack, Bateman and Margo2002) document that 38–40 percent of establishments operated for fewer than 12 full-time equivalent months a year, suggesting a substantial presence of seasonal operations that accommodated agricultural needs. They also find that larger firms with more labor and capital worked, on average, longer than smaller firms, and suggest that large, capital-intensive firms had higher termination costs as well as an ability to accommodate for business cycles without suspending operations.Footnote 11 Overall, factory-like firms in the United States were less dependent on agriculture and operated longer on an annual basis.
Magnac and Postel-Vinay (Reference Magnac and Postel-Vinay1997) explicitly connect factory operating time to seasonal labor markets in mid-nineteenth-century France. They find that a factory’s likelihood of shutting down is related to variations in urban and rural wages due to agricultural seasonality. Though their study includes more detailed information on relative wages, ours paints a more detailed picture of the consequences of shutdowns for technology and performance. They also suggest that if firms had inputs that were costly to adjust, they would be more likely to work full-year, a pattern we observe in our data.Footnote 12
Changing labor composition of manufacturing establishments also influenced industrial development. In the United States, women and children participated actively in industry; in the 1800s, 40 percent of industrial laborers were women and children. Goldin and Sokoloff (Reference Goldin and Sokoloff1984) argue that because women and children had relatively lower productivity in agriculture in the Northeast than in the South, they entered the manufacturing labor force in large quantities in the Northeast, which helped develop the northern industrial sector. This logic tenuously suggests that firms with higher female-to-male ratios would be more likely to resemble industrial, factory-style companies and thus operate for longer periods of time.
SEASONALITY AND INDUSTRIAL DEVELOPMENT IN THE RUSSIAN EMPIRE IN CONTEMPORARY ACCOUNTS
Contemporary sources debate the prevalence of part-year operation in the Russian Empire and describe how factory managers handled several peculiar features of the Russian labor market. Though many observers belabor then-fashionable socialist debates over Russia’s stage of development, they help form a picture of factory life in Imperial Russia. For example, socialist economist Tugan-Baranovsky claims that recent evidence has refuted the stereotype of a typical Russian factory worker as “a peasant living on the land who makes up deficiencies of his agricultural income by occasional factory work” and hence refutes the claim that “there is no factory proletariat in Russia” (1970, p. 355).Footnote 13 As evidence of the development of the Russian proletariat, Tugan-Baranovsky cites Dement’iev’s (1897) earlier study of Moscow Province factories in 1884/85. Dement’iev collected exhaustive statistics on the factories he surveyed, painstakingly counting Sundays and holidays to explain that most factories by this period worked essentially full-year with well-justified breaksFootnote 14 and that “only the more primitive factories, where hand labor still prevailed, allowed their workers to depart in the summer” (Johnson Reference Johnson1979, p. 35). Walkin (Reference Walkin1954, pp. 163–4) argues that Tugan-Baranovksy may have been led astray by Dement’iev, who likely exaggerated the degree to which full-year operation prevailed in Russian factories.
Some contemporary accounts indicate that many late nineteenth-century factories worked full year and that workers had severed ties to villages, though some part-year operation endured. For example, the personal accounts of P. Timofeev (first name unknown), who visited urban factories in the early twentieth century recounted that “many skilled workers…have never seen a wooden plow and do not have the slightest idea how to plant wheat because they have lived in a town and worked in a factory for the past twenty-five to thirty years” (Timofeev 1906, quoted in Bonnell (1983, p. 82)). Even in such accounts that predominantly refer to what were likely full-year factories in urban areas, those workers who still had ties to villages sent money to their families in the countryside rather than traveling themselves. Some “would go back there every year or two themselves” (p. 82). Yet accounts of factories operating part-year due to agricultural seasonality appear frequently in the literature. Tugan-Baranovsky describes how, for example, at Prince Bariatinskii’s woolen-cloth mill in Pronsk district, Riazan’ Province, as well as in Okulov’s woolen-cloth mill in Skopin district, workers were routinely released for two months a year to participate in agriculture (Tugan-Baranovsky Reference Tugan-Baranovsky1970, p. 83). Resolving this debate about the prevalence and economic importance of part-year operation in Russia requires the kind of comprehensive factory-level data our study provides.
Part-year operation’s impact on factory productivity frustrated factory managers, who viewed full-time operation as an outcome of effective factory discipline.Footnote 15 To factory managers, workers’ return migration to home villages for seasonal agricultural work “delayed the workers’ full commitment to factory life, promoted labor instability and unreliability, and hampered the development of industrial skills” (Rimlinger Reference Rimlinger1960, p. 71). Managers’ strategies for coping with this particular problem of discipline included locking factory gates and setting strict rules for who could visit factory workers (p. 71). Some managers may have offered positive inducements like wage bonuses to keep workers from leaving in the summer, though the historical record does not reflect widespread use of this practice.Footnote 16 Russia’s agricultural institutions and how they evolved over time made this type of factory discipline problem particularly acute in Imperial Russia.
Seasonality in Russian factories impacted women and men differently within the household, which may have affected the relationship between part-year operation and labor force composition. In many accounts, when men left rural households during slow agricultural seasons to work in factories, women staying at home had to both perform their own tasks and their husbands’.Footnote 17 Female factory workers tended to be young and unmarried, widowed, or permanently settled in urban areas.Footnote 18 We investigated whether women and children tended to work in factories that operated more days annually or whether they tended to be employed in part-year factories facing labor scarcities.Footnote 19
FACTORY-LEVEL DATA AND AN OVERVIEW OF PART-YEAR OPERATION IN RUSSIA
Uniquely detailed data provided by the 1894 Russian Manufacturing Census (Russian Factory Production: List of Factories and Plants 1897) allows us to study the relationships among part-year operation, work-force composition, and production technology in the Russian Empire. The 1894 manufacturing data provides a factory-level snapshot of industrial activity in the Russian Empire at the end of the nineteenth century.
The database covers all industrial factories (i.e., no mines, farms, or oil refineries) in the Russian Empire during 1894/95, where a factory is defined as a productive entity with at least 15 employees, a steam boiler, a steam engine, or other factory devices.Footnote 20 In other words, even a very small factory that otherwise met this definition by having factory tools or otherwise resembling a factory would be included. Indeed, the source’s authors seemed to interpret this criterion broadly: many factories with fewer than 15 employees and no listed machines appear in the census volumes. However, we acknowledge that our analysis only characterizes factories and thus excludes the multitude of small, handicraft establishments that likely represented a large share of Imperial Russian employment.Footnote 21 Given the patterns we observe for factories, we expect that such handicraft establishments may have been even more likely to work part-year, so our estimates likely represent a lower bound picture of the prevalence and importance of part-year operation in Russia.
Crucially, the database provides the number of days a factory worked in that year, our indicator of part-year operation. A shortcoming of this variable is the lack of information on working hours, which would provide a more exact measurement of total annual working time.Footnote 22 The database also lists a factory’s name; street address, which indicates the factory’s district location and whether the factory is located within or outside of a city;Footnote 23 a complete list of production activities and products; number of workers by age and gender; types and power of all machines; fuels; and total revenue. In the data, the number of workers denotes the average of the total workforce in the factory each month the factory operated.Footnote 24 This measure therefore gives us a good indication of the factory’s scale while fully operational, which is our main focus, even if it does not precisely measure the labor input in a production function sense.Footnote 25
In the analysis that follows, we use total machine power as a proxy for the value of the kind of capital relevant to our story of part-year operation. To verify the correspondence of machine power to capital value, we can examine those factories for which the total value of capital is available: factories owned by corporations. We have matched corporate factories in the 1894 data to the RUSCORP Database (Owen Reference Owen1992). For these 545 factories, total machine power in the factory is correlated with the corporation’s total par value of capital (STCAP): the correlation coefficient is .1978, and in a regression of capital on total machine power, the estimated slope is .52 with a standard error of .11. Thus, total machine power and total value of capital are strongly related, at least for corporate factories, though total value of capital included additional components.
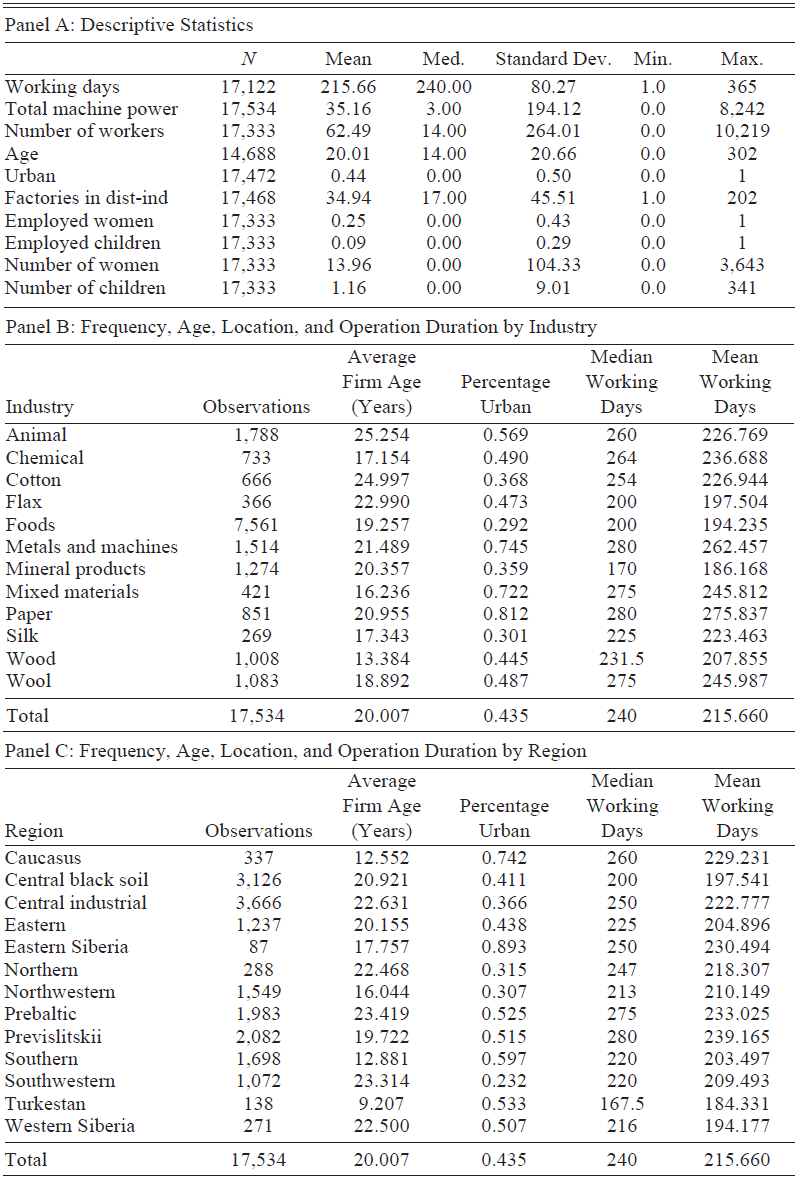
Table 1 Panel A displays descriptive statistics of key variables, including the number of days worked in a year, which we will use for most analyses in the paper. We will nonetheless focus several analyses on factories working more or less than the median number of days in each industry and region combination, which can be thought of as our definition of “full-year operation.” This is similar in spirit to Dement’iev’s (1897) approach since he also relied on empirical notions of full-time operation.
AN OVERVIEW OF THE FACTORY DATA AND OPERATION DURATION

Notes: Total Machine Power is the factory’s total horsepower. Factories in dist-ind is the number of factories located in the same district and industry.
Source: Ministry of Finance, List of Factories and Plants (1897).
Table 1 Panel B breaks down part-year operation by industry. Given the large variation in working days per year by industry, we include industry controls whenever possible. Panel B also demonstrates that, generally, more mechanized industries like metals and machines, cotton, and chemicals tended to operate more days per year. Unsurprisingly, the least seasonal industries, like paper, tended to consist of factories mostly located in cities. Table 1 Panel C repeats this exercise by region.Footnote 26 We find less variation in the number of working days by region than we do by industry, but some patterns exist. Factories located in northern regions, where the climate was harsher and less conducive to agriculture, tended to work more days per year than factories in the warmer and more fertile south. Thus, we also include region controls in most of our regressions.
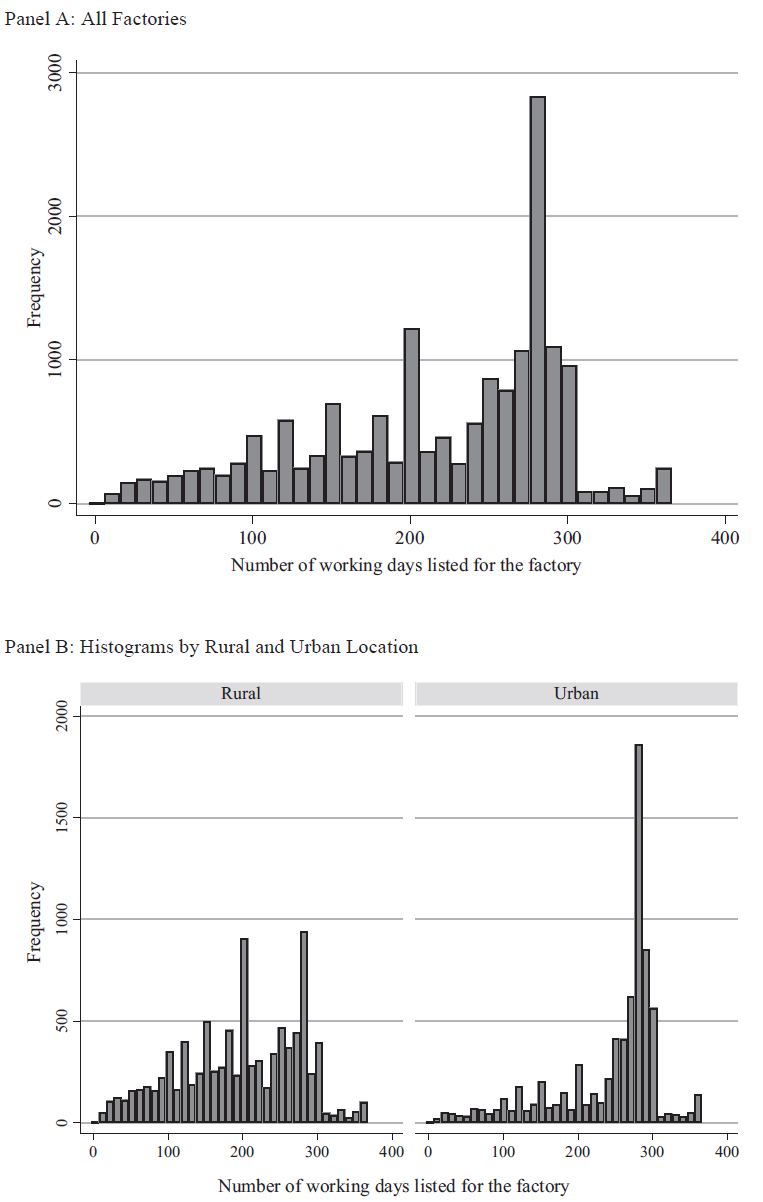
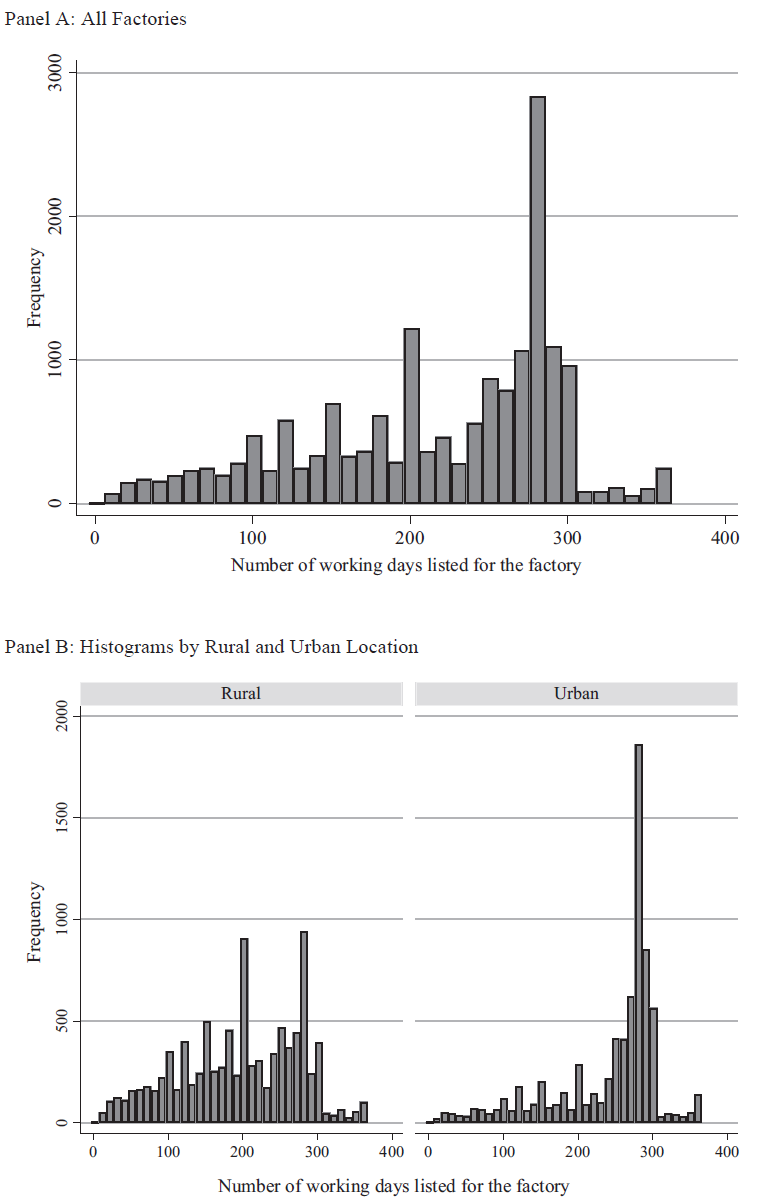
Figure 1 Panel A reports a histogram for the number of working days in the factory per year, which shows considerable variation in the number of working days. We also observe some heaping, particularly at 100 days, 200 days, and 270 days, which would correspond to one season, two seasons, and full-time operation. Panel B of this figure displays separate histograms for factories located in cities (gorodi) versus in rural areas (uezdi). Urban factories tended to work more days than rural factories; a large mass of rural factories operated fewer than 250 days.
HISTOGRAM OF TOTAL WORKING DAYS
Source: Ministry of Finance, List of Factories and Plants (1897).
For some analyses, we also match the factories in our database to another manufacturing census that covers all of European Russia in 1900 (List of Factories and Plants of European Russia 1903). Factories are hand-matched by name, industry, and province. The 1900 source does not record information about factories’ working days per year, but we can use the source to test whether factories in European Russia that worked more days per year are more likely to survive and be recorded in the later manufacturing census. The 1900 census also generated an aggregate volume (Statistical Results on Factories and Plants by Industries Not Subject to the Excise Tax for 1900 1903) that provides some additional variables at the province-industry level, including the wage rates we use in some analyses.
The 1894 and 1900 factory lists are quite similar, as both of their creators attempted to capture information on all factory establishments in Russia,Footnote 27 though there are two important differences between them: the 1900 list includes only factories in European Russia, and the 1894 list seems to include more small enterprises. Otherwise, the criteria for inclusion in the data were almost the same for both sources. The 1900 census excludes factories with fewer than 15 workers that did not use mechanical motors or had a general “handicraft character,” equivalently to the 1894 census. And similar to the 1894 census, in many cases, the line between factories and handicraft establishments was rather blurry, though the 1894 data seemed to have included more factories below the 15-worker threshold.Footnote 28 In our survival analysis, we thus exclude 1894 factories outside European Russia and those with fewer than 15 workers to bring these sources to close parity. Although excluding firms with fewer than 15 workers would mean excluding a considerable number of smaller establishments, we believe we can still observe a meaningful effect of size on factory survival, even if the conclusions can only definitively be applied to larger establishments.
HYPOTHESES AND EMPIRICAL METHODS
Our study seeks to understand Russia’s industrial development at a moment in transition. We thus make two sets of predictions. First, we relate a factory’s working days to observable factory characteristics, particularly location, age, machinery, and labor force composition. Here we partly replicate Atack, Bateman, and Margo (Reference Atack, Bateman and Margo2002) to form comparisons with the better-known United States context. Second, we consider part-year operation as a transitional feature of Russian agriculture and test whether operating more days per year was associated with greater productive efficiency and the likelihood of survival. We also attempt to draw connections between the intensity of agricultural activity in a region and the likelihood of factories there operating fewer days. Though our results will be correlational, they support a particular narrative of part-year operation in Russia.
We argue that factories stayed open only part-year primarily because of labor market constraints due to seasonal agriculture, which has several implications for how part-year factories operate. First, and most simply, factories that operate part-year will be more likely to be located in rural districts rather than cities. Furthermore, we will investigate whether factories located near other factories, especially in the same industry, may take advantage of denser labor markets and operate more days per year. And given the many systematic differences across regions shown in Table 1, perhaps due to the timing of seasons and the degree of industrial development or concentration, our analyses will include controls for regional location.
Next, we investigate the relationship between working time and factory age. Because we hypothesize that part-year operation is costly, we predict that factories operating fewer days a year will be younger, because they will tend to fail at higher rates. Factories operating more days a year will be older and may appear to perform better simply due to survivorship bias.
To further investigate the relationship between operating days and the labor market, we also examine factory wages, as permitted by the available source, the 1900 province-industry aggregates. We hypothesize that, while factories that operate more days per year may pay higher total wages, factories experiencing the kind of tight labor market that would force them to operate part-year may also have to compensate workers at a higher wage per day rate (similar to predictions made in Atack, Bateman, and Margo Reference Atack, Bateman and Margo2002).
Furthermore, factories that operated part-year would have to leave any fixed capital, for example, large machines, idle when they did not operate. A factory manager could lessen the impact of a large machine purchase on the factory’s average total cost by staying open and producing more units.Footnote 29 Shutting down and restarting machines after long idle periods may also be a costly process in and of itself. Thus, we predict a positive relationship between the number of days per year a factory works and the factory’s use of expensive, powerful machines. Likewise, factories with less expensive machinery were probably more likely to release workers to agriculture and shut down for part of the year. In the analysis that follows, we will only consider capital invested in machines and then only measure it as total power and not as a ruble value, so we acknowledge that we only capture a portion of a factory’s relevant fixed capital for the shut-down decision. Also, given the important differences in production technologies across industries, which likely underlie the patterns shown in Table 1, our analyses will include controls for industry.
Further, we can make a strong prediction about the level of capital (as measured by machine power) in the factory, but the hypothesized relationship with capital intensity seems ambiguous. Total working days may be positively related to the total machine power in the factory since machine power left idle is costly. Total working days may also be related to the factory’s overall capital intensity (machine power per worker or per unit of revenue) if factories that operated part-year would use less capital to produce the same amount of output. If part-year operation placed a constraint on the overall size of the factory, we may see a relationship with the size of total capital but not capital intensity. In fact, part-year operating factories may appear more capital-intensive if they are unable to substitute labor for capital as much as they would like.
Operating full-year vs. part-year may also have been related to the factory’s labor force composition, since part-year operation may have reflected constraints on the labor market. However, the direction of the relationship is somewhat ambiguous. Part-year factories located in the countryside may have chosen to employ women and children otherwise idle during the agricultural off-season. On the other hand, women who lived in cities may have had the opportunity to spend more time at manufacturing firms as they would have had no responsibilities related to agriculture.Footnote 30 Furthermore, urban factories may have been larger and more mechanized, which facilitates employing women and children due to division of labor.Footnote 31 Thus, interactions among urban location, size, and machinery may be relevant to the relationship between labor force composition and working days.
Most likely, factories determined their schedule of working time as well as other features of operations like location, size, and mechanization simultaneously. It would be impossible to determine, for example, whether a rural factory was forced to shut down for part of the year or whether a factory that could operate part-year might decide to locate in the countryside. Similarly, we cannot rule out that factories with less expensive machines would find it less costly to shut down, rather than factories that knew they would have to shut down choosing smaller initial total capital. Our investigation, therefore, stresses correlations among these features rather than emphasizing a particular causal argument.
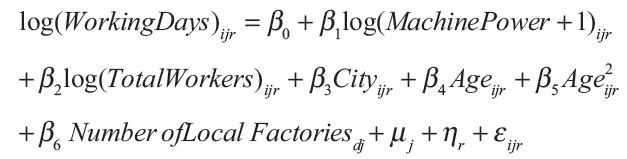
Furthermore, our paper emphasizes supply-side pressures on factories to operate full-year or part-year, which we argue is a first-order concern for Russian factories. We acknowledge, however, that there are other reasons, apart from these, for factories to operate part-year. For example, demand for certain products like building materials or certain kinds of food products may have been seasonal, or factories in certain industries like lumber would have operated seasonally for other reasons related to the production process. For these reasons, we include region and industry controls whenever possible, and we argue that the processes we describe characterize decisions made by a typical Russian factory but do not represent a universal explanation of part-year operation. Finally, we note that our argument does not assume the possibility of migration, which would only lessen the labor market pressures we may see reflected in our results. To test these hypotheses, we first consider a series of two-sample and two-proportion hypothesis tests comparing full-year and part-year factories. Then, we consider regressions of the form:
 $$\eqalign{
& {\rm{log(}}Working{\rm{ }}Days{{\rm{)}}_{ijr}} = {\beta _0} + {\beta _1}\log {(Machine\,Power\, + \,1)_{ijr}} \cr
& + {\beta _2}\log {(Total\,Workers)_{ijr}} + {\beta _3}Cit{y_{ijr}} + {\beta _4}Ag{e_{ijr}} + {\beta _5}Age_{ijr}^2 \cr
& + {\beta _6}\,Number\,of\,Local\,Factorie{s_{dj}} + {\mu _j} + {\eta _r} + {\varepsilon _{ijr}} \cr} $$
This regression estimates the correlation between the number of working days in factory i in industry j, district d, and region r and the factory’s quantity of machinery (as measured by the log of total horse-power plus 1), its size as measured by the log of total workers, whether the factory was located in a city, the factory’s age and age squared, the number of factories in the same district and industry, and controls for industry and region. We estimate the regression with OLS and with a Tobit model right-censored at 6, since ln(365) = 5.90.
Next, we examine the relationship between a factory’s operating time and economic performance. Factories that operated fewer days per year may have paid more fixed costs from starting up and shutting down. Thus, we expect factories that operate more days per year to produce more revenue given the same labor and machine inputs. However, because revenue is measured annually, that relationship is likely to be mechanically true. We also examine, then, whether factories that operated more days per year produced more revenue per day, with or without controlling for inputs. Note that there are doubtless several sources of bias in such an investigation. For example, better managers might have decided to operate continuously and also have implemented more productive processes. We assume that such biases are relatively small.
We also consider whether factories that operated full-year were more likely to survive to 1900. A factory survives if it appears in the 1900 factory census. We expect that factories that operated for a greater proportion of the year may have been more likely to survive. Consider a model of factory exit in which a factory that performs below a certain threshold is more likely to exit the market. Any factory characteristic associated with greater economic efficiency, and hence greater profits, will be associated with a greater probability of survival. Given that full-year operation may have been more productive and more profitable, part-year factories may be more likely to shut down and full-year factories more likely to survive. If an exit is costly, of course, not all factories will exit if they make low profits. Moreover, in this context, many factories might have enjoyed monopoly rents and hence might have made profits despite inefficient methods. Region and industry controls somewhat alleviate differences across markets. We stress, therefore, that while survival is associated with improvements in profitability from operating a greater number of days, factories may survive for reasons other than working time.
We tested whether factories that operated longer were more likely to survive using several approaches. First, we compare the proportion of full-year factories that survive to the proportion of surviving part-year factories, where operating full-year is defined as operating more than the median number of working days in a given Industry-Region cell. Second, we estimate several probit regressions, where the left-hand side variable is the probability that an 1894 factory will appear in 1900.
Finally, we investigate the connections between factory operating times and the agricultural, economic, and political environments in the districts and provinces in which they operate. In regions where the soil was especially fertile and agriculture generated substantial revenue, factories may have been more likely to shut down during part of the year. Sokoloff and Dollar (Reference Sokoloff and Dollar1997) show that in regions where grains were more economically important, labor was more likely to be diverted into agriculture because of the high opportunity cost of opting out of agriculture during busy seasons. We explore the relationship between the amount of common seasonal grains procured in a province and the average number of working days in factories in that province. We use data on province-level agricultural output collected by Kessler and Markevich (Reference Kessler and Markevich2020).Footnote 32 We hypothesize that in regions that produced more seasonal grains, such as wheat and rye, or alternatively, in regions with more fertile soil, factories would operate fewer days a year, as workers would be more likely to engage in agriculture in the summer months. We also include controls for total population and proportion of urban population provided by the Ministry of Finance Yearbook data from 1900.
Because many important variables determining factory operating time are likely omitted at the province level, we continue our investigation at the district level. Though district-level crop-specific yields are difficult to find, district-level soil quality is available and provided by Dower et al. (Reference Dower, Finkel, Gehlbach and Nafziger2017 and 2018).Footnote 33 Soil quality may be a better measure since it is less likely to be endogenously determined than yields. While soil quality is a critical determinant of the importance of agriculture, latitude is strongly related to both soil quality and overall weather patterns, while population characteristics capture economic conditions important for determining factory operations. We thus also include district-level latitude, population, urban population, and rural density controls provided by Dower et al. (Reference Dower, Finkel, Gehlbach and Nafziger2018).
Furthermore, we consider two additional potentially important correlates of operating time. First, we test an alternative theory that factories tend to shut down due to work stoppages or strikes, in which factories in districts with many strikes would on average have fewer working days per year.Footnote 34 However, one could also consider a relationship in the opposite direction: a report by Varzar (Reference Varzar1905, pp. 48–50) on the statistics of manufacturing strikes listed longer operating times (in terms of hours) as one of the major reasons behind disturbances, in which case one might expect to find a positive relationship if the workers’ grievances also extended to working days. Given the relatively small number of strikes relative to the number of factories, and given these possible confounding relationships, we expect to observe only a weak relationship, if any, between strikes and working days. We measure the number of strikes at the district-level from chronicles published by Pankratova (Reference Pankratova1950–1963) between the years 1861 and 1894, of which we use the 1890–1894 subset to capture strikes in years relevant to the factories in our dataset. While likely not exhaustive, this is the best data source documenting strikes in the early 1890s known to us.Footnote 35 Finally, we divide the number of strikes by the number of factory workers to ensure that our measure of strikes is not simply capturing the location of industrial clusters.
Second, we tie our work to discussions of Russia’s agricultural institutions by testing whether a higher share of land belonging to repartition communes in a district would be negatively related to factory working days in that district. Repartition communes could periodically redistribute land among peasants based on the size of the household and how well the household met obligations, which would have been a strong incentive for laborers to leave factory work in the summer and rejoin families in the countryside.Footnote 36 We hypothesize a similar negative relationship between the share of total land for any type of commune and working days. The data on communes come from Dower et al. (Reference Dower, Finkel, Gehlbach and Nafziger2018), in the spirit of Chernina, Dower, and Markevich (Reference Chernina, Dower and Markevich2014). Note that all agricultural, demographic, social disturbance, and commune land data are only available for European Russia.
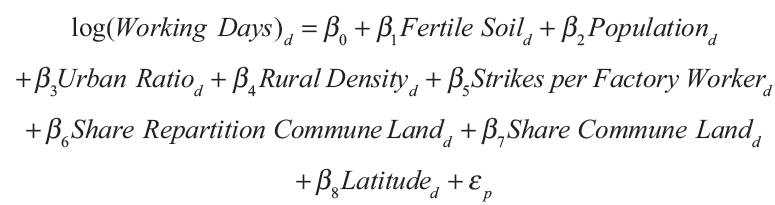
For district d, we estimate:
 $$\eqalign{
& {\rm{log(}}Working{\rm{ }}Days{{\rm{)}}_{ijr}} = {\beta _0} + {\beta _1}\,Fertile\,Soi{l_d} + {\beta _2}Populatio{n_d} \cr
& + {\beta _2}Urban\,Rati{o_d} + {\beta _4}Rural\,Densit{y_d} + {\beta _5}Strikes\,per\,Factory\,{Worker_d} \cr
& + {\beta _6}\,Share{\mathop{\rm Re}\nolimits} partition\,Commune\,Lan{d_d} + {\beta _7}Share\,Commune\,Lan{d_d} \cr
& \,\,\,\,\,\,\,\,\,\,\,\,\,\,\,\,\,\,\,\,\,\,\,\,\,\,\,\,\,\,\,\,\,\,\,\,\,\,\,\,\,\,\,\,\,\,\,\,\,\,\,\, + {\beta _8}Latitud{e_d} + {\varepsilon _p} \cr} $$
Fertile Soil takes the value of the proportion of fertile soil in a district. Urban Ratio is the ratio of urban population to the whole population of a district. Rural Density is calculated as rural population over arable land.Footnote 37 Strikes per Factory Worker is the sum of the number of factory disturbances by district in the years 1890–1894 divided by the number of factory workers in the district. Share Repartition Commune Land takes the value of the share of repartition communes to total communal land in a district, while Share Commune Land is the share of commune land to total land in a district.Footnote 38
RESULTS
Firm Characteristics and Operating Time
This section presents what we can learn about the relationship between factory characteristics and operating time from our newly-collected, highly detailed factory microdata. Replication materials for this study are available at Gregg and Matiashvili (2022).
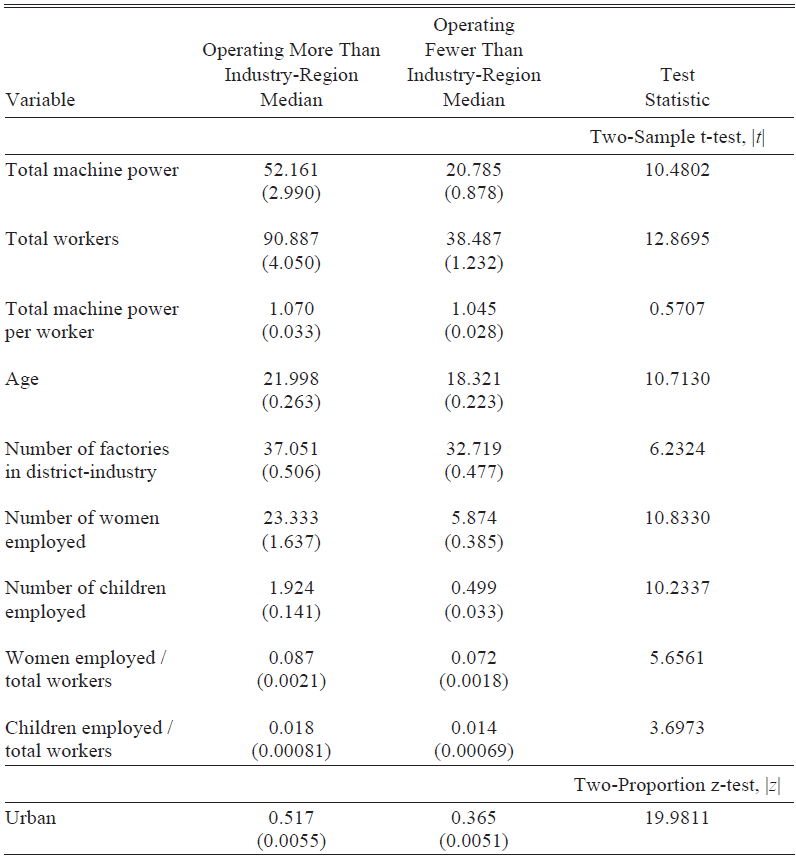
Table 2 documents a set of compelling differences between factories that operated full-year and those that operated part-year. Factories that operated more than their Industry-Region median tended to have more powerful machines, to have more workers, to be older, and to employ a greater number of women and children. Since full-year factories tended to have larger workforces, factories operating fewer days than their Industry-Region median had similar levels of machine power per worker. Furthermore, full-year factories may have only employed more women and children because their overall workforces were larger. But full-year factories did employ larger proportions of women and children out of their total workforces. Full-year factories were also more likely to be located in cities and tended to have more neighboring factories in the same district and industry. Each of these results, however, describes unconditional means. Size is likely correlated with urban location, for example, so full-year factories might only be larger because they were located in cities. We thus proceed to regression models, which allow us to introduce relevant controls for size, industry, and location and to investigate other simultaneous relationships.
OPERATION DURATION AND FIRM CHARACTERISTICS
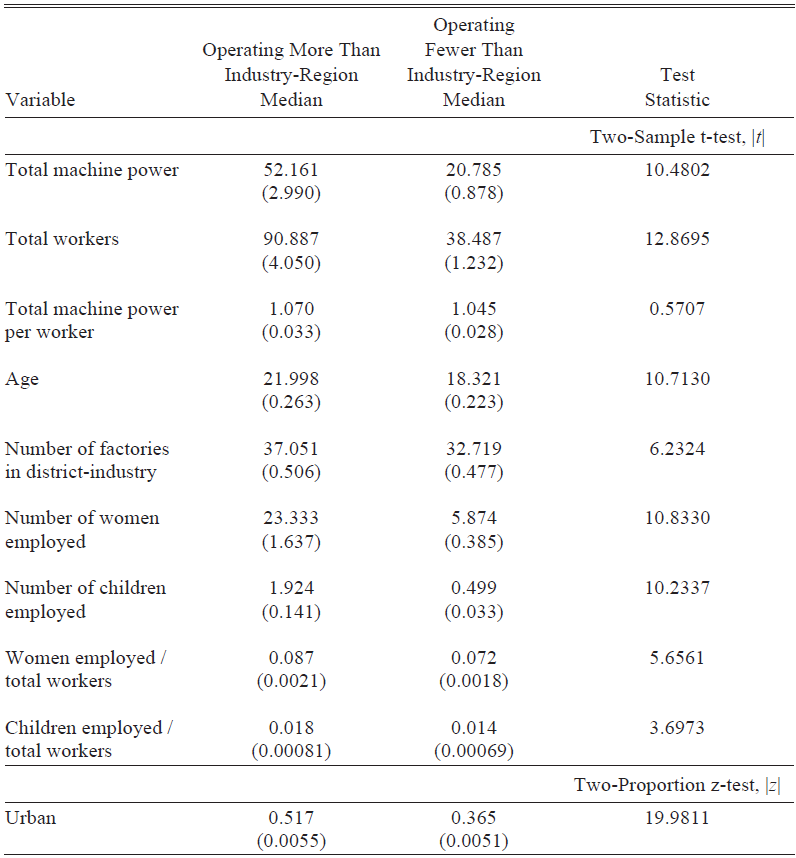
Notes: Total machine power measures the total amount of horsepower in a factory. Number of factories in district-industry is the number of factories in the same district and industry. Standard errors in parentheses.
Source: Ministry of Finance, List of Factories and Plants (1897).
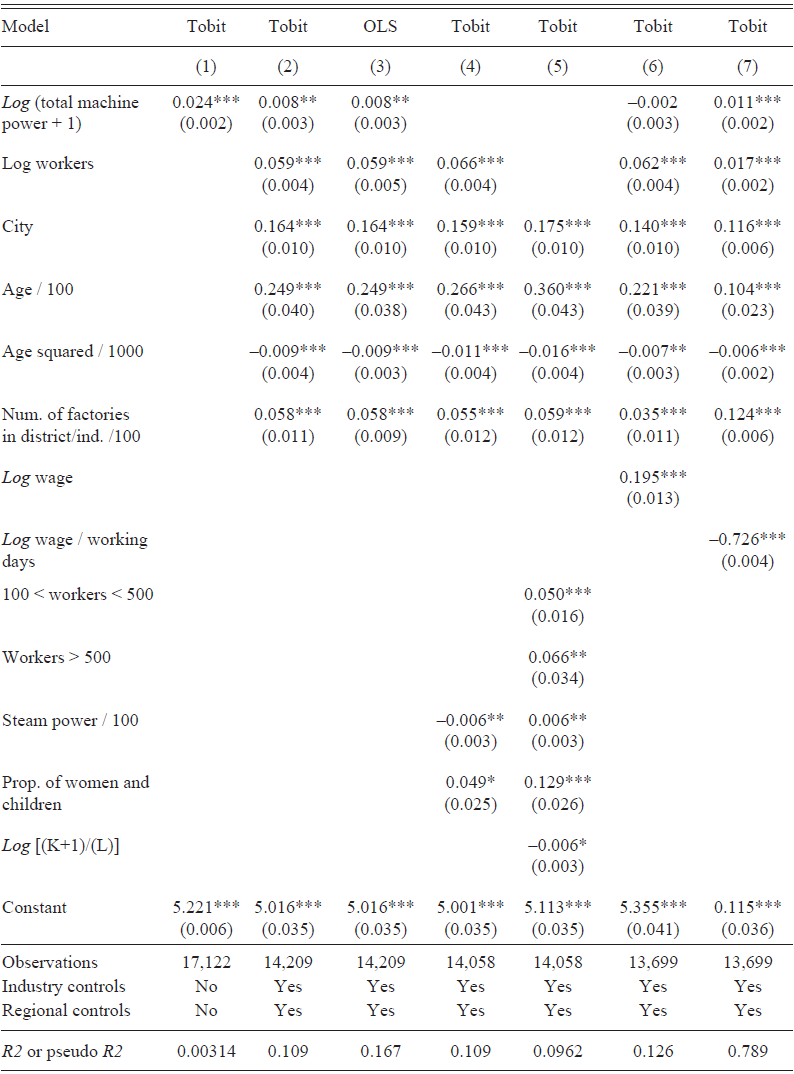
We present regressions describing a factory’s days of operation in Table 3. Most columns present tobit regressions right-censored at ln(365), though we also include one OLS regression for robustness. Column (1) presents an unconditional regression of log working days on machine power, and we find a strong, positive relationship. Factories that operated more days per year tended to possess more total machine power. The next column introduces the additional independent variables of age, age squared, city vs. rural location, the number of factories in the same district and industry, and controls for industry and region. The decrease in sample size between these two columns is largely due to some factories missing age data. In line with our predictions, we find that machine power, labor, urban location, and the number of neighboring factoriesFootnote 39 are positively related to working days of a firm. The OLS regression presented in Column (3) demonstrates similar relationships.Footnote 40
FIRM CHARACTERISTICS AND OPERATING TIME
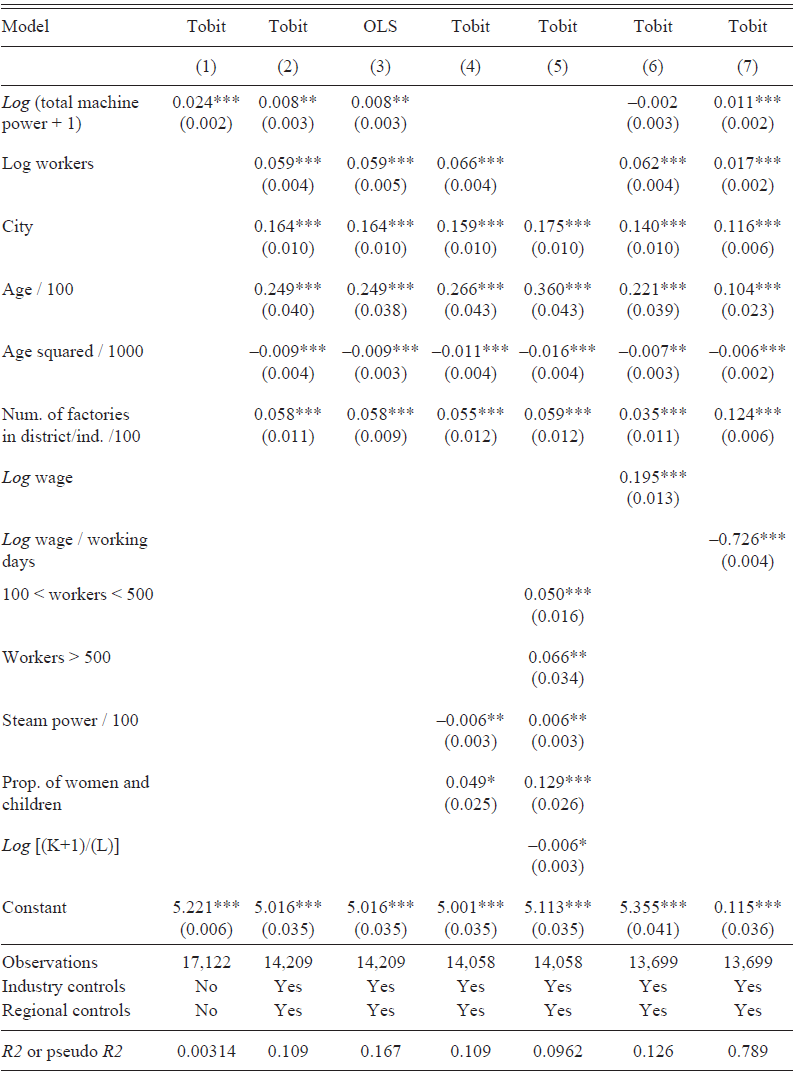
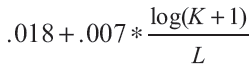
Notes: *** p < 0.01, ** p < 0.05, * p < 0.1. Standard errors in parentheses (robust standard errors in Column (3)). The outcome variable is the log of the factory’s number of working days. The Tobit model in all regressions is right censored at 6, because log(365) is approximately equal to 6. Log (K+1)/L is the log of total machine power plus one divided by total workers.
Sources: Ministry of Finance, List of Factories and Plants (1897), and Ministry of Finance, Statistical Results on Factories and Plants by Industries Not Subject to the Excise Tax for 1900 (1903).
Table 3 also includes a replication of the Tobit model employed by Atack, Bateman, and Margo (Reference Atack, Bateman and Margo2002), which regresses operating time measured in full-time equivalent months in 1870 and 1880 on measures of size, capital intensity, steam power, female and child employment, and location. Our findings, reported in Column (5), closely mirror their results: log of working days is positively related to size and urban location. However, we find that steam horsepower and employing women and children are positively related to working days per year, where they found negative relationships. The negative coefficient on steam horse-power they found deviated from their original hypothesis. We are likely able to distinguish the relationship with steam power more clearly given the greater variation in working days compared to their measure of full-time equivalent months.Footnote 41 Also, they had found a negative relationship between working days and female or child employment, which they speculated could be due to female preferences for “lumpy” downtime and children’s school attendance.Footnote 42 The labor market for women and children was likely markedly different in Russia. Few children, for example, attended school.Footnote 43 Furthermore, as we show later, female employment is positively correlated with urban location in the Russian context.
Finally, Table 3 Columns (6) and (7) consider the relationship between working days and factory wages. Here we measure wages using the 1900 aggregate volume as the average total wage bill per establishment at the province-industry level divided by the average number of workers in that province-industry cell. Because the 1900 aggregate volume only covers European Russian provinces, several hundred observations are dropped from these regressions.Footnote 44 Similar to the result shown in Atack, Bateman, and Margo (Reference Atack, Bateman and Margo2002), we find that while factories with more working days also tended to be located in provinces and industries with higher average wages, factories that worked fewer days were likely paid more per day. Factories with fewer working days somewhat compensated workers for the factory’s downtime.
Our replication results are of significance for two reasons. First, though Russian industry in 1894–1900 lagged far behind that of the United States in 1870–1880, we observe identical processes taking place in the two contexts. Second, we can complement the U.S. findings by using more detailed working day information to establish the expected relationship between working days and steam horsepower, as well as to show how differences in labor markets affect the relationship between working days and labor force composition.
Firm Characteristics, Productivity, and Survival
If full-year operation was more efficient than part-year operation, factories that worked more days per year would have been more productive. In this section, we test whether a factory’s number of working days was correlated with productivity, measured in three ways: revenue per worker; total factor productivity (calculated as the residual of a log Cobb-Douglas production function); and revenue per day. It may be the case that more efficient factories operated for longer durations or that efficiency and operating time were determined simultaneously, so we do not stress a particular causal direction.
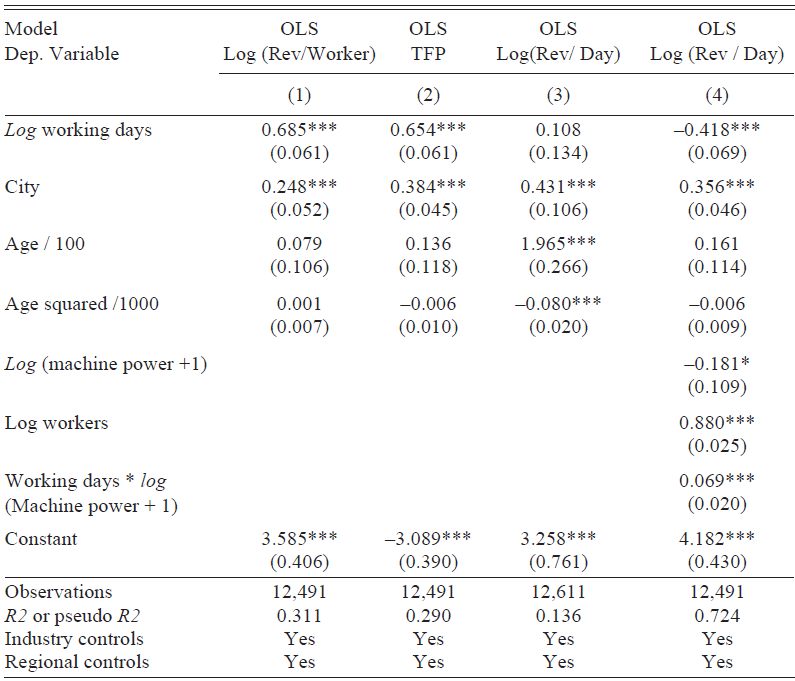
Table 4’s first three columns examine the relationship between productivity and log working days.Footnote 45 All three columns include controls for region, industry, factory age and age squared, and whether the factory is located in a rural or urban location. Still, factories that operated for more working days were more productive, whether productivity is defined as revenue per worker, total factor productivity, or working days per year.Footnote 46
CORRELATES OF OPERATION DURATION AND REVENUE PER WORKING DAY
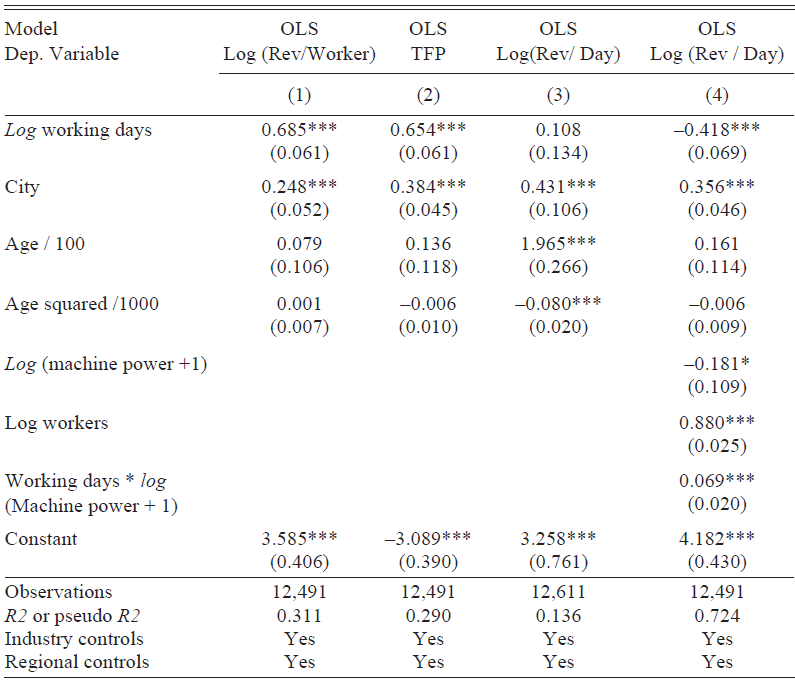
Notes: *** p < 0.01, ** p < 0.05, *p < .10. Standard errors clustered by Industry-Region groups in parentheses.
Source: Ministry of Finance, List of Factories and Plants (1897).
The final column investigates whether the relationship between revenue per day and log working days can be explained by inputs, especially by the degree of mechanization.Footnote 47 This column regresses log revenue per day on log working days, total machine power, total workers, an interaction between log total machine power and log working days, and controls for urban location and age. Given the input controls, the relationship between overall working days and revenue per day appears to be negative. In other words, given two factories with identical machinery, the factory that works more days per year does not produce more revenue per day. However, the coefficient of the interaction between total machine power and working days is positive and significant. Factories that work more days per year experience an extra increase in revenue per year if they also add machine power. Working time and machinery are thus complementary in this context. Note that the effect of total machine power itself is negative, which is due to the fact that we are looking at daily, rather than total revenue. The same regression model with annual revenue as the outcome variable yields a positive relationship.
We thus proceed by testing whether factories that operated more days per year were more likely to survive to 1900 than factories that operated part-year. We hypothesize that fewer part-year factories survived to 1900 because part-year operation was less efficient and thus less profitable. Our results show that, indeed, full-year factories were more likely to survive to 1900.
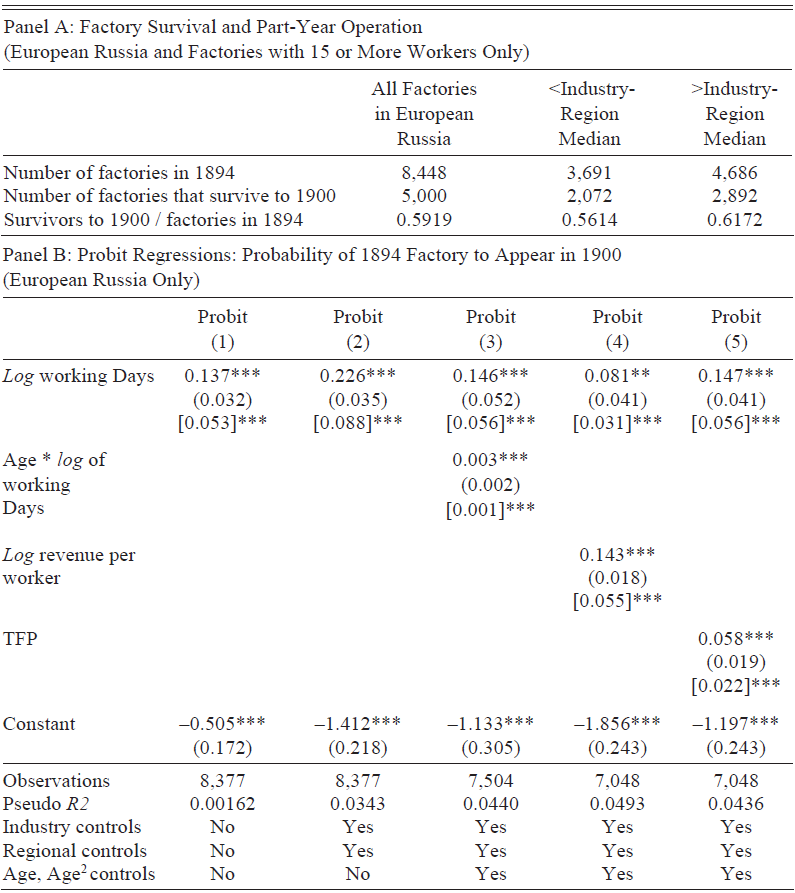
Table 5 Panel A displays survival rates from the 1894 to the 1900 manufacturing census both overall and broken down by full-year vs. part-year operation. To achieve parity between the 1894 and 1900 factory surveys, these results omit factories located outside of European Russia, factories engaged in specific activities excluded by the 1900 survey, and factories with fewer than 15 workers.Footnote 48 Overall, 59.19 percent of such factories in the 1894 census can be matched to the 1900 census. While 61.72 percent of full-year operating factories survived, only 56.14 percent of part-year factories did.Footnote 49 Panel B presents estimates of probit regressions, which allow for the introduction of additional controls. These regressions only include 1894 factories, where the dependent variable is the probability of survival to 1900. Column (1) reports an unconditional regression, Column (2) includes industry and region controls, Column (3) includes controls for age, age squared, and an interaction between age and log working days to further examine the relationship between survival and age, and Column (4) includes log Revenue per Worker to discern in part whether survival differences are entirely due to differences in labor productivity.Footnote 50 Finally, Column (5) includes a measure of TFP to discern whether the survival differences are due to differences in the efficient use of labor or machinery.
FACTORY WORKING DAYS AND SURVIVAL TO 1900
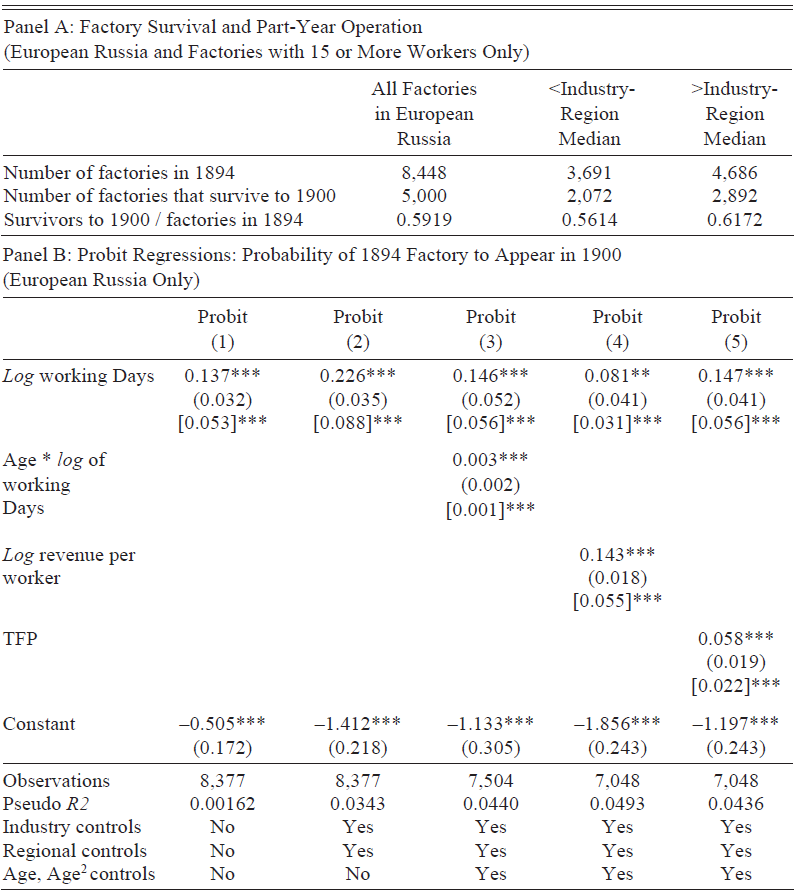
Notes: *** p < 0.01, ** p < 0.05, *p < 0.10. Robust standard errors in parentheses. Marginal effects (dprobit) in brackets. Regressions estimate the probability that an 1894 factory appears in the 1900 database. To achieve closer parity with the 1900 database, these regressions omitted factories outside European Russia or with fewer than 15 workers. TFP in Column (5) is the residual of a log Cobb Douglas production function that includes total workers and total machine power as inputs.
Sources: Ministry of Finance, List of Factories and Plants (1897) and Ministry of Finance, List of Factories and Plants (1903).
In all five columns, log working days are strongly and positively related to factory survival to 1900, even when log revenue per worker is included. Moreover, the marginal effects show an economically important difference, given an increase solely in operating time: on average, working 10 percent more days is associated with an increase in the probability of appearing in the 1900 census by 0.53 percentage points (Column (1)), where the survival rate in that regression’s sample was 59.3 percent. Transitioning from the mean number of working days (215) to Dement’iev’s definition of full-time working days (276), is associated on average with an increase in the probability of survival of about 1.51 percentage points, or about a 2.55 percent increase in survival probability.Footnote 51 Moreover, the additional control variables show expected relationships with survival: more productive factories are more likely to survive; younger factories are more fragile (not shown); and the interaction between log working days and age in Column (3) demonstrates that the positive relationship between working days and survival is especially relevant for older factories who have perhaps survived their fragile early years.
There are several caveats to this result. The Russian economy experienced a recession at the turn of the twentieth century, so these survival rates overall might be smaller than they would be otherwise. If part-year factories were more fragile in their response to economic shocks than full-year factories, the recession may have affected part-year factories more than full-year factories, which could have caused us to overestimate the difference in survival rates. Furthermore, since our measure of survival in this case is whether a factory can be matched to 1900, characteristics correlated both with working days and ease of being matched apart from pure survival could bias our results. For example, part-year factories could have been less famous in their localities or could have been out of operation when an enumerator collected data. Finally, part-year factories may have had other characteristics that made them more ephemeral in addition to their inefficiency due to part-year operation alone. However, each of these biases would have to be large and not accounted for by other controls to alter our conclusions.
Given part-year factories were less likely to survive, was part-year operation a disappearing practice in the Russian Empire? Our results suggest that factories faced significant pressure to operate full-year in order to survive. However, entry barriers for new factories to operate full-year or barriers to obtaining characteristics associated with full-year operation, like fixed capital, may have been higher.Footnote 52 Indeed, as we observed in Table 3, a factory’s number of working days is inversely related to age.Footnote 53 Though the 1900 data do not permit us to examine how working days changed over time, we speculate that these young factories may have worked more days as they evolved. Furthermore, we speculate that ongoing changes in the agricultural sector or increasing migration over this period may have created the labor market slack needed for factories to convert to full-year operation.
Female and Child Employment
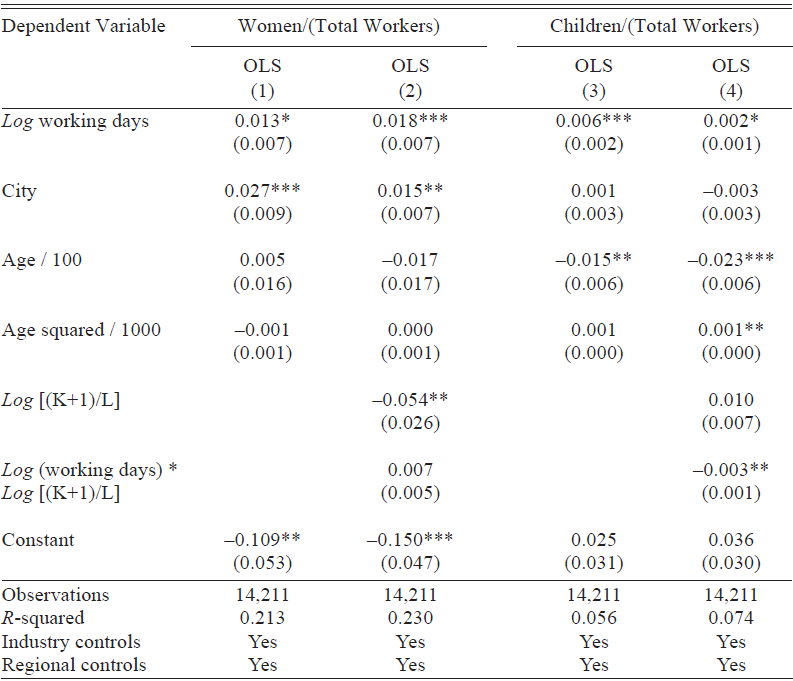
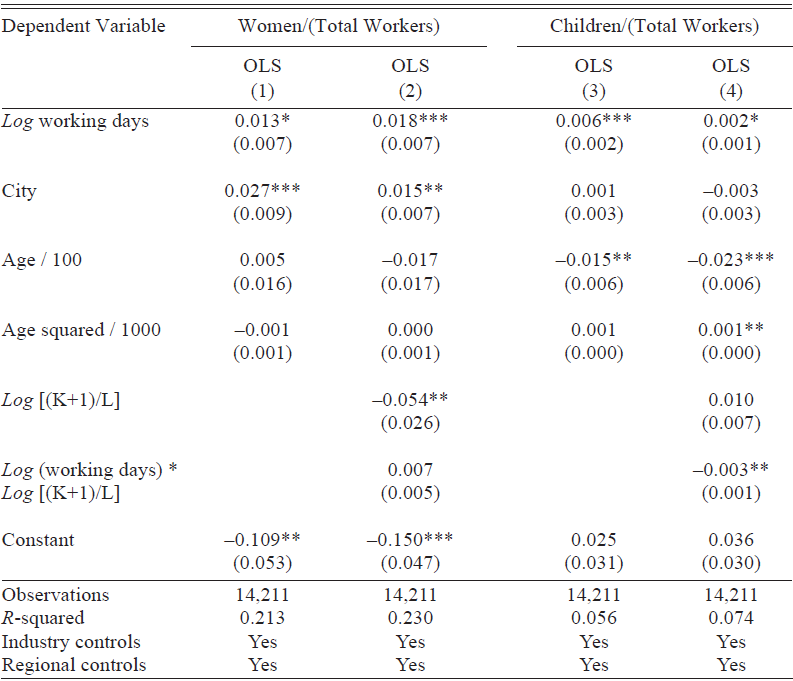
Here we more closely examine the correlates of female employment as a proportion of a factory’s total workforce. Table 6 Column (1) shows that female employment is positively related to urban location and working days. Factory age does not appear to have a strong relationship with whether the factory employs women. These regressions include controls for industry and region, since whether a factory employs women varies greatly by industry and geographic location.
CORRELATES OF FEMALE AND CHILD EMPLOYMENT
Notes: *** p < 0.01, ** p < 0.05, *p < .10. Standard errors clustered by Industry-Region groups in parentheses. Log (K+1)/L is the logarithm of total machine power plus one divided by total workers.
Source: Ministry of Finance, List of Factories and Plants (1897).
Column (2) adds two important independent variables: a proxy for capital intensity, as measured by a factory’s machine power per worker, as well as an interaction term between capital intensity and log working days. Here, the coefficient on capital intensity is negative and statistically significant. When our proxy for capital intensity is the log of total power (plus one) divided by total workers, more capital-intensive factories employ fewer women as a percentage of the total labor force.Footnote 54 This result would contradict a model in which female employment increases as the division of labor is facilitated by the use of more machines per person. However, the coefficient on the interaction term between log working days and capital intensity is positive (though not significant), which implies that factories that worked more days per year and had more capital per unit worker were more likely to employ women. For example, at the median of log capital intensity, we find that increasing working days from 215 to 276 is predicted to change the share of female employment by .00288, while at the 75th percentile of log capital intensity, increasing working days from 215 to 276 would increase the share of female employment by .00504.Footnote 55 This may imply that a traditional division-of-labor explanation for female employment best describes factories that operated full-year, perhaps because such factories worked closer to their productivity frontiers.Footnote 56
Next, we examine similar determinants of child employment in Russian factories. Column (3) estimates the relationship between the proportion of children in the factory and the factory’s log number of working days, location (urban or rural), the factory’s age and age squared, and controls for industry and region. Some differences are apparent compared to the regressions determining female employment. Column (3) shows that factories with a greater number of working days and younger factories were more likely to employ children, while child employment was not related to urban location. We can speculate, perhaps, that families in the countryside faced greater poverty and were thus more likely to send children to the factory. Furthermore, the positive relationship between working days and the proportion of children employed also agrees with the prediction of the model, if a greater number of working days is an indicator of formalization and specialization in the factory. Column (4) proceeds by including measures of factory mechanization: capital intensity measured by log machine power per worker and interaction between the factory’s log working days and capital intensity. Unlike the result for female workers in Column (2), this regression shows that factories with more total machine power per unit worker were somewhat more likely to employ children. However, the coefficient on the interaction term is negative: factories with greater capital intensity that also worked more days per year were no more likely to employ children. For example, at the median of log capital intensity, increasing working days from 215 to 276 increases the share of children employed by .0015. At the 75th percentile of log capital intensity, increasing working days from 215 to 276 increases the proportion of children by only .00056.
The contrasting results of Columns (2) and (4) show that the relationships among employment, working time, and capital intensity differed between female and child workers. While capital-intensive factories tended to employ greater numbers of children, such factories only employed more women if they also worked a greater number of days. We speculate that the relationship between capital intensity and child employment is more unambiguously positive because child labor was only effective in the presence of machines, while men and women may have been closer substitutes.
So far, our analysis has considered the relationships among working days, technology, and labor force composition within factories. We have thus devoted our attention simply to the consequences of working time for life inside the factory. We have not, however, devoted much consideration to the ultimate causes of factory operating time. The next section provides some suggestive evidence of the relationship between agriculture and working time.
Why Did Some Factories Operate Part-Year in the First Place? Soil Quality, Wheat Production, and Other Determinants of Factory Operating Time
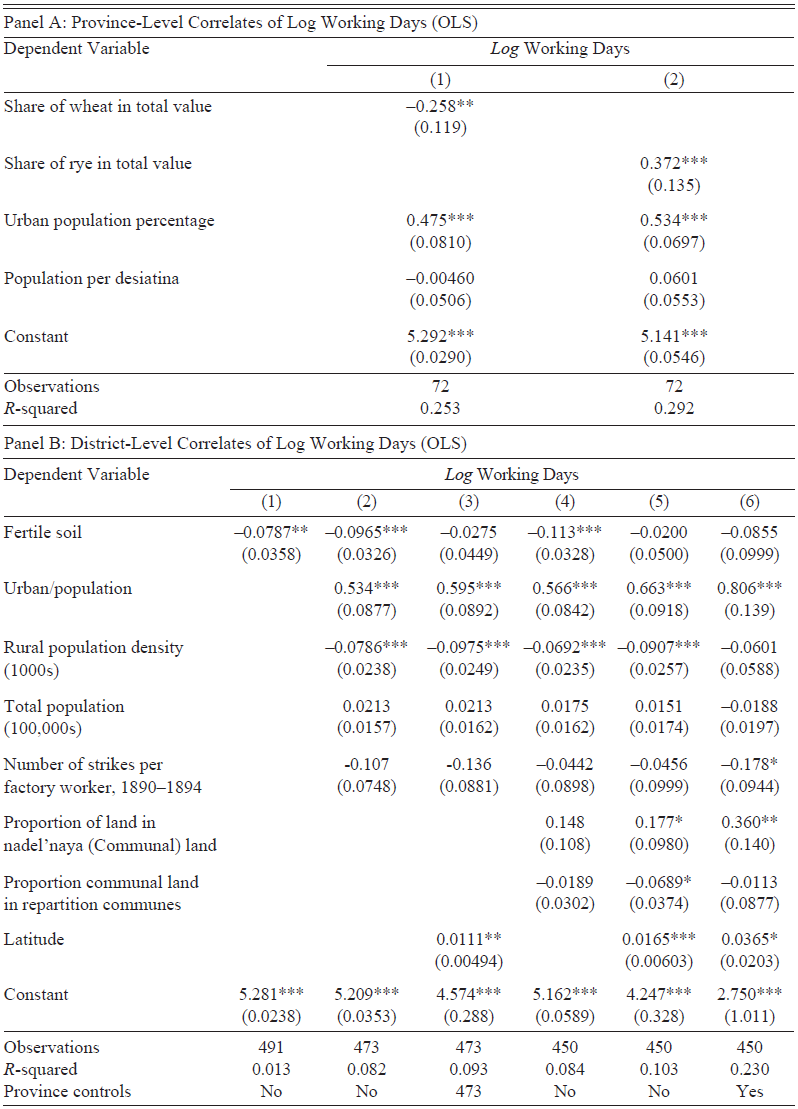
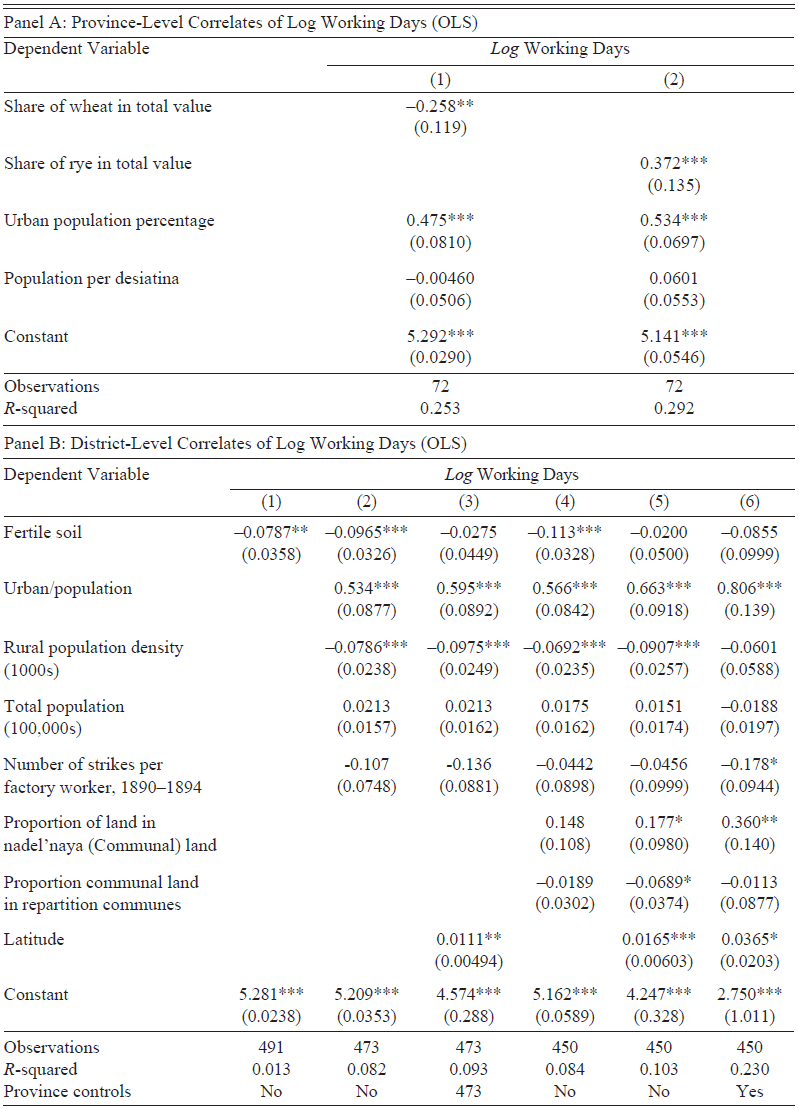
We next investigate how factories’ local conditions are related to their likelihood of shutting down during part of the year. In Table 7, Panel A, Column (1), we observe a strong negative relationship between the amount of wheat as a ratio of total non-animal agricultural production in a province and the average number of working days of factories. However, in Column (2), when we perform a similar analysis with rye, we observe the opposite relationship. We speculate that, while wheat was highly seasonal and produced for wider international markets, rye’s production likely reflected the more general positive relationship between economic activity and local consumption needs.Footnote 57 However, given that each province included multitudes of soil types that determined agricultural fertility, we hesitate to make strong associative inferences between agriculture and industry within such large geographical units.
GRAIN PRODUCTION, SOIL QUALITY, AND TOTAL WORKING DAYS
Notes: *** p < 0.01, ** p < 0.05, * p < 0.1. The figures for urban/rural population and population are from 1883, the figure for arable land used in rural population density calculation is from 1877, and the figures for communal land come from 1905. Rural population density is rural population over arable land. The outcome is the log of total working days of a factory. Robust standard errors in parentheses in Panel A and standard errors clustered by province in parentheses in Panel B.
Sources: Ministry of Finance, List of Factories and Plants (1897) (Panels A and B), Kessler and Markevich (Reference Kessler and Markevich2020) (Panel A), Ezhegodnik ministerstva finansov [Ministry of Finance Yearbook] (1900) (Panel A), Dower et al. (Reference Dower, Finkel, Gehlbach and Nafziger2017) (Panel B), Pankratova (Reference Pankratova1950–1963) (Panel B).
Our next results use district-level measures of soil quality, which we consider an indicator of agricultural suitability.Footnote 58 We report the results in Table 7, Panel B. Column (1) shows, as expected, that a higher proportion of fertile soil in a district is negatively related to the average number of working days of factories in that district. Column (2) adds controls for population, urban population, and rural population density, as well as our measure of strikes to test the alternative hypothesis about industrial disturbances. The coefficient on soil fertility remains negative, statistically significant, and has an even larger magnitude than in Column (1). Total population and the proportion of the urban population are both positively related to working days, although the coefficient on total population is not significant. Rural population density is negatively related to the number of working days. The number of strikes has a negative sign, as one would predict if industrial disturbances forced factories to operate part-year, but is not significant.Footnote 59 Column (3) adds a control for the district’s latitude. Here, the relationship with soil quality is no longer significant. This suggests that latitude encompasses both soil fertility and other climatic nuances that most affect agriculture and, per our conjecture, manufacturing operations.Footnote 60
We next examine how agricultural institutions impacted patterns of part-year operation by considering two variables: the share of all land represented by communal agriculture and the share of communal land represented by repartition communes (those that most greatly penalized peasants who relocated). In Column (4), we add the share of repartition commune land in a district as of 1905. The coefficient is positive but not significant since the variation in the share of repartition commune land in our sample is very small; the median proportion of repartition land to all commune lands was 99.5 percent. The coefficient on the share of commune land is also insignificant. In Column (5), we add the district latitude. We see that while the signs and significance of the demographic variable coefficients stay unchanged, the coefficient on soil fertility loses its significance, while latitude appears to be significantly and positively related to the number of working days, and the communal land and repartition commune coefficients are marginally significant.Footnote 61 Finally, in Column (6), we introduce additional controls for the province in which each district is located, which helps control for other factors districts have in common simply by geographic proximity. Here, latitude, urban density, and communal land share remain positively and significantly related to working time, while the repartition commune share loses significance, and strikes show some relationship to working time.
In the end, we conclude that the average number of working days was related to a location’s overall agricultural suitability, communal agricultural institutions, and disturbances like strikes. In unpacking how communal agriculture impacted working time, we speculate that the overall density of communal agriculture reinforced factories’ ability to maintain a more permanent industrial workforce, though repartition communes limited worker mobility in a manner that diminished the flexibility of local labor markets. Further investigation may consider the relationships among these several labor market obstacles, the limits of Imperial Russian industrialization, and Russia’s 1917 Revolution.
CONCLUSION
Late-nineteenth-century Russian factories provide a snapshot of modernization in progress. Factories located outside of urban labor markets were more likely to shut down during part of the year, and those factories that only operated during part of the year produced output differently than those that operated full-time. Part-year factories were less likely to survive in the long run, suggestive evidence that full-year operation would become the more dominant mode of production. And the tendency of factories to operate part-year across the provinces and districts of the Russian Empire reflected some of the key forces underlying economic development, including urbanization, market integration, institutions, and geography.
Russian factories at this moment thus demonstrated a tendency to transition to a more efficient, more mechanized mode of production in increasingly formal, specialized factories, much like establishments in the United States or Great Britain had at an earlier point in time. Far from approaching some stagnant plateau, even after the most rapid period of growth in the 1880s, the Russian Empire’s industrial sector was growing, changing, and modernizing rapidly. However, barriers to full-year operation remained, and the transition to more efficient operation would have required lessening pressure from the agricultural sector. Though we know significant levels of migration existed, the introduction of agricultural techniques that lessened the impact of peak seasons and more diversified crop portfolios would have also eased the transition to full-year operation.
In this fascinating context, much remains unquantified. A comprehensive study of the relationship between Russia’s primarily agricultural economy and the development of its industrial factories is still needed. Studies that extend beyond our short snapshot to consider, for example, how shocks to the agricultural labor market affected the production technology employed by factories could shed light on some of the most debated questions in Russia’s economic history.