Introduction
Volcanogenic massive sulfide (VMS) deposits are important sources of base and trace metals, supplying 22% of the world's Zn, 6% Cu, 9.7% Pb, 2.2% Au, 8.7% Ag, and significant amounts of trace metals Co, Sn, Se, Mn, Cd, In, Bi, Te, Ga and Ge (Franklin, Reference Franklin, Gibson, Jonasson, Galley, Hedenquist, Thompson, Goldfarb and Richards2005; Galley et al., Reference Galley, Hannington, Jonasson and Goodfellow2007). Despite their economic significance, the distribution and concentration of trace elements remains poorly constrained; this is especially true for critical elements tellurium (Te) and selenium (Se).
Tellurium and Se are extremely scarce in the crust (averaging just 1–4 ppb Te and 50 ppb Se) but are critical components used in photovoltaic solar cells (Grundler et al., Reference Grundler, Brugger, Etschmann, Helm, Liu, Spry, Tian, Testemale and Pring2013; Perkins, Reference Perkins2011). Tellurium and Se are currently produced solely as by-products of Cu refining (Bustamante and Gaustad, Reference Bustamante, Gaustad, Neelameggham, Alam, Oosterhof, Jha and Wang2014; Lu et al., Reference Lu, Chang, Yang and Xie2015). A predicted shift from pyrometallurgical to hydrometallurgical processing techniques accompanying a global decrease in Cu grades is expected to lead to a deficit in supply as hydrometallurgical techniques are not amenable to Te and Se extraction (Lu et al., Reference Lu, Chang, Yang and Xie2015; Moss et al., Reference Moss, Tzimas, Kara, Willis and Kooroshy2013).
Because of the historical difficulties in analysing Te and Se at low concentrations, understanding of their distribution and mechanisms of enrichment in different geological environments remains poor. This includes primary mafic igneous systems and their associated metalliferous VMS deposits. In this paper we explore the distribution of the Te and Se within mafic (‘Cyprus-type') VMS deposits in one of their principal localities: the Troodos ophiolite of Cyprus. This study begins to characterize important processes in Se enrichment in Cyprus-type VMS systems and demonstrates that changes in redox and temperature may be significant in achieving enrichment to thousands of ppm levels.
Regional geology
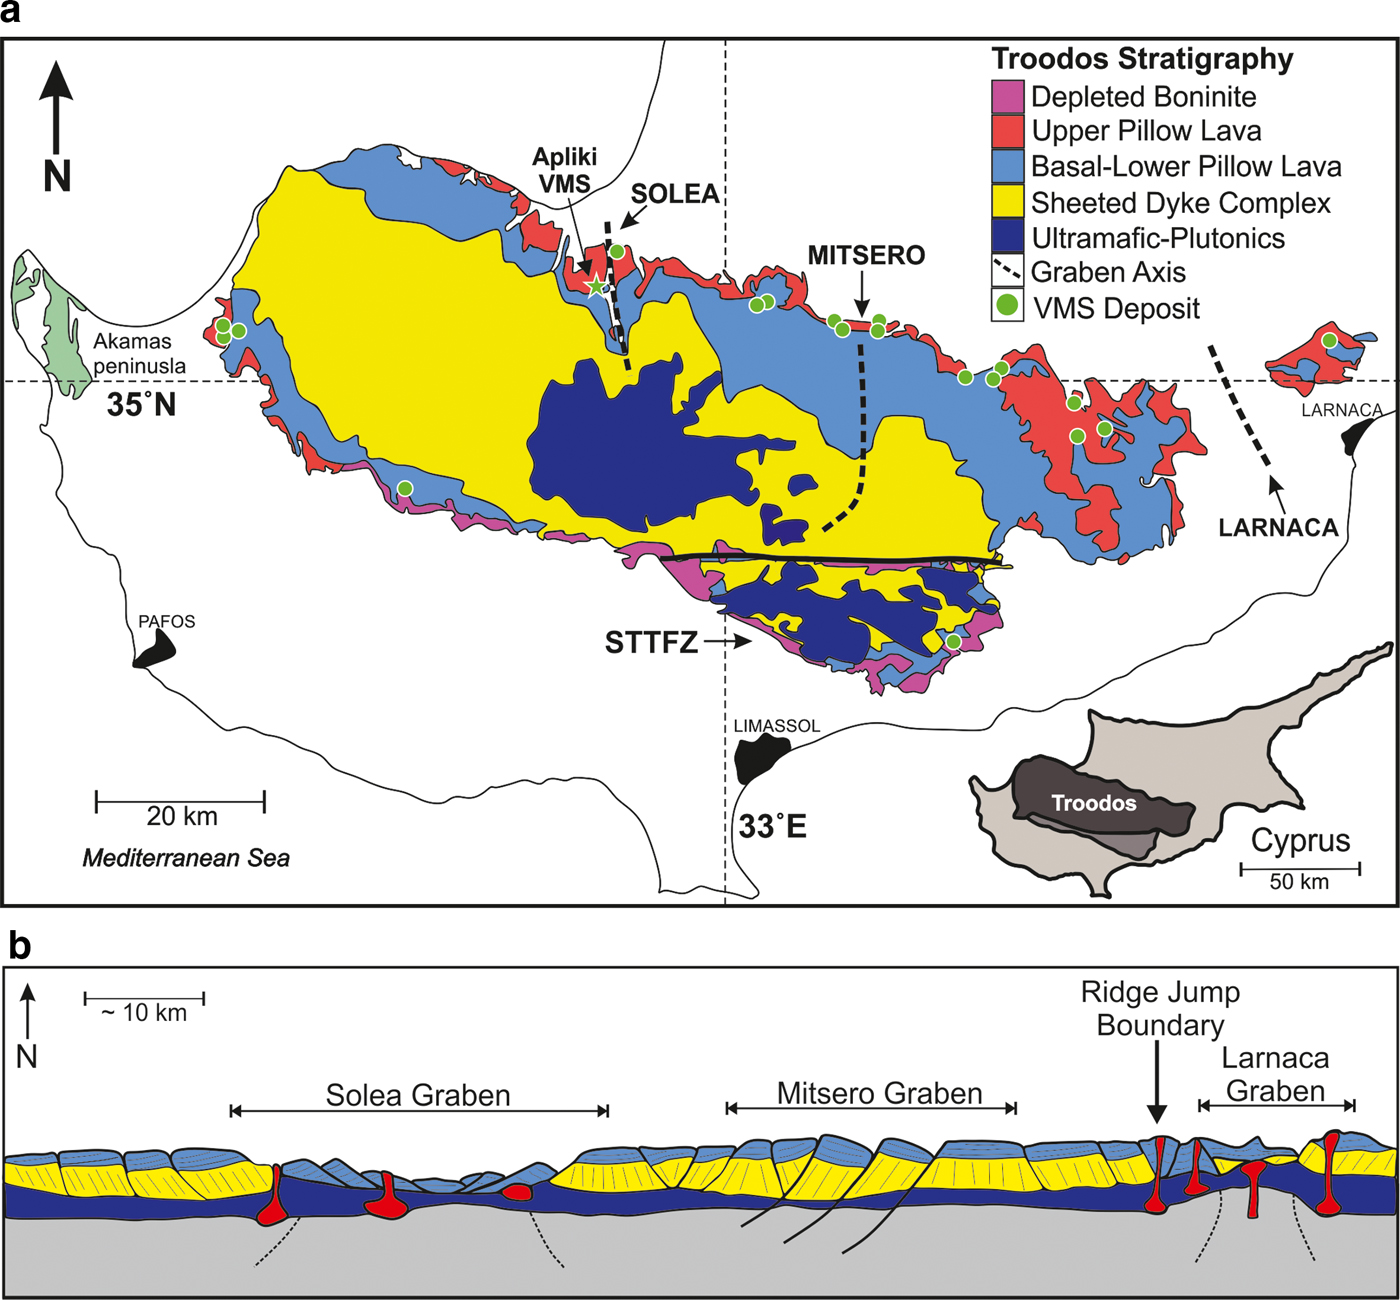
Cyprus is located in the eastern Mediterranean and consists of four main geological terranes: the Kyrenia Range, the Mesaoria plain, the Troodos Massif and (in SW Cyprus) the Mamonia Complex (e.g. Robertson and Xenophontos, Reference Robertson and Xenophontos1993). The Troodos Massif is an ophiolite (Fig. 1a) that represents a fragment of Turonian (~92 Ma) oceanic lithosphere formed during the closure of the Tethys ocean (e.g. Gass et al., Reference Gass1968; Robertson, Reference Robertson2002). Initially Troodos was considered to have formed in a typical (open-ocean) mid-ocean ridge (MOR) environment (Gass, Reference Gass and Panayiotou1980); however geochemical studies of the extrusive section demonstrate a geochemical affinity different from that of N-MORB, instead it is dominated by arc tholeiites and boninites (e.g. Robinson et al., Reference Robinson, Melson, O'Hearn and Schmincke1983; Rautenschlein et al., Reference Rautenschlein, Jenner, Hertogen, Hofmann, Kerrich, Schmincke and White1985; Pearce and Robinson, Reference Pearce and Robinson2010). Whereas it is now widely accepted that Troodos formed in a supra-subduction type setting, the exact nature of its geodynamic setting remains debated (Miyashiro, Reference Miyashiro1973; Pearce et al., Reference Pearce, Lippard, Roberts, Gass, Lippard and Shelton1984; Pearce and Robinson, Reference Pearce and Robinson2010).
(a) Simplified geological map of the late Cretaceous (92 Ma) Troodos ophiolite, Cyprus. Apliki VMS is located in NW Troodos, W of the Solea graben axis (adapted from Keith et al., Reference Keith, Haase, Klemd, Krumm and Strauss2016). (b) Simplified structural cross-section of Troodos. Normal fault rotation leads to inversely dipping dykes and lava stratigraphy. VMS form along faults related to three main grabens: Solea, Mitsero and Larnaca. Location of section corresponds to the north flank of Troodos (adapted from Varga and Moores, Reference Varga, Moores, Malpas, Moores, Panayiotou and Xenophontos1990).

Differential uplift occurred in the Neogene in response to serpentinization (e.g. Robertson and Xenophontos, Reference Robertson and Xenophontos1993) and led to the exposure of the complete ophiolitic crustal stratigraphy with relatively little deformation (Fig. 1a). Zones of strongly epidotized dykes are believed to represent hydrothermal reaction zones (Richardson et al., Reference Richardson, Cann, Richards and Cowan1987; Jowitt et al., Reference Jowitt, Jenkin, Coogan and Naden2012) and commonly occur in the lower sheeted dyke complex. At the periphery of the ophiolite and stratigraphically above the sheeted dyke complex is the extrusive sequence. The sequence consists of a ‘Basal Group’ transitional horizon that grades up into an aphyric ‘Lower Pillow Lava’ suite characterized by evolved sheet flows and pillows of andesite/dacite composition. This is overlain by a more primitive suite of basaltic andesitic, often olivine-phyric ‘Upper Pillow Lavas’ (e.g. Gass et al., Reference Gass, MacLeod, Murton, Panayiotou, Simonian and Xenophontos1994) (Fig. 1a). This sub-division of the Troodos extrusive section is contentious and somewhat arbitrary. VMS deposits are found at different levels within the extrusive sequence and often occur at the contacts between the Basal Group/Lower Pillow Lava or Lower Pillow Lava/Upper Pillow Lava (e.g. Adamides, Reference Adamides2010).
These issues notwithstanding, the relatively undeformed nature of the Troodos ophiolite, with preservation of original seafloor structures makes it an excellent location to investigate geochemical processes associated with VMS hydrothermal systems.
In-depth studies of the internal structure and spreading history of the Troodos ophiolite have revealed complexities in the mechanism of crustal accretion akin to processes recognized at modern slower-spreading mid-ocean ridges (e.g. Escartin and Canales, Reference Escartín and Canales2011). In particular, it is evident that tectonic stretching accompanied plate separation, such that normal faulting and tilting of upper crustal blocks (Fig. 1b) occurred above a large-offset normal fault, the so-called Kakopetria Detachment (Varga and Moores, Reference Varga and Moores1985; Nuriel et al., Reference Nuriel, Katzir, Abelson, Valley, Matthews, Spicuzza and Ayalon2009). This stretching of the sheeted dyke complex led to the formation of regional-scale graben structures, defined by the ‘bookshelf’ faulting and tilting of sheeted dyke complex and lavas away from each other (Varga and Moores, Reference Varga and Moores1985; Moores et al. Reference Moores, Varga, Verosub, Ramsden, Malpas, Moores, Panayiotou and Xenophontos1990). From west to east these regional structures are defined as the Solea, Mitsero and Larnaca grabens, respectively (Fig. 1b).
The greater part of the extrusive section, comprising the Upper Pillow Lava, Lower Pillow Lava and Upper Basal Group lithologies are altered extensively to zeolite facies (~150°C) metamorphic assemblages with celadonite (KMg0.8 ${\rm Fe}_{{\rm 0}{\rm. 2}}^{{\rm 2 +}} {\rm Fe}_{{\rm 0}{\rm. 9}}^{{\rm 3 +}} $ Al0.1Si4O10(OH)2) and natrolite (Na2Al2Si3O10·2H2O). The Lower Basal Group marks a transition to greenschist-facies metamorphic conditions (Gillis and Robinson, Reference Gillis, Robinson, Malpas, Moores, Panayiotou and Xenophontos1980). The vertical nature of dyke margins is an effective means for fluid to penetrate deep into the crust and as fluids descend to the base of the sheeted dyke complex they become heated to upper greenschist temperatures of ~350°C; and at this point original mafic assemblages are replaced by epidote-quartz +/− titanite. Fluid-inclusion (Bendnarz and Schmincke, Reference Bendnarz, Schmincke, Malpas, Moores, Panayiotou and Xenophontos1990) and isotopic studies (Bickle and Teagle, Reference Bickle and Teagle1992; Yamaoka et al., Reference Yamaoka, Matsukura, Ishikawa and Kawahata2015) support the pervasive and high-temperature nature of hydrothermal alteration in the sheeted dyke complex. The transition from the sheeted dykes to upper plutonics marks a decrease in alteration intensity; fluid migrates laterally along the boundary between the sheeted dyke complex and plutonic rocks before ascending through normal faults to the seafloor (Gillis and Roberts, Reference Gillis and Roberts1999).
The Solea graben
The Solea graben is a major tectonic lineament and represents a fossil spreading axis (Varga, Reference Varga1991) (Fig. 1b). Three significant VMS deposits are located in close proximity (~4 km) to the Solea axis: Skouriotissa (currently producing), Mavrovouni (exhausted) and Apliki (not currently producing).
The Solea graben is defined by a series of N–S trending normal faults controlling VMS distribution (Fig. 1b). Skouriotissa is located closest to the inferred graben axis and is thought to be the youngest VMS deposit on the island; the horizontal lava structure at Skouriotissa supports this observation as it has not undergone ‘off axis’ rotation. Apliki lies 4 km west of Skouriotissa within the Lower Pillow Lava and is inferred to have formed earlier than Skouriotissa as it is located further from the Solea axis and has experienced ‘off axis’ rotation (see section headed ‘The Apliki VMS’).
Cyprus-type VMS
VMS formation and morphology
Troodos hosts the type locality for Cyprus-type VMS deposits (Cox and Singer, Reference Cox and Singer1986). Cyprus-type VMS may also be classified as either mafic (Galley et al., Reference Galley, Hannington, Jonasson and Goodfellow2007) or Cu-(Zn) (Franklin et al., Reference Franklin, Gibson, Jonasson, Galley, Hedenquist, Thompson, Goldfarb and Richards2005). But for the purpose of this paper we retain the original name.
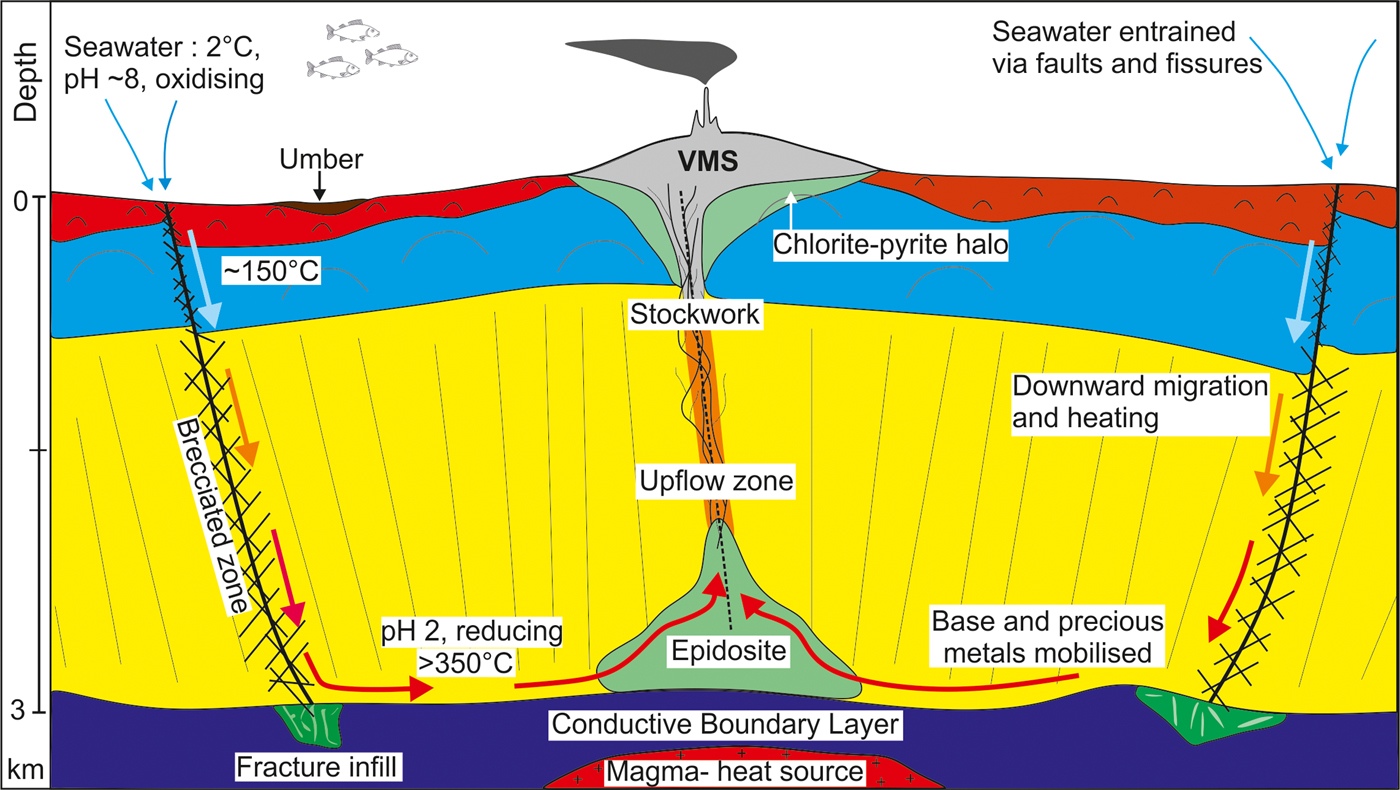
Cyprus-type VMS are hydrothermal ore deposits derived from the interaction of evolved seawater with mafic country rocks under greenschist-facies metamorphic conditions (350°C). Cold (2°C), oxidized seawater reacts with volcanic glass which lowers pH as it enters the sub-surface through cracks and fissures (Seyfried Jr. and Mottl, Reference Seyfried and Mottl1982) (Fig. 2). The fluid continues to migrate downwards into the sheeted dyke complex and becomes superheated to 350-400°C with a pH of ~2; at this point exchange occurs between the fluid and host rock forming epidosites (Gillis and Robinson, Reference Gillis, Robinson, Malpas, Moores, Panayiotou and Xenophontos1980; Jowitt et al., Reference Jowitt, Jenkin, Coogan and Naden2012) (Fig. 2). Epidosites are widely accepted as a source of base and trace metals in the Cyprus-type VMS of Troodos (Jowitt et al., Reference Jowitt, Jenkin, Coogan and Naden2012; Schiffman et al., Reference Schiffman, Bettison, Smith, Malpas, Moores, Panayiotou and Xenophontos1990; Seyfried and Bischoff, Reference Seyfried and Bischoff1977).
Schematic section of the VMS hydrothermal system. Entrained seawater migrates downwards through the lava pile to the sheeted dyke complex. Fluid becomes superheated at the base of sheeted dyke complex forming epidosites. Thermally buoyant evolved fluid rises through faults and is exhaled at the seafloor forming VMS deposits (adapted from Bickle and Teagle, Reference Bickle and Teagle1992).
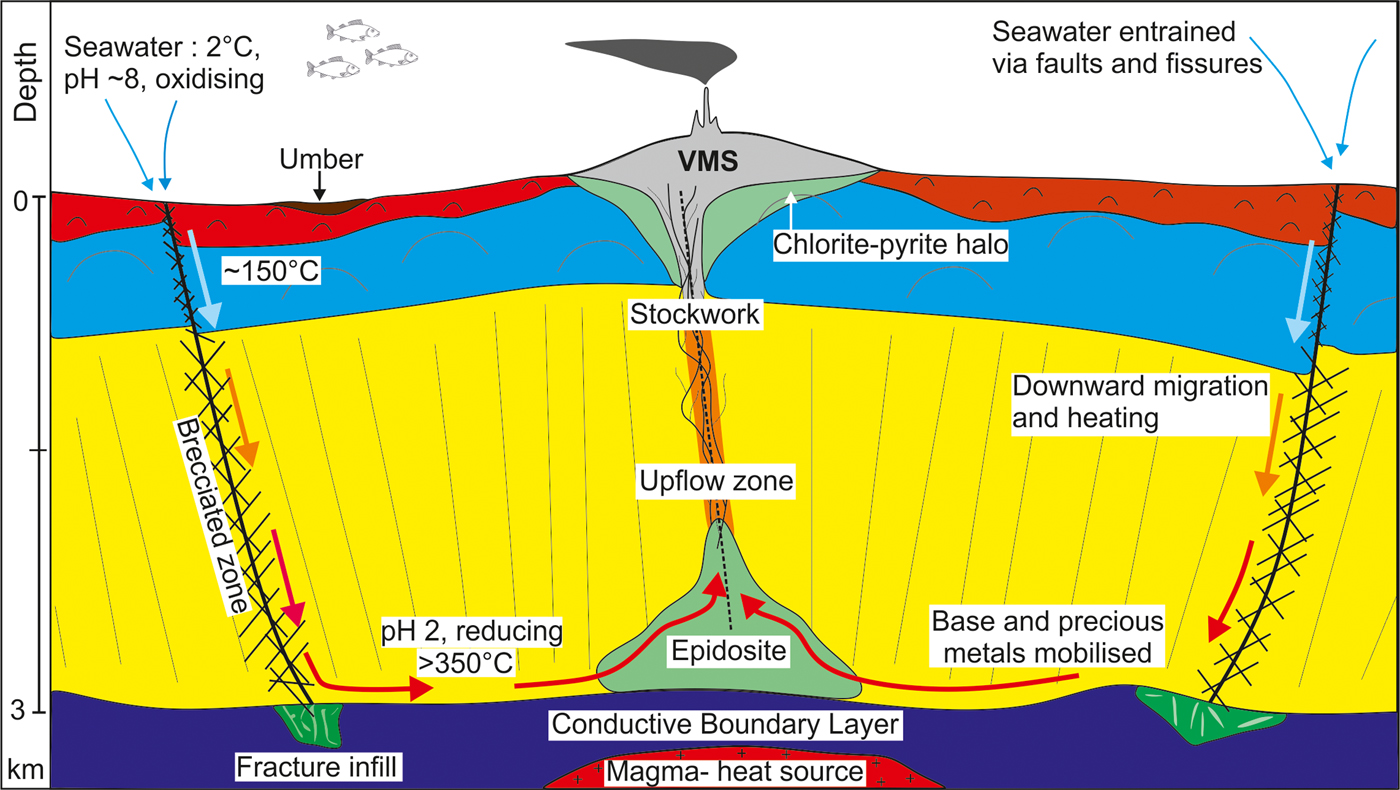
Metal-laden hydrothermal fluid rises through normal faults that provide a permeability pathway and focal mechanism channelling fluids to the seafloor (Fig. 2). Upon exhalation, hot reduced fluid mixes with seawater leading to ligand disassociation (Cl–, H ${\rm S}_{\rm 2}^{\rm \ndash} $), the precipitation of sulfides and VMS formation (Humphris and Cann, Reference Humphris and Cann2000).
Cyprus-type VMS are relatively low tonnage averaging 2.8 Mt (n = 62) but high grade with >2 wt.% Cu (Barrie, Reference Barrie1999; Hannington et al., Reference Hannington, Galley, Herzig, Petersen, Herzig, Humphris, Miller and Zierenberg1998). They are Zn and Pb poor with average grades of <0.7 wt.% and <0.1 wt.%, respectively (e.g. Adamides, Reference Adamides2010); reflecting the mafic host rock, lack of sediments and absence of felsic volcanics leading to a depletion in Pb relative to Cu (Tornos et al., Reference Tornos, Peter, Allen and Conde2015). Tonnages of VMS in Troodos range from <0.05 Mt to >16 Mt (Adamides, Reference Adamides2011, Reference Adamides2010).
Exhalative ore bodies are characterized by a strataform lens of cupriferous pyrite with a typical mound morphology (e.g. Phoucasa or Mala). Massive pyrite exhibits vuggy, colloform or sandy textures grading to semi-conformable Cu-rich stockwork at depth. For some deposits no clear evidence for exhalation is visible as they lack colloform/banded textures, chimney fragments or vent fauna suggesting they may have formed via subseafloor replacement (Doyle and Allen, Reference Doyle and Allen2003). Mineralogy is dominated by pyrite (euhedral to colloform), chalcopyrite and sphalerite with inclusions of galena and abundant Cu secondaries: covellite, digenite and chalcocite (Adamides, Reference Adamides2010, Reference Adamides2011). Alteration surrounding the VMS is characteristically silica and chlorite dominated with disseminated pyrite.
Tellurium and Se systematics in VMS
Pyrite is ubiquitous with many hydrothermal ore deposits and may contain substantial concentrations of trace elements (e.g. Huston et al., Reference Huston, Sie and Suter1995; Revan et al., Reference Revan, Genç, Maslennikov, Maslennikova, Large and Danyushevsky2014). Trace elements in VMS commonly occur in three forms: (1) discrete mineral phases (e.g. tellurides or selenides); (2) in a solid solution within the crystal lattice; or (3) micro-nano inclusions (Huston et al., Reference Huston, Sie and Suter1995; Layton-Matthews et al., Reference Layton-Matthews, Peter, Scott and Leybourne2008; Revan et al., Reference Revan, Genç, Maslennikov, Maslennikova, Large and Danyushevsky2014).
Trace elements may be classified into three categories based on their behaviour during incorporation into pyrite (Huston et al., Reference Huston, Sie and Suter1995). Group (1) occur as inclusions (Cu, Zn, Pb, Ba, Bi, Ag and Sb), group (2) in non-stoichiometric substitution (As, Tl, Au and Mo) and group (3) as a stoichiometric substitution for S (Se and Te) or Fe (Co and Ni) (Huston et al., Reference Huston, Sie and Suter1995). Huston et al., (Reference Huston, Sie and Suter1995) state that both Te and Se are incorporated via stoichiometric substitution with S ions; this however seems unlikely for Te given its larger ionic radius (2.42 Å) compared with S (2.14 Å) (e.g. Butler and Nesbitt, Reference Butler and Nesbitt1999; Rahm et al., Reference Rahm, Hoffmann and Ashcroft2016). In contrast Se has a similar ionic radius to S at 2.24 Å (Butler and Nesbitt, Reference Butler and Nesbitt1999; Maslennikov et al., Reference Maslennikov, Maslennikova, Large and Danyushevsky2009; Rahm et al., Reference Rahm, Hoffmann and Ashcroft2016).
The process of substitution is influenced by the physiochemical properties of the hydrothermal fluid, resulting in the highly variable distribution of Te and Se in pyrite (Butler and Nesbitt, Reference Butler and Nesbitt1999; Genna and Gaboury, Reference Genna and Gaboury2015; Huston et al., Reference Huston, Sie and Suter1995). Increased Te concentrations in the inner wall of vent chimneys from the Broken Spur vent field at 29° on the Mid Atlantic Ridge suggest Te is more readily incorporated at high temperatures (Butler and Nesbitt, Reference Butler and Nesbitt1999). High temperatures also favour the incorporation of Se as the Gibbs free energy of mixing becomes increasingly more negative at higher temperatures allowing the lattice structure to tolerate higher concentrations of Se (Maslennikov et al., Reference Maslennikov, Maslennikova, Large and Danyushevsky2009). Theoretically this should lead to enrichment of Se and Te in high-temperature zones of a VMS (e.g. stockwork) (Maslennikov et al., Reference Maslennikov, Maslennikova, Large and Danyushevsky2009).
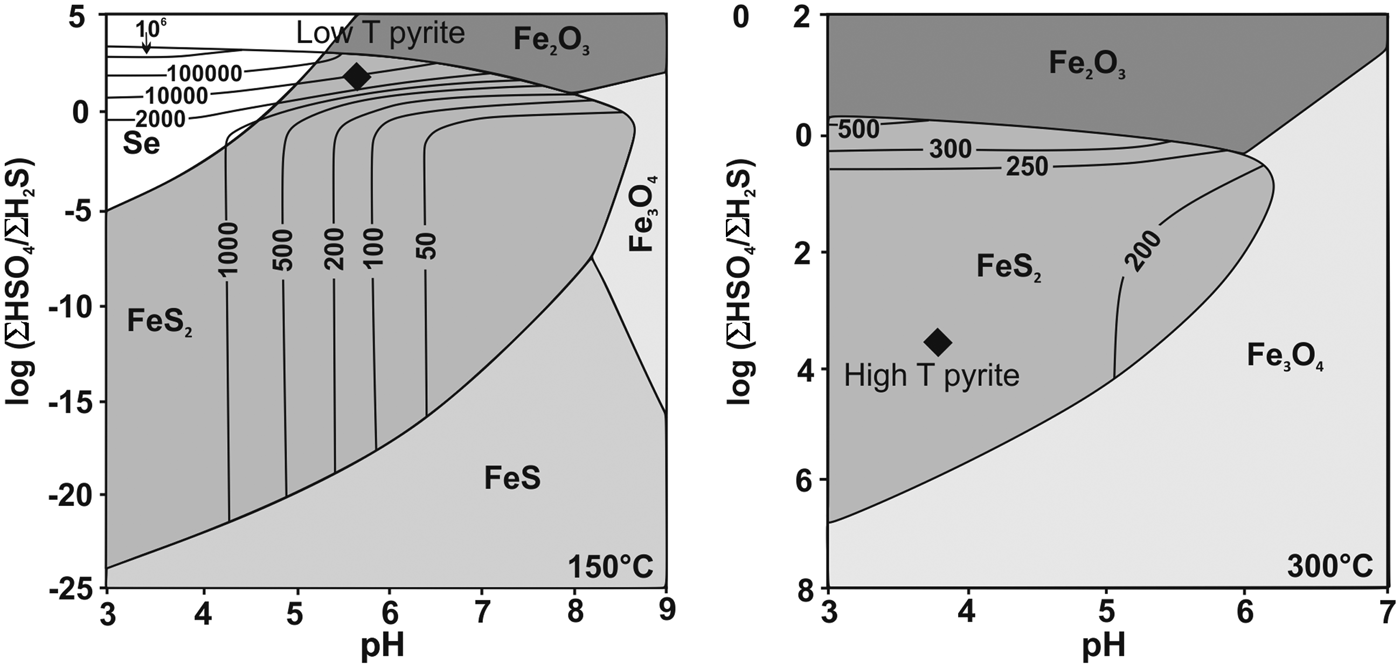
Modelling by Huston et al. (Reference Huston, Sie and Suter1995) argues that Se incorporation is enhanced at low temperatures (Fig. 3). At temperatures <200°C Se incorporation in pyrite is controlled by redox and pH whereas at temperatures >200°C Se incorporation is controlled by fluid H2Se/H2S ratio and temperature (Huston et al., Reference Huston, Sie and Suter1995). In hydrothermal fluids at >200°C the dominant species are H2Se/H2S and thus approximate to Se/S ratios (Huston et al., Reference Huston, Sie and Suter1995). At temperatures >300°C the ratio of H2Se/H2S in the hydrothermal fluid is constant, equating to uniform Se concentrations in pyrite of 200–250 ppm and Se/S ratios of 10–4 (Fig. 3). By contrast, at 150°C the concentration of Se in equilibrium with the hydrothermal fluid is more variable leading to Se enrichment in pyrite up to a theoretical value of 100,000 ppm (Huston et al., Reference Huston, Sie and Suter1995).
Theoretical incorporation of Se in pyrite as a function of pH, Eh and temperature. Se incorporation favours low temperatures and low pH (left). Selenium is enriched at low temperatures (left – 150°C) over high temperatures in pyrite (right – 300°C). Values are in ppm and S = 0.002 m for both experiments (adapted from Huston et al., Reference Huston, Sie and Suter1995).

Sampling and methods
To investigate the spatial distribution of Te and Se within southern Cyprus and the Troodos ophiolite in particular, we first obtained regional soil geochemical data from the Geological Survey Department of Cyprus (GSD) (see Cohen et al., Reference Cohen, Rutherford, Morisseau and Zissimos2012). Sampling was carried out by the GSD using a nominal grid size of one sample per 2.2 km2 for Troodos and 1 km2 for surrounding sedimentary units (Cohen et al., Reference Cohen, Rutherford, Morisseau and Zissimos2012). Two sampling depths were investigated: top soil (Fig. 4), sampled at a depth of 0–25 cm, and subsoil sampled at 50–75 cm depth. An aqua regia digest followed by inductively coupled plasma mass spectrometry (ICP-MS) analysis for trace elements and X-ray fluorescence for major elements was used (Cohen et al., Reference Cohen, Rutherford, Morisseau and Zissimos2012). Detection limits were 0.01 and 0.1 ppm for Te and Se (via ICP-MS).
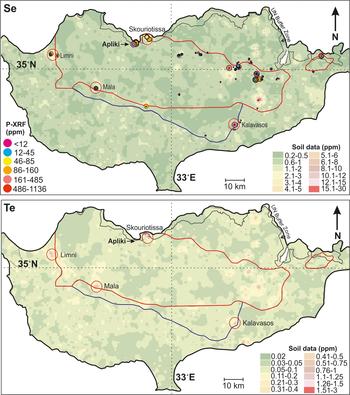
Distribution of Te and Se within soils in southern Cyprus. Two sets of data are presented for Se. P-XRF (this study) and regional geochemical soil data (Cohen et al., Reference Cohen, Rutherford, Morisseau and Zissimos2012). Tellurium was not analysed by P-XRF. The red line is the outline of the Troodos ophiolite and blue line the STTFZ. Anomalous Te and Se occur at the VMS mines; four of which are highlighted by the red circles. Data provided by the Geological Survey Department of Cyprus (after Cohen et al., Reference Cohen, Rutherford, Morisseau and Zissimos2012).

Follow-up samples for this study were collected during field seasons in 2016 and 2017. All samples obtained from Apliki were in situ (i.e. not from spoil heaps) from the surface sampling of pit faces. Apliki has been mined historically resulting in the exposure of different ore horizons within the open pit providing a cross-section through the lower regions of VMS mineralization. Sample locations from this study are summarized in Table 1.
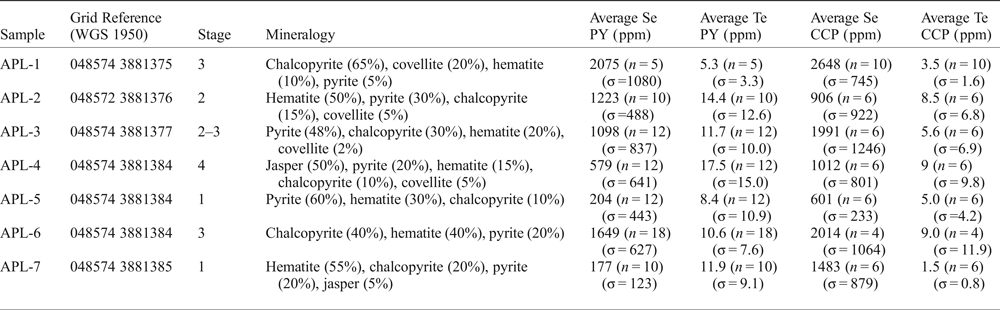
Summary of samples analysed from the South Apliki Breccia Zone*.

σ = one standard deviation (in ppm)
*Full dataset available in the Supplementary materials.
Portable X-ray Fluorescence (P-XRF) analysis was carried out on 640 powdered samples from VMS and mineralized areas across Troodos, 26 of which were from Apliki. Samples were crushed using a jaw crusher and powdered using a tungsten carbide TEMA mill. Twenty grams of sample were then pressed into a plastic vessel with a Mylar cover slip (3 µm thickness) ready for analysis. Analysis was performed using an Olympus Delta Professional P-XRF analysed in Geochem mode for 60 s to determine Mg, Al, Si, P, S, K, Ca, Ti, V, Cr, Mn, Fe, Co, Ni, Cu, Zn, As, Se, Rb, Sr, Y, Zr, Mo, Ag, Cd, Sn, Sb, W, Hg, Pb, Bi, Th and V. It was not possible to analyse for Te. Data quality was monitored by the repeat analysis of standards KPC1, SU1A and a silica blank every 20 samples.
Following the initial screening of 26 samples from Apliki via P-XRF, seven representative samples containing elevated whole-rock Se (>50 ppm) were selected for mineralogical and textural characterization using reflected-light microscopy followed by X-ray diffraction analysis.
X-Ray diffraction (XRD) analysis was carried out on powdered sample APL-1 to confirm dominant Fe matrix phase(s). A scan was run using the Philips PW1710 Automated Powder Diffractometer using CuKα radiation at 35 kV and 40 mA, between 2 and 70°2θ at a scan speed of 0.04°2θ/s. Each sample was identified using Philips PC-identify software.
Variations in trace elements within sulfides were determined by laser ablation inductively coupled plasma mass spectrometry (LA-ICP-MS). Analyses was undertaken on 150 analytical points on pyrite and chalcopyrite from seven polished blocks. The isotopes analysed include 57Fe, 65Cu, 59Co, 66Zn, 75As, 77Se, 109Ag, 111Cd, 121Sb, 125Te, 185Re, 189Os, 193Ir, 195Pt, 197Au 206Pb and 209Bi (see the Supplementary materials). 77Se was used for Se analyses due to lower levels of interference from the ablation gas compared to 82Se. Analysis was performed using a New Wave Research UP213 UV laser system coupled to a Thermo X Series ICP-MS (Cardiff University). Samples were analysed in time-resolved mode using a spot diameter of 55 µm and 80 µm (depending on sulfide grain size) with a frequency of 10 Hz. Acquisition lasted 45 s and a gas blank was measured for 20 s prior to the start of analysis. 33S was used as an internal standard for all analyses and subtraction of gas blanks and internal standard corrections were performed using Thermo Plasmalab software (Prichard et al., Reference Prichard, Knight, Fisher, McDonald, Zhou and Wang2013).
The detection limit for Se varied from 9–15 ppm for the different analytical runs due to mass interference associated with the Ar/Cl gas during ablation. This variation in detection limit does not affect the data significantly as a large proportion of Apliki samples contained >50 ppm Se.
Results
P-XRF anomaly identification
Regional soil geochemistry (GSD data set) highlights the variable distribution of Te and Se in the soils of Cyprus (Fig. 4). P-XRF data for Se shows that VMS deposits of the Solea graben are enriched relative to other VMS of Troodos (Fig. 4). Data displayed in Fig. 4 are for topsoil transects only (0–25 cm). The interpolated surface uses point data. Classification into 12 categories is arbitrary as geochemical data has been rounded to one decimal place making it difficult to detect natural and more meaningful variation. Nevertheless, the data are useful in highlighting areas of enrichment which may otherwise be overlooked. Figure 4 (Se transect A) benefits from the addition of P-XRF data for Se. The distribution of Te and Se from soil data is highly variable throughout Troodos with Te and Se data highlighting mine sites, especially the Limni, Kalavasos, Skouriotissa and Mala VMS (red circles in Fig. 4). All four mines have significant spoil heaps associated with mining activities. Disturbance of sulfide waste leads to the mobilization of Te and Se into the surrounding soils and the dispersion of Se into the environment creating wider anomalies.
Regional geochemical data and P-XRF anomalies highlight elevated Te and Se within the Solea graben. Two of three deposits in the Solea graben; Mala and Skouriotissa show elevated Te and Se from regional soil chemistry data (Fig. 4). Apliki is not highlighted by regional soil data, most likely due do its location within the UN buffer zone making it difficult to access, the nearest soil survey point is 0.5 km south of Apliki. Sulfide samples analysed in this study are some of the first since the 1974 ‘Green Line’.
Out of 640 samples screened via P-XRF from VMS and mineralized localities across Troodos, samples at Apliki were relatively enriched with Se ranging from below detection <12 ppm to 1071 ppm (n = 26). By comparison the highest value recorded for Skouriotissa was just 141 ppm Se. P-XRF identified samples from the South Apliki Breccia Zone as containing the highest concentrations of Se (between 970–1071 ppm) representing a significant whole-rock enrichment when compared to other VMS in Troodos.
The Apliki VMS
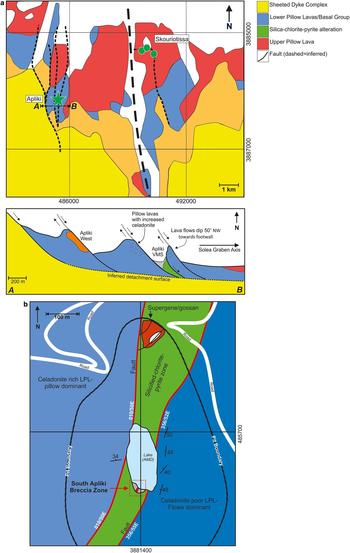
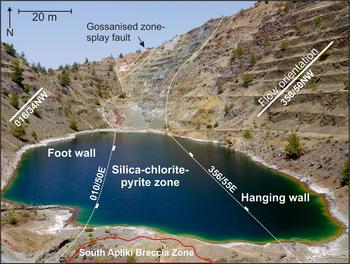
Apliki is owned by Hellenic Copper Mines and although the deposit is not currently mined potential exists for future extraction of stockwork ore. We interpreted Apliki based on historic data and new field observations to be a ‘typical’ Cyprus-type VMS; a cupriferous stockwork overlain by a massive sulfide lens. The exhalative interpretation relies heavily on historic data as no massive sulfide remains. Adamides (Reference Adamides2010) report an average Cu grade of 1.6 wt.% and total tonnage of 1.6 Mt (mainly exhalative ore). The mineralized VMS package is bound by normal, axis parallel (N–S– 350°) faults dipping 50–55° to the east (towards Solea axis – Fig. 5a and b); the hanging wall contains westward dipping (36–52°) 1–3 m thick flow units (Fig. 5a and 6). The contact on both parallel bounding faults is sharp; mineralization does not cross the contact suggesting a degree of post mineralization fault movement. The footwall unit is highly degraded and the extent of rotation less clear but flows have been measured dipping 34° west. The footwall morphology is dominated by pillows and hyaloclastites not flows, and celadonite abundance increases dramatically indicating a higher temperature of formation and that the footwall formed stratigraphically deeper than the hanging wall (i.e. the fault therefore has a normal geometry). The mineralized fault-bound zone is ~100 m wide and consists of silicified, chloritized brecciated Lower Pillow Lava with disseminated pyrite (2–5 modal%) and no massive sulfide mineralization (Fig. 5a and 6). The lower northern wall region is chalcanthite and azurite rich.
(a) Location map of the Apliki VMS and structural schematic cross-section. Apliki is located in NW Troodos within the Solea graben. The deposit is situated within the Lower Pillow Lava stratigraphy and bound by two axis parallel (N–S) normal faults. At depth faults are inferred to truncate along a major detachment surface (Data from field mapping and GSD 1:250,000 map). (b) Local map of the Apliki showing the location of the South Apliki Breccia Zone and major geological features visible within the pit.

Annotated field photo of the Apliki VMS open pit. N–S faults bound the mineralized package, both the footwall and hanging wall are steeply rotated suggesting Apliki has undergone rotation off axis.

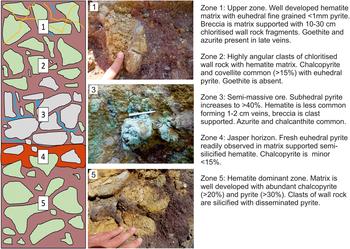
At the southern end of the pit, fresh sulfide is preserved and material is best accessed via a drainage gully in the centre of the lowermost bench (Fig. 5b). The area is rich in coarse grained semi-massive pyrite with an unusual hematite-(magnetite)-chalcopyrite-pyrite-rich breccia zone (Fig. 7). In this zone chalcopyrite is more abundant than pyrite accounting for up to 70 wt.% of samples collected (Fig. 6 and 7). From this point the zone will be termed the South Apliki Breccia Zone. The breccia zone is continuous for 4–5 m (depth) in cross-section through two bench levels and only well exposed perpendicular to strike for 2–3 m. Within this relatively narrow zone several morphological distinctions can be made based on modal mineralogy and degree of silicification (Fig. 7 and Table 1). Hematite also occurs in discrete cm-wide veins which crosscut pillows in the footwall. Chalcanthite, covellite and azurite are abundant in the southern pit wall (Fig. 7).
Stratigraphic cross-section through the South Apliki Breccia Zone (see Table 1).

The hematite breccia is somewhat unique to the Apliki VMS and although specular hematite is common within pseudo-epithermal ‘T’ type mineralization in Troodos defined by Jowitt et al. (Reference Jowitt, Osborn, Thomas, Naden, Gunn, Herrington and Nicolaides2005) (e.g. at Alestos or Touronja) to our knowledge it does not coexist with large amounts of chalcopyrite at any other locality.
Mineralogy of South Apliki Breccia Zone
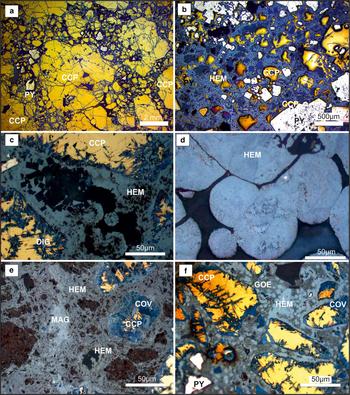
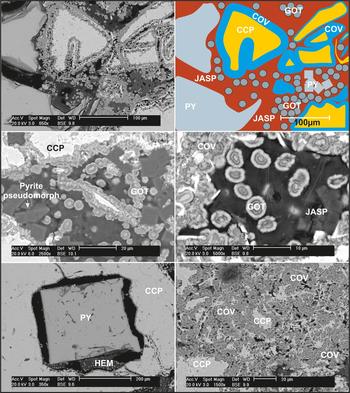
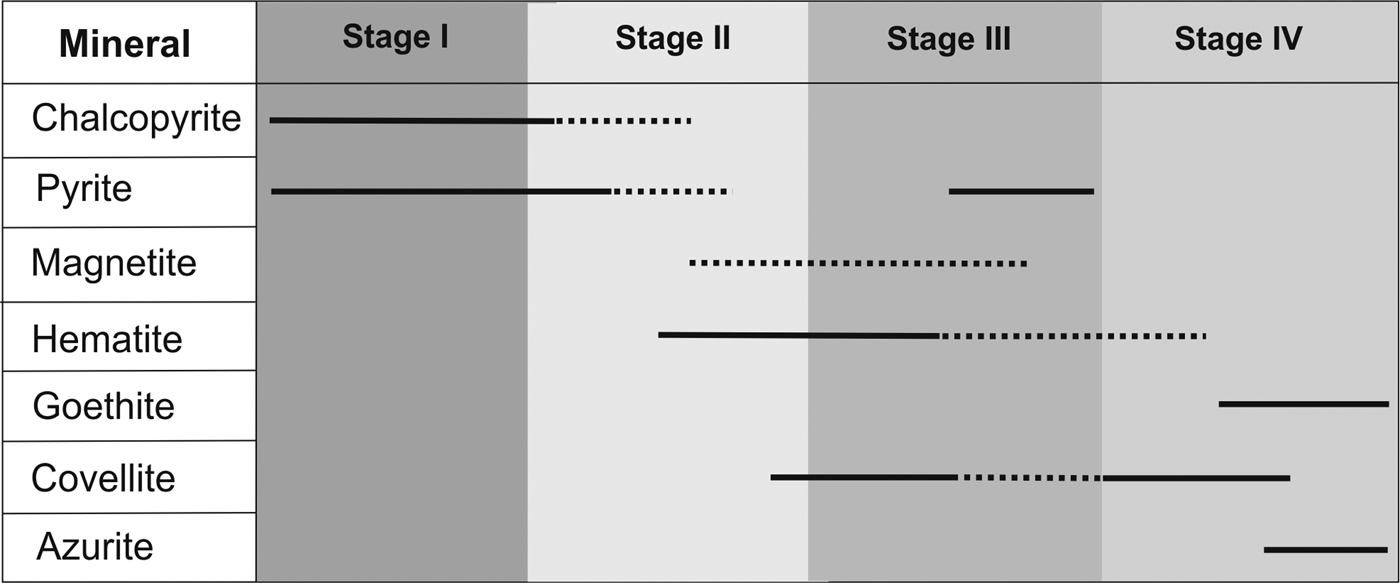
Reflected-light microscopy on seven representative polished blocks from the South Apliki Breccia Zone (Fig. 8) reveals four stages of paragenesis (summarized in Table 1 and Figs 8, 9 and 10). Generally, chalcopyrite is variably altered to covellite and digenite at grain boundaries. Pyrite, when present is euhedral and may be replaced by hematite (Fig. 8 and 9). Semi-quantitative XRD (Supplementary materials) indicates that hematite is the dominant matrix phase occurring in both specular form and mixed with silica as jasper (optically identified). Subsequently samples are grouped into four alteration stages based on pyrite morphology and degree of hematite and covellite alteration.
Photomicrographs in reflected light of South Apliki Breccia Zone samples: (a) massive chalcopyrite with interstitial subhedral pyrite and minor covellite; (b) chalcopyrite with a hematite matrix and euhedral pyrite overgrowths; (c) chalcopyrite rimed by covellite and digenite with cubic hematite pseudomorphing pyrite; (d) botryoidal hematite with pyrite inclusions (white); (e) extensive alteration of pyrite to hematite with covellite replacing chalcopyrite; (f) botryoidal matrix hematite-goethite with subhedral pyrite and chalcopyrite rimmed by covellite. PY = pyrite; CCP = chalcopyrite; HEM = hematite; COV = covellite; DIG = digenite; MAG = magnetite; GOE = goethite.

Back-scatter electron photomicrographs: (a) oxidation of chalcopyrite rims to secondary Cu phases and botryoidal goethite in jasper; (b) sketch showing alteration of CCP; (c) pyrite pseudomorphs and goethite in matrix; (d) botryoidal goethite within jasper matrix; (e) euhedral pyrite within chalcopyrite and minor hematite at margins; (f) extensive alteration of chalcopyrite to covellite. PY = pyrite; CCP = chalcopyrite; HEM = hematite; COV = covellite; GOT = goethite; JASP = Jasper (hematite + silica).

Paragenesis of the South Apliki Breccia Zone.

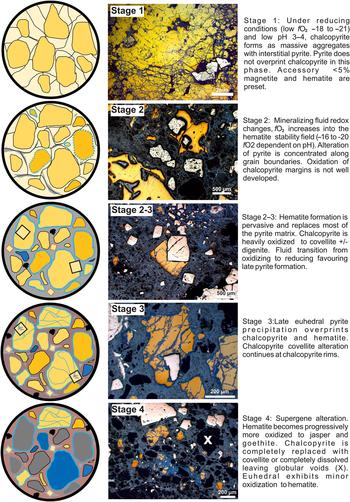
Stage I samples (APL-5 and APL-7) contain significant amounts of chalcopyrite that exhibits no visible oxidization along grain boundaries. Critically pyrite is subhedral to anhedral and does not overprint chalcopyrite. Pyrite is readily preserved rimming chalcopyrite and is rarely altered to hematite (Fig. 8 and 9). This stage of alteration is characterized by a hematite matrix (55%) with 1–2 mm subhedral pyrite (20%) and chalcopyrite (20%). Pyrite is heavily pitted and commonly observed rimming chalcopyrite. Very few pyrite grains are euhedral; euhedral grains occur overgrowing chalcopyrite whilst subhedral pyrite appears cogenetic and does not overgrow chalcopyrite. Dissolution features are rare occurring only in a small number of pyrite grains (<5%) where pyrite is locally altered to hematite (Figs 8 and 10).
Stage II samples (APL-2 and APL-3) contain large amounts of hematite forming botryoidal to acicular masses within the matrix. Pyrite is less common than in stage I forming both subhedral grains (<2 mm) and euhedral grains >2 mm. Chalcopyrite is minor compared to stage I and may be altered to covellite and digenite (Figs 10 and 11).
Summary of sample paragenesis showing multiple phases of pyrite formation and the transition from sulfide to oxide formation. Goethite and azurite are related to weathering and supergene alteration.

The third stage of ore formation is well developed in samples APL-1 and APL-6; euhedral coarse pyrite overprints both chalcopyrite and the hematite-goethite matrix. Euhedral pyrite which overprints earlier phases exhibits no hematite alteration suggesting they formed during the last stage of mineralization. Stage III alteration comprises roughly equal proportions of hematite (40%) and chalcopyrite (40%) with minor pyrite (20%) which is coarse grained (1–3 mm) and euhedral. Chalcopyrite is interstitial surrounding pyrite and in some areas forms crystals up to 6 mm (Fig. 8). Chalcopyrite may be oxidized to covellite and digenite (Figs 9, 10 and 11).
Supergene alteration of chalcopyrite produces dominantly covellite + diginte +/− chalcocite with goethite. Alteration is generally limited to grain boundaries and rarely in stage IV samples grains may be completely dissolved or replaced (Figs 8 and 9). Stage IV alteration is characterized by a fine matrix of botryoidal to acicular hematite with variable amounts of jasper. Pyrite is a minor constituent (20%) limited to bands of specular hematite. Pyrite exhibits a subhedral to rounded morphology and may be coarse up to 3 mm. Chalcopyrite is a minor constituent (<10%) forming globular masses 1–5 mm and is rarely overgrown by pyrite. Covellite if present rims chalcopyrite and upon weathering is preserved as a series of sub-rounded voids which indicate relict chalcopyrite-covellite grains. Reaction rims forming Cu secondaries around the margin of chalcopyrite are generally 20–30 µm (Figs 8 and 9).
Magnetite is not readily preserved in any samples at Apliki with hematite forming the major oxide phase (XRD – Supplementary materials). Very few grains of pyrite show evidence of hematite replacing pyrite but rarely radial growths of hematite can replace pyrite cores (Fig. 8). Within the hematite-goethite matrix cubic pyrite pseudomorphs are common (Fig. 9).
LA-ICP-MS of sulfides
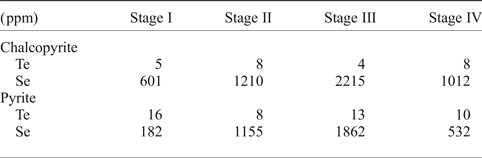
A total of 150 LA-ICP-MS spot analyses from Apliki, 96 of pyrite and 54 of chalcopyrite, were analysed in seven representative polished blocks. Tellurium and Se maximum values in pyrite reach 70 and 4943 ppm, respectively. LA-ICP-MS of sulfides from Apliki indicate that Te and Se concentration varies systematically with alteration stage. Selenium within pyrite varies enormously from <15 (below detection limit) to 4953 ppm. Similar variation is observed in chalcopyrite with Se concentrations ranging from 104 to 3956 ppm. The average Se concentration in chalcopyrite is typically 700 ppm, greater than pyrite at 1576 ppm (n = 54) (summarized in Table 2, full data in Supplementary materials.
Summary of average Se and Te concentration in chalcopyrite and pyrite by alteration stage*.
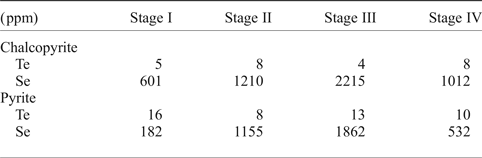
*Detection limit: 9–15 ppm and 0.4–0.7 ppm for Se and Te respectively (histogram plots available in Supplementary material).
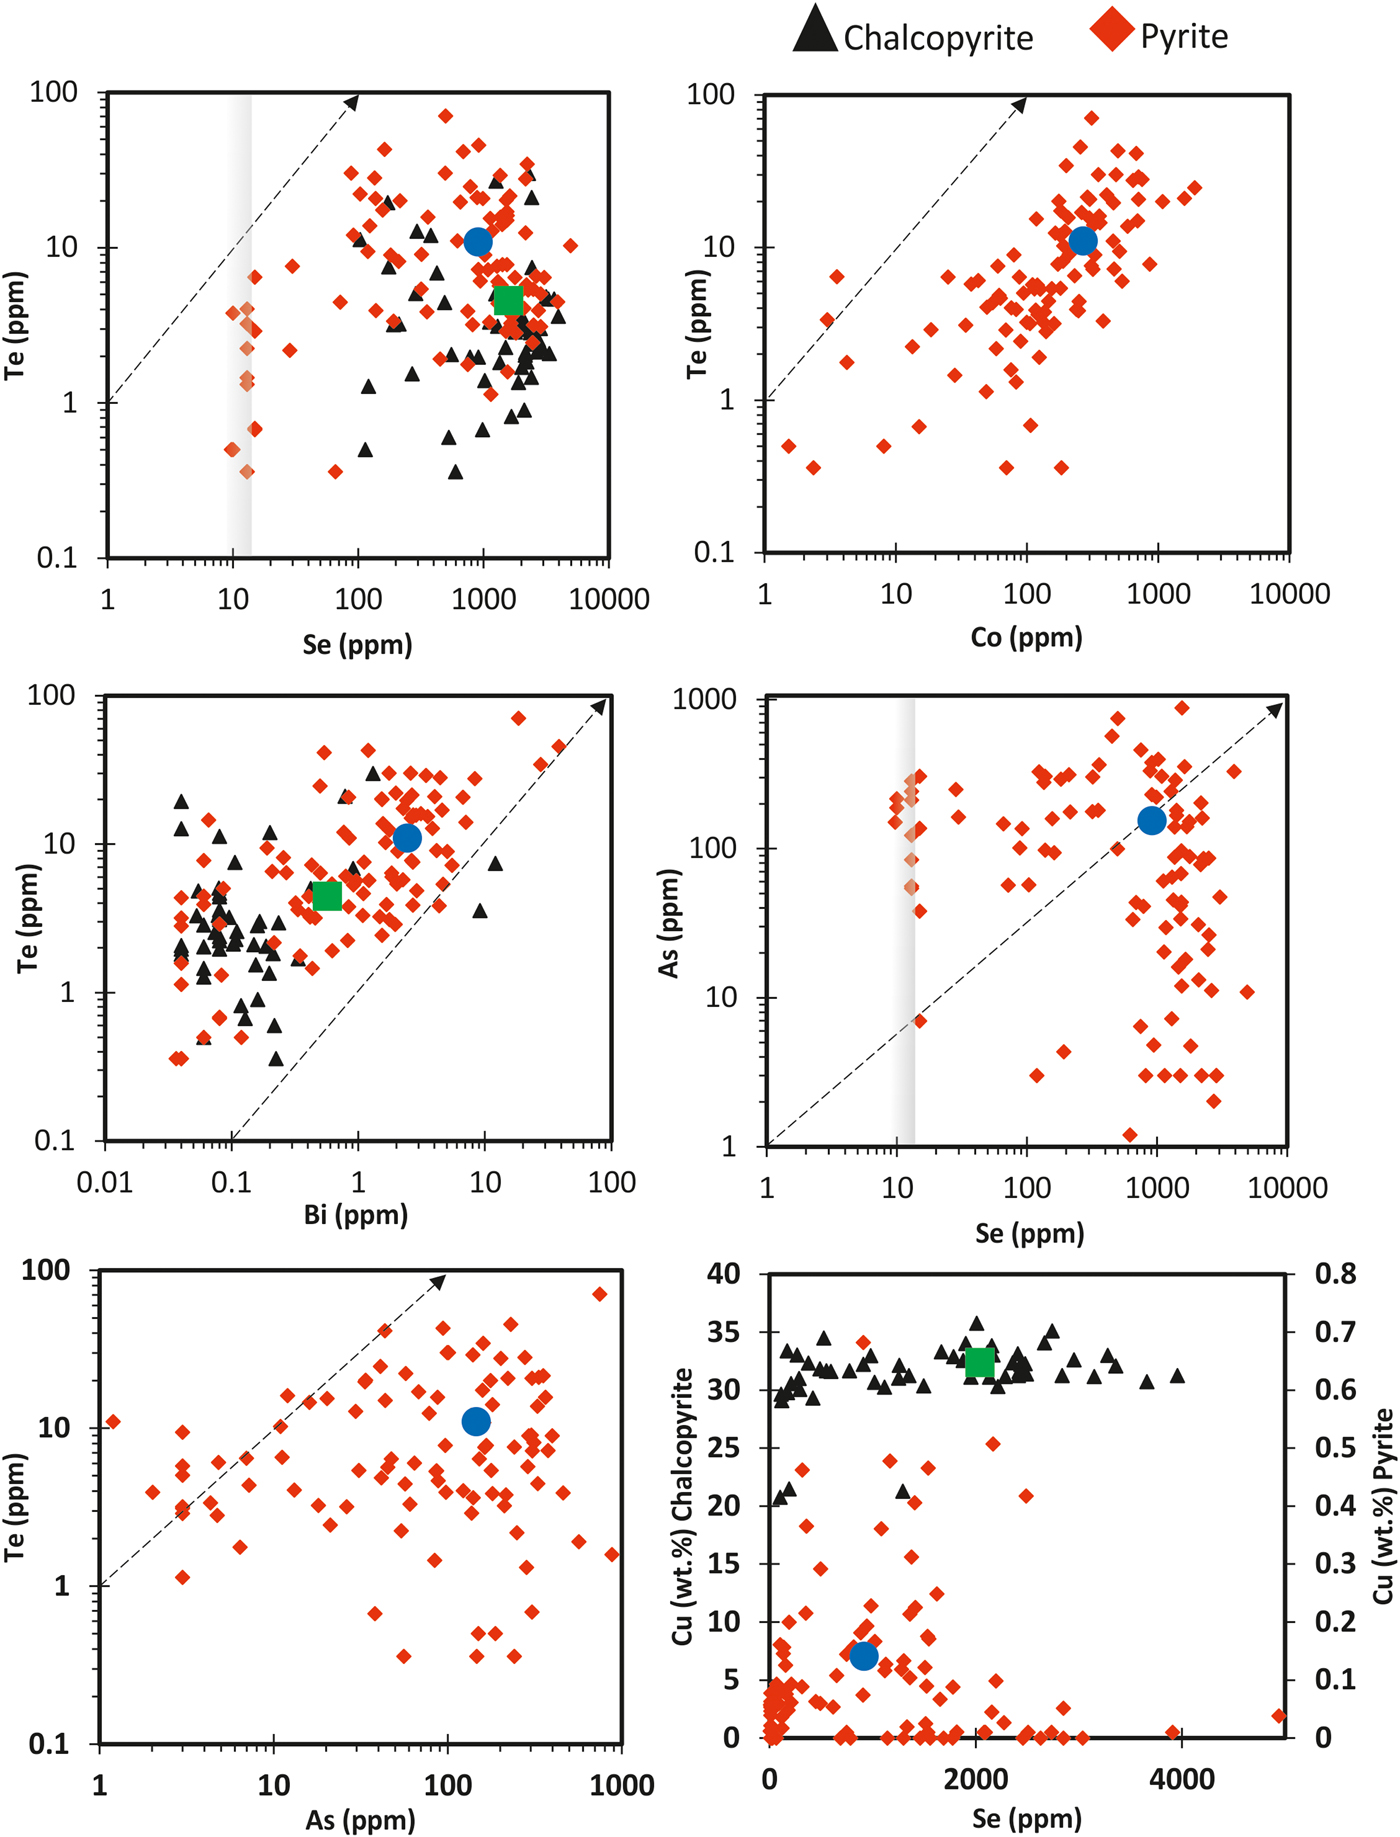
Bivariate plots of Te and Se against other trace elements from LA-ICP-MS data are shown in Fig. 12 (see Supplementary materials). Tellurium and Se exhibit no clear correlation (R 2 = 0.02) suggesting a decoupled behaviour during VMS formation. Selenium exhibits limited correlation with all trace elements, whereas Te exhibits a weak positive correlation with Bi (R 2 = 0.3) and Co (R 2 = 0.2) but no correlation with As (R 2 = 0.01).
Bivariate plots of LA-ICP-MS spot analyses. Grey box indicates variable detection limit. Blue circle is average concentration for pyrite, green square for chalcopyrite (ppm).

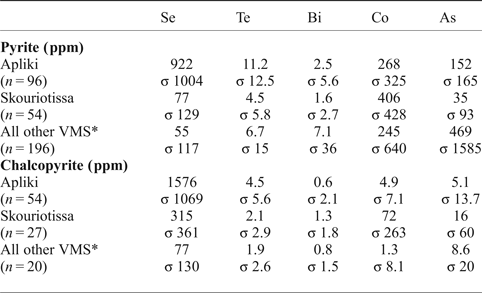
Arsenic is low in the South Apliki Breccia Zone averaging just 152 ppm in pyrite compared with 496 ppm for all other deposits in Troodos (Table 3). Cobalt concentration in pyrite is similar to the mean value for all deposits at 245 ppm and 268 ppm for Apliki (Table 3). Bismuth concentration in pyrite is lower in Apliki at 2.46 ppm compared with all other VMS but marginally higher when compared to Skouriotissa at 1.66 ppm (Table 3). A comparison of average trace-element concentrations for Apliki and all other VMS of Troodos is summarized in Table 3 (all data in the Supplementary materials).
Summary of average LA-ICP-MS spot data. Se is enriched in both chalcopyrite and pyrite at the South Apliki Breccia Zone compared to neighbouring Skouriotissa and ‘All’ VMS. Data shows that Se is incorporated preferentially into chalcopyrite whilst Te partitions strongly into pyrite.

*subset of 442 LA-ICP-MS spot analyses.
When comparing between chalcopyrite and pyrite clear trends exist (Tables 2 and 3). Chalcopyrite is enriched in Se relative to pyrite but depleted in Te, As, Co and Bi. Similar trends exist when comparing the relative concentration of elements between pyrite and chalcopyrite for all VMS considered in this study (Table 3). Cobalt is elevated at Skouriotissa for both pyrite and chalcopyrite at 406 ppm and 72 ppm, respectively, compared to 268 and 4.96 ppm for Apliki (Table 3). Selenium in chalcopyrite in all VMS excluding Apliki and Skouriotissa is significantly lower than that recorded at Apliki (Table 3).
Discussion
Range of Se concentrations in VMS
The South Apliki Breccia Zone appears unique within Troodos in both its mineralogy and unusual enrichment in Se. Very little trace-element data (particularly Te and Se) exists for Cyprus-type VMS and especially VMS within Troodos. One study by Keith et al. (Reference Keith, Haase, Klemd, Krumm and Strauss2016) on the Skouriotissa VMS, located near Apliki within the Solea Graben (see Fig. 5a) shows that Se concentration apparently exhibits systematic variation with depth in the ore body; deeper levels being more enriched (Keith et al., Reference Keith, Haase, Klemd, Krumm and Strauss2016). Maximum Se and Te values in pyrite in Skouriotissa analysed via LA-ICP-MS are 1886 and 53 ppm respectively and correspond to euhedral pyrite from deep-stockwork (Keith et al., Reference Keith, Haase, Klemd, Krumm and Strauss2016). The average Se content from euhedral pyrite in Skouriotissa's most enriched deep-stockwork zone is 948 ppm (Keith et al., Reference Keith, Haase, Klemd, Krumm and Strauss2016). Tellurium is comparable to values measured in Apliki ranging from 0.7–12 ppm compared to 4–16 ppm with a maximum of 70 ppm at Apliki. By comparison Se exhibits a much greater enrichment in the South Apliki Breccia Zone averaging 182 (n = 22) and 1862 (n = 23) ppm in stage I and III pyrite respectively. Maximum values for Se are significantly higher at Apliki reaching 4953 ppm in pyrite. Other Cyprus-type deposits exhibit a wide variation in Se content from 20 ppm in the Mathiati North VMS of eastern Troodos (Economou-Eliopoulos et al., Reference Economou-Eliopoulos, Eliopoulos and Chryssoulis2008) to 177 and 1 ppm Se in the chalcopyrite and sphalerite rich zones of the Trans-Atlantic Geotraverse (TAG) deposit (Mid Atlantic Ridge) (Hannington et al., Reference Hannington, Galley, Herzig, Petersen, Herzig, Humphris, Miller and Zierenberg1998).
Greater volumes of data exist for VMS deposits formed in bi-modal environments. Three notable Canadian examples which exhibit unusual enrichment in Se are outlined; the Finlayson Lake District (Layton-Matthews et al., Reference Layton-Matthews, Leybourne, Peter, Scott, Cousens and Eglington2013), Bracemac-McLeod (Genna and Gaboury, Reference Genna and Gaboury2015) and Kidd Creek (Hannington and Barrie, Reference Hannington and Barrie1999).
Selenium enrichment analysed via LA-ICP-MS of sulfides from the Bracemac-McLeod deposit occurs in type IV late recrystallized pyrite with a maximum Se content of 1059 ppm. The maximum Se concentration of 4900 ppm in chalcopyrite is comparable to the 3955 ppm recorded at Apliki (Genna and Gaboury, Reference Genna and Gaboury2015). Layton-Matthews et al. (Reference Layton-Matthews, Leybourne, Peter, Scott, Cousens and Eglington2013) note Se enrichment in ‘type-1’ pyrite samples from the chalcopyrite-rich zone (Wolverine deposit) with values of up to 3400 ppm. Average Se values for the Wolverine deposit are 1100 ppm. Selenium is also reported to be enriched in the bornite zone of the Kidd Creek deposit (Hannington and Barrie, Reference Hannington and Barrie1999). Selenium whole-rock concentrations from the ‘Se rich halo’ average 500 ppm whilst the bornite zone exhibits average concentrations of 2200 ppm. Hannington and Barrie (Reference Hannington and Barrie1999) also report Se enrichment up to 0.8 wt.% in pyrite. However, higher average whole-rock Se on a deposit scale in bi-modal VMS is attributed to the presence of galena–clausthalite (Pb-S-Se); this does not explain the higher in situ Se content of pyrite at the Apliki VMS.
Arsenic and Se concentrations at Apliki are more comparable to those recorded in bi-modal VMS than for other Cyprus-type deposits; a mechanism of Se enrichment is needed to explain such enrichment compared with other Cyprus-type deposits. Bi-modal deposits are preferentially enriched as a function of their felsic source rock, an additional magmatic component or high galena–clausthalite contents.
The South Apliki Breccia zone is significantly enriched in Se with maximum values of 3956 ppm Se in chalcopyrite and 4953 ppm Se in pyrite. These values are substantially higher than any other values reported for Cyprus-type VMS. Concentrations are an order of magnitude higher than those reported for chalcopyrite-rich ore in the TAG mound (177 ppm; Hannington et al., Reference Hannington, Galley, Herzig, Petersen, Herzig, Humphris, Miller and Zierenberg1998) and four times higher than maximum values reported by Keith et al. (Reference Keith, Haase, Klemd, Krumm and Strauss2016) for the Skouriotissa ore body.
The source of Se in VMS deposits
A magmatic influx into the VMS hydrothermal system via vapour or aqueous phase transfer has long been hypothesized to explain enrichment in certain magmatophile elements e.g. Se, Te, Cu, Bi, Co etc. (de Ronde et al., Reference de Ronde, Massoth, Butterfield, Christenson, Ishibashi, Ditchburn, Hannington, Brathwaite, Lupton, Kamenetsky, Graham, Zellmer, Dziak, Embley, Dekov, Munnik, Lahr, Evans and Takai2011; Chen et al., Reference Chen, Campbell, Xue, Tian, Ireland, Holden, Cas, Hayman and Das2015; Melekestseva et al., Reference Melekestseva, Maslennikov, Tret'yakov, Nimis, Beltenev, Rozhdestvenskaya, Maslennikova, Belogub, Danyushevsky, Large, Yuminov and Sadykov2017; Sillitoe et al., Reference Sillitoe, Hannington and Thompson1996). The δ34S values for most Mid Ocean Rdige and back-arc VMS sulfides falls within a narrow range of 0 to 5‰ δ34S. The narrow range reflects the mixing of magmatic sourced sulfur (0‰, Vibetti, Reference Vibetti1993) and sulfur derived from seawater sulfate reduction (+20.7‰, Herzig et al., Reference Herzig, Hannington and Arribas1998; Vibetti, Reference Vibetti1993). Increased magmatic influx leads to a decrease in sulfide δ34S values towards 0‰. A modern analogue of an ‘end-member’ magmatic VMS may be found in the Lau Basin, Tonga-Kermadec Arc at the Hine Hina vent site (Herzig et al., Reference Herzig, Hannington and Arribas1998). Sulfides from Hine Hina exhibit the lowest δ34S of any modern back-arc hydrothermal field at –5.3‰ (Herzig et al., Reference Herzig, Hannington and Arribas1998). The variable δ34S of modern seafloor sulfide deposits demonstrates that the source of metals in VMS systems is varied, and when considering elements of magmatic affinity (Se, Te, Cu, Bi, Co) volatile transfer from the magmatic to hydrothermal system may be important in their enrichment.
Although outside the scope of the current study, limited δ34S data does exist for the Skouriotissa VMS and suggests a variable magmatic influx in the Solea graben (Keith et al., Reference Keith, Haase, Klemd, Krumm and Strauss2016). Deep stockwork ore exhibits a light δ34S signature of –1.4‰, a figure unobtainable through the mixing of Cretaceous seawater (+18–19‰) and primary magmatic derived S (0 to –1‰) (Keith et al., Reference Keith, Haase, Klemd, Krumm and Strauss2016). The shallow stockwork at Skouriotissa exhibits a positive δ34S signature of + 6.1‰ suggesting an increased seawater source of S in the upper VMS stratigraphy (Keith et al., Reference Keith, Haase, Klemd, Krumm and Strauss2016). The negative δ34S value in deep stockwork may represent a magmatic volatile input.
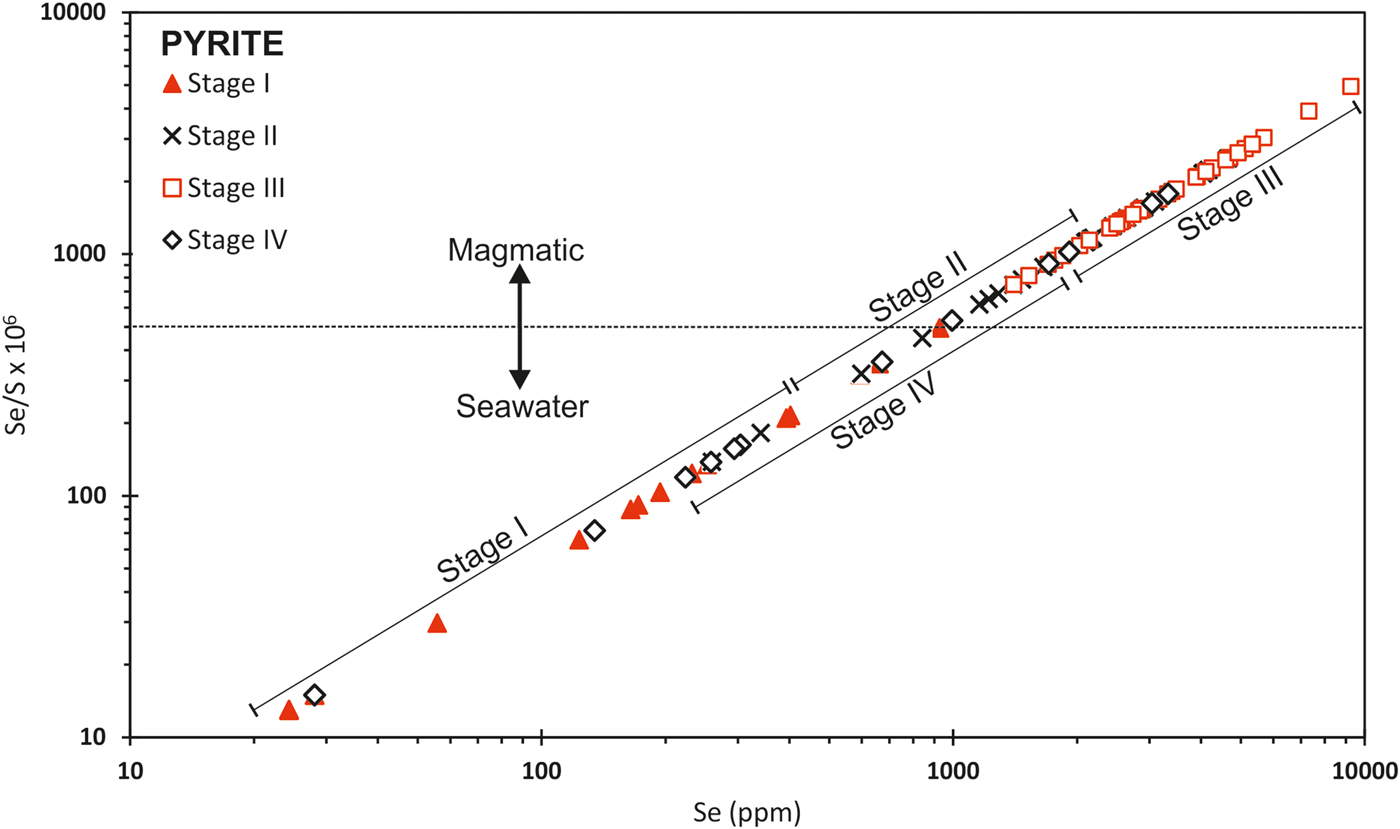
Ratios of S/Se are used as a proxy for the source of sulfide mineralization in a range of environments (e.g. Graham et al., Reference Graham, Holwell, McDonald, Jenkin, Hill, Boyce, Smith and Sangster2017; Layton-Matthews et al., Reference Layton-Matthews, Leybourne, Peter, Scott, Cousens and Eglington2013; Holwell et al., Reference Holwell, Keays, McDonald and Williams2015). More commonly when considering VMS systems Se/S ratios are used (expressed as Se/S × 106) (Layton-Matthews et al., Reference Layton-Matthews, Peter, Scott and Leybourne2008). Chemical similarities between S and Se and the contrasting ratio of Se:S in seawater, mantle sulfides and sediments are used to infer the source of Se in ore deposits (Huston et al., Reference Huston, Sie and Suter1995; Layton-Matthews et al., Reference Layton-Matthews, Peter, Scott and Leybourne2008, Hannington and Barrie, Reference Hannington and Barrie1999). Sulfides with high Se/S (>500) ratios are inferred to have a magmatic source (primitive mantle ~300), whereas low Se/S (<500) ratios indicate a sedimentary or seawater origin (Huston and Large, Reference Huston and Large1989; Layton-Matthews et al., Reference Layton-Matthews, Peter, Scott and Leybourne2008; Hannington and Barrie, Reference Hannington and Barrie1999). The Se/S ratios of pyrite from the South Apliki Breccia Zone are summarized in Fig. 13.
Se/S ratios vs. Se (ppm) for the South Apliki Breccia Zone. Se/S ratios in pyrite increase from alteration stages I–III. Stage IV (supergene) is highly variable. Sulfur is estimated at a stoichiometric value of 53.5% for pyrite.

The Se/S ratios from the South Apliki Breccia Zone used as a proxy for magmatic influx exhibit systematic variation with alteration stage. Stage I samples fall below the proposed seawater-magmatic discrimination line (Se/S = 500 Layton-Matthews et al., Reference Layton-Matthews, Peter, Scott and Leybourne2008) whilst stage II are highly variable and stage III samples plot in the magmatic region (>>500). Stage IV samples exhibit significant scatter plotting in both the seawater and magmatic domains; this may be a function of supergene processes which lead to the mobilization of S during oxidization relative to Se or vice versa. The data suggests a change in source from seawater to magmatic with alteration intensity (discussed in the section ‘Physiochemical Factors Effecting the Incorporation of Te and Se’). Further δ34S analysis which is outside the scope of the present study is needed to confirm the suggested presence of any late magmatic influx at the Apliki VMS.
The ratios of Se/S vary significantly with alteration stage in the South Apliki Breccia Zone; Se/S values range from 24 in stage I pyrite to 9238 in stage III pyrite (Fig. 13). Layton-Matthews et al. (Reference Layton-Matthews, Peter, Scott and Leybourne2008) state that Se/S ratios for sediment starved ridges such as Troodos are <1500. Forty four of 96 analyses are above the 1500 threshold suggested by Layton-Matthews et al. (Reference Layton-Matthews, Peter, Scott and Leybourne2008). Two different mechanisms have been proposed to explain elevated Se/S ratios; a sediment source similar to the Wolverine deposit e.g. sulfide rich shales (Se/S = 38,700 Layton-Matthews et al., 2008) or a magmatic volatile input (e.g. Kidd Creek, Hannington and Barrie, Reference Hannington and Barrie1999).
No sediment relating to ophiolite formation has been documented in the Troodos stratigraphy (e.g. Robinson and Malpas, Reference Robinson, Malpas, Malpas, Moores, Panayiotou and Xenophontos1987), therefore it is unreasonable to assume that Se/S ratios have been modified significantly by sediment-hydrothermal fluid interaction. The transition in Se/S ratios between stage I and III samples suggests a late magmatic influx into the hydrothermal system at Apliki providing one plausible mechanism explaining the enrichment of Se in late stage III pyrite. Hannington and Barrie (Reference Hannington and Barrie1999) report high Se/S values (20,000–50,000) for the bornite-rich zone at Kidd Creek that they attributed to a magmatic influx of H2Se leading to significantly higher Se/S ratios.
It should be noted that as with previous studies (e.g. Graham et al., Reference Graham, Holwell, McDonald, Jenkin, Hill, Boyce, Smith and Sangster2017; Smith et al., Reference Smith, Holwell, McDonald and Boyce2016) a stoichiometric value for S within pyrite of 53.5% has been used to calculate Se/S ratios. Actual S concentrations will vary by a few % around this value, however, the observed trends are expected to prevail.
In addition to a probable magmatic source of metals in the VMS hydrothermal system, base and trace metals are mobilized from epidosite zones (Jowitt et al., Reference Jowitt, Jenkin, Coogan and Naden2012; Patten et al., Reference Patten, Pitcairn and Teagle2017; Schiffman et al., Reference Schiffman, Bettison, Smith, Malpas, Moores, Panayiotou and Xenophontos1990). Mass balance calculations suggest the epidosite zones of the Solea graben are capable of mobilizing enough metal to form a medium sized VMS deposit (Jowitt et al., Reference Jowitt, Jenkin, Coogan and Naden2012; Patten et al., Reference Patten, Pitcairn and Teagle2017).
Studies by Jowitt et al. (Reference Jowitt, Jenkin, Coogan and Naden2012) demonstrate the significance of epidosite zone formation in fulfilling metal budgets for VMS in supra-subduction settings. Similarly, the findings of Patten et al. (Reference Patten, Pitcairn and Teagle2017) demonstrate the importance of epidosite zones in the Se budget with a 90% depletion in Se when compared to cogenetic volcanic glass (Patten et al., Reference Patten, Pitcairn and Teagle2017). Using an average Se concentration of 41 ppm for Cyprus-type VMS and a theoretical hydrothermal reaction zone of 10.9 km2 (5 km2 epidosite and 5.9 km2 diabase), it is estimated that 3100 ± 700 t Se was mobilized in the Solea graben (Patten et al., Reference Patten, Pitcairn and Teagle2017). If this was the case higher average Se would be expected in the VMS of Troodos. Trapping efficiencies are suggested to account for the low Se content of Cyprus-type VMS with only 27% of all mobilized Se being trapped in VMS (Patten et al., Reference Patten, Pitcairn and Teagle2017).
The bulk Se content of VMS in Troodos is poorly constrained with Patten et al., (Reference Patten, Pitcairn and Teagle2017) reporting average compiled data values of 41 ppm, whilst in this study we find an average of 55 ppm in pyrite (n = 345) and 77 ppm (n = 20) in chalcopyrite excluding the extreme values recorded at Apliki. It is unclear from the Patten et al. (Reference Patten, Pitcairn and Teagle2017) study if the mineral-scale distribution of Se is considered in mass-balance calculations. As demonstrated in this study the mineral-scale distribution of Se favours chalcopyrite with average Se contents of 77 and 315 ppm for all Troodos deposits and Skouriotissa, respectively. Taking the mineral-scale distribution of Se into account, the trapping efficiency of Se is likely to be higher than the 27% reported by Patten et al. (Reference Patten, Pitcairn and Teagle2017).
While it is likely that Se is mobilized largely from epidosite zones as suggested by Patten et al. (Reference Patten, Pitcairn and Teagle2017), VMS that are unusually rich in Se such as Apliki and Skouriotissa may have an additional source of enrichment, possibly through a magmatic volatile influx.
Mineral-scale distribution of Te and Se
Data from this study highlights the correlation between Te and so called ‘lattice modifying elements’. Lattice modifying elements increase the substitution potential of large ions such as Te and of particular interest, ions exhibiting moderate positive correlation with Te (as discussed in the section ‘LA-ICP-MS of sulfides’) are Bi and to a lesser extent Co (Fig. 12). Arsenic concentrations are low within Apliki averaging 152 ppm (pyrite, n = 96) compared with all other Cyprus VMS sulfides (Table 3) which average 469 ppm (n = 195). No correlation exists between As and Te suggesting it is not important in the substitution of Te in the Apliki VMS.
Selenium is incorporated preferentially into chalcopyrite over pyrite with an average concentration of 922 (n = 96) and 1576 (n = 54) ppm in pyrite and chalcopyrite, respectively. Selenium contents of chalcopyrite from the South Apliki Breccia Zone average 601–2215 ppm whilst Te is just 4–8 ppm (n = 54). By comparison Te is elevated in pyrite relative to chalcopyrite at 8–16 ppm (n = 96). These observations agree with thermodynamic data that indicate increased affinity for Se decreasing in concentration from galena–claushalite >> chalcopyrite > sphalerite > pyrite > pyrrhotite (Layton-Matthews et al., Reference Layton-Matthews, Peter, Scott and Leybourne2008). Despite high Se concentrations within sulfides at Apliki no selenide phases have been identified suggesting Se is incorporated solely in sulfide minerals. Incorporation of Se is probably accomplished through stoichiometric substitution of Se for S (Maslennikov et al., Reference Maslennikov, Maslennikova, Large and Danyushevsky2009).
Physiochemical factors effecting the incorporation of Te and Se
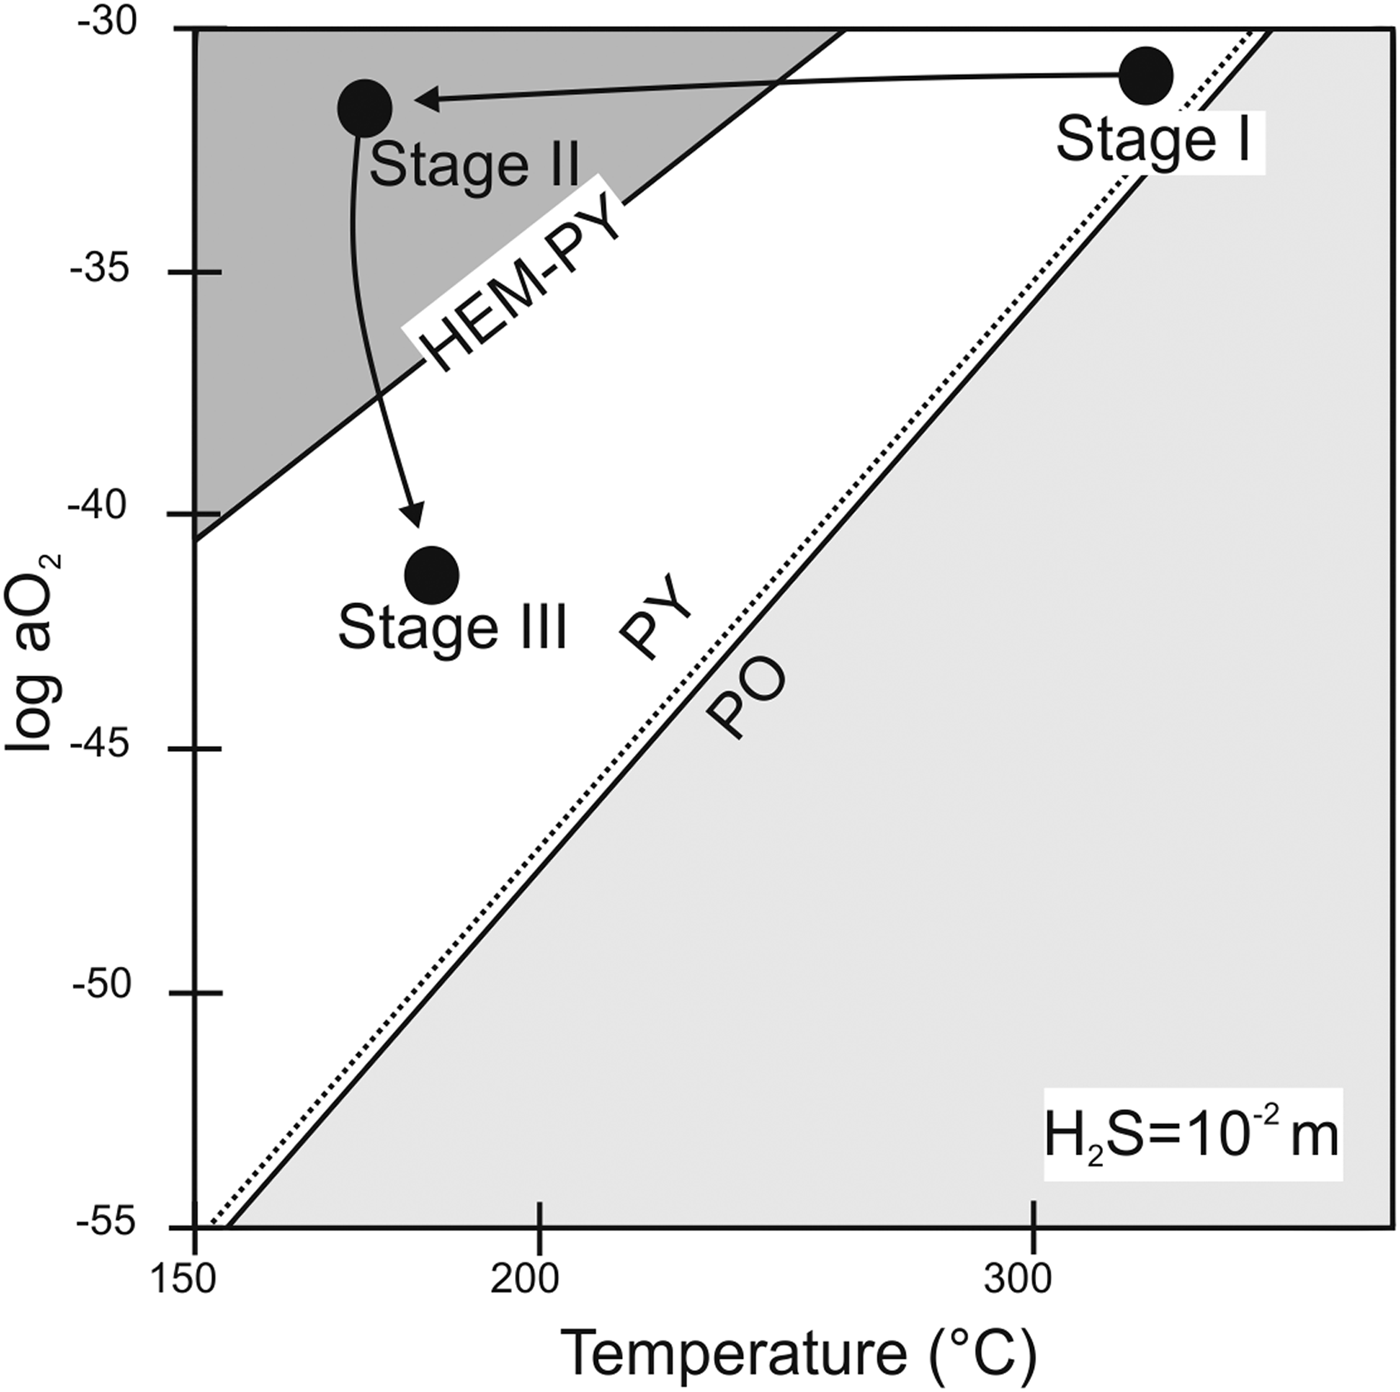
The Apliki mineralogy is dominated by chalcopyrite indicating mineralization temperatures of 280–350°C (e.g. Gill et al., Reference Gill, Piercey and Layton-Matthews2016; Safina et al., Reference Safina, Melekestseva, Nimis, Ankusheva, Yuminov, Kotlyarov and Sadykov2016) (Fig. 14, stage I). The increased incorporation potential of Se at high temperatures is not supported by low average Se in chalcopyrite (601 ppm, n = 12) and pyrite (182 ppm, n = 22) from early stage I sulfides at the South Apliki Breccia Zone. In contrast, stage III pyrite contain an average of 1862 ppm (n = 23) Se and formed at lower temperatures (<280°C). Temperature alone does not explain the significant enrichment of Se in stage III sulfides over stage I sulfides at Apliki. Samples analysed from the South Apliki Breccia Zone represent the highest Se values not only at Apliki, but the whole of Troodos and to our knowledge Cyprus-type VMS in general. They occur in a distinct zone not recorded in any other Cyprus-type VMS system on Troodos. The zone exhibits textural and mineralogical similarities to the Alestos deposit of north-central Troodos; a deposit thought to have formed from late, low-temperature oxidized fluids (Eddy et al., Reference Eddy, Dilek, Hurst and Moores1998; Jowitt et al., Reference Jowitt, Osborn, Thomas, Naden, Gunn, Herrington and Nicolaides2005). Brecciation, silicification and chloritization with abundant hematite are common features between the two deposits however Se analyses from Alestos were below the detection limit (LA-ICP-MS pyrite, n = 5). The similarity in mineralogy suggests a late, low-temperature, oxidizing fluid may be responsible for hematite formation in the South Apliki Breccia Zone however a more complex paragenesis is needed to explain the enrichment in Se.
Stability field for pyrrhotite (PO), pyrite (PY) and hematite (HEM) in log aO2 and temperature space. Stage I, II and III refer to sample paragenesis from reducing to oxidizing and then returning to reducing, low-temperature conditions at the South Apliki Breccia Zone (adapted from Layton-Matthews et al., Reference Layton-Matthews, Peter, Scott and Leybourne2008).

The Ortaklar VMS Turkey is a comparable analogue to the South Apliki Breccia Zone as it has a late oxidized overprint (Yildirim et al., Reference Yildirim, Dönmez, Kang, Lee, Pirajno, Yıldırım, Günay, Seo, Farquhar and Chang2016). No Te or Se data were presented in the latter study however similarities in ore texture and mineralogy suggest the two deposits share a similar paragenesis. At Ortaklar magnetite crosscuts high-temperature hypogene chalcopyrite ore. Yildirim et al. (Reference Yildirim, Dönmez, Kang, Lee, Pirajno, Yıldırım, Günay, Seo, Farquhar and Chang2016) envisage two stages of ore formation; an early high-temperature pyrite- and chalcopyrite-dominated phase involving, reduced, hot, low-pH fluids (e.g. Tornos, Reference Tornos2006) and a second stage of magnetite formation. Increasing  ${f\!}_{{\rm O}_2}$ promoted the dissolution and replacement of sulfides with magnetite, hematite and the var. specularite, and the oxidization of chalcopyrite (Yildirim et al., Reference Yildirim, Dönmez, Kang, Lee, Pirajno, Yıldırım, Günay, Seo, Farquhar and Chang2016).
The South Apliki Breccia Zone and Ortaklar exhibit paragenetic sequences indicative of multiple mineralizing phases under varied but different redox conditions (Fig. 14). At Ortaklar magnetite is the main secondary mineral whereas at Apliki hematite is dominant. Fluids at Apliki are inferred to be of lower pH with a log  ${ f\!}_{{\rm O}_2}$< –30 to –40 at >300°C promoting the precipitation of hematite over magnetite (Fig. 14: stage II/III) (Galley et al., Reference Galley, Hannington, Jonasson and Goodfellow2007). Hematite could also have formed during supergene oxidation of magnetite (4 Fe3O4 + O2 = 6 Fe2O3) however a purely supergene origin for hematite is not likely as fresh euhedral pyrite is preserved in an entirely hematized matrix. This suggests hydrothermal circulation remained active after the formation of hematite. If hematite were solely a supergene phase, pyrite and chalcopyrite would be extensively oxidized, dissolved or completely absent, and this is not observed.
A similar paragenesis of replacement over precipitation of new mineral phases is proposed for the Ortaklar VMS (Yildirim et al., Reference Yildirim, Dönmez, Kang, Lee, Pirajno, Yıldırım, Günay, Seo, Farquhar and Chang2016). Exsolution and zoned textures are common at Ortaklar indicating replacement of early-stage mineralization under varied temperature and redox conditions (Yildirim et al., Reference Yildirim, Dönmez, Kang, Lee, Pirajno, Yıldırım, Günay, Seo, Farquhar and Chang2016). At Ortaklar magnetite represents the last stage in VMS mineralization (Yildirim et al., Reference Yildirim, Dönmez, Kang, Lee, Pirajno, Yıldırım, Günay, Seo, Farquhar and Chang2016) whilst at Apliki both hematite and chalcopyrite are overprinted by euhedral pyrite. The formation of stage III pyrite suggests a temporary influx of oxidized fluids that reverted back towards more reducing conditions and sulfide precipitation (Fig. 14: stage III). The final stage of sulfide precipitation is inferred to be cooler than initial stage I mineralization (<280°C) as chalcopyrite overgrowths are absent (Gill et al., Reference Gill, Piercey and Layton-Matthews2016; Safina et al., Reference Safina, Melekestseva, Nimis, Ankusheva, Yuminov, Kotlyarov and Sadykov2016).
Paragenesis and mechanisms of Se enrichment
A mechanism for such a pronounced and temporary shift in hydrothermal-fluid conditions needs to be addressed to explain the observed paragenesis. Magmatism is considered to be the ultimate driving force in VMS hydrothermal circulation (Choi and Lowell, Reference Choi and Lowell2015; Patten et al., Reference Patten, Pitcairn, Teagle and Harris2016). But the magmatic heat input into the hydrothermal system varies temporally as a function of magmatic flux. This was especially true in Troodos where spreading was accomplished by graben development and crustal thinning during periods of low magmatism (Varga and Moores, Reference Varga, Moores, Malpas, Moores, Panayiotou and Xenophontos1990). During periods of magmatic quiescence increased fault movement along graben bounding faults is predicted. Near-surface fault movement could potentially increase permeability leading to seawater ingress into the upper VMS stratigraphy promoting a locally oxidizing environment at Apliki. The South Apliki Breccia Zone is located between two faults with extensive rotation evident in both footwall and hanging wall lithologies, thus frequent fault movement seems likely. The mineralized contact is sharp with no clear indication of mineralization outside the fault bound block (Fig. 6). We infer that late slip on these bounding faults during the waning stages of VMS formation coupled with a reduced magmatic influx led to increased seawater ingress into the shallow hydrothermal system and locally oxidizing neutral-pH fluids temporarily promoted sulfide dissolution. The brecciated morphology of the South Apliki Breccia Zone supports this observation. Renewed magmatism and the sealing of permeability pathways due to mineral precipitation and possible magmatic volatile influx re-established reducing conditions and led to the formation of late stage III pyrite; a similar model is hypothesized for Ortaklar (see Yildirim et al., Reference Yildirim, Dönmez, Kang, Lee, Pirajno, Yıldırım, Günay, Seo, Farquhar and Chang2016).
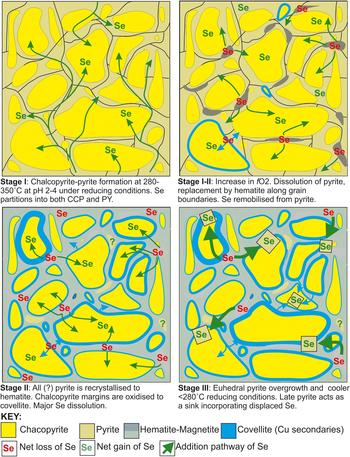
From textural analyses three stages of hypogene overprinting have been identified followed by a fourth stage of supergene alteration. Alteration stages based on geochemistry and mineralogy may be summarized as follows (see Figs 15 and 16):
Summary schematic for the extreme enrichment of Se at the South Apliki Breccia Zone.

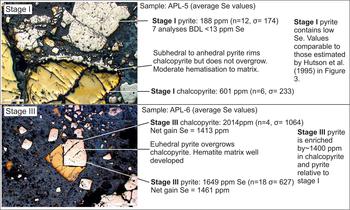
Geochemical comparison of stage I and III pyrite and chalcopyrite. Data is highly variable but demonstrates a net gain in Se of ~1400 ppm between stage I and III pyrite.

Stage I: Chalcopyrite-pyrite mineralization under reducing low pH <4, hypogene (>350°C) fluids and the development of main-stage VMS mineralization under a constant magmatic-hydrothermal flux (Fig. 10). Seawater Se/S ratios prevail averaging 330 (n = 22) in pyrite; Se is sourced from epidosite zones +/– a minor magmatic component (Fig.13).
Stage II: Hematite mineralization involving reduced hydrothermal input and ingress of seawater into the shallow hydrothermal system. Fluid with near neutral pH and increased  ${f}_{\rm \!\!O_2}$ promotes sulfide dissolution and hematite formation. This phase is relatively short-lived given the modest alteration of chalcopyrite rims (Figs 8 and 9). The Se/S values transition rapidly between seawater and magmatic dominant conditions averaging 2158 in pyrite (n = 23) (Fig. 13).
Stage III: Renewed magmatism and decreased fault movement limit further ingress of seawater and reducing conditions are re-established leading to the precipitation of euhedral pyrite overgrowths. Late chalcopyrite overgrowths are absent suggesting lower temperatures of formation (<280°C) than stage I mineralization. The ratio of Se/S within Stage III pyrite is elevated averaging 3480 (n = 22) indicating an increased magmatic component (Fig. 13).
Stage IV represents supergene enrichment of chalcopyrite and pyrite. Samples span a wide range of Se/S ratios (28–3200) and contain significant amounts of covellite, chalcocite and digenite. The Se/S ratios have not been determined for Cu secondaries but are likely to show a large amount of scatter due to the mobilization of Se in low-temperature fluids (Huston et al., Reference Huston, Sie and Suter1995).
The extreme enrichment of Se at the South Apliki Breccia Zone
We suggest that during the mature stages of VMS mineralization the South Apliki Breccia Zone would have formed a high-temperature (>280°C) stockwork overlain by massive sulfides. Stage I pyrite and chalcopyrite were formed under hot reduced conditions synonymous with VMS formation. In this period Se fractionated ‘normally’ and is preferentially enriched in chalcopyrite over pyrite. The transition to oxidizing conditions and replacement of pyrite with hematite expelled Se from the dissolving pyrite (Figs 15 and 16). LA-ICP-MS studies by Genna and Gaboury (Reference Genna and Gaboury2015) and qualitative Time Resolved Analysis from this study show that Se cannot be accommodated in the crystal lattice of hematite in large concentrations. The dissolution of early stage I pyrite led to an excess of Se in solution. Stage III pyrite then precipitated under reducing conditions and due to the elevated concentration of Se in solution readily incorporated elements expelled from the dissolution of stage I pyrite (Fig. 15). Tellurium concentration remains constant in late pyrite as higher temperatures which favour Te incorporation (>280°C) were absent during stage III mineralization.
Theoretical data from Huston et al. (Reference Huston, Sie and Suter1995) shows that Se in pyrite decreases with increasing temperature from 700 ppm to <250 ppm as temperature increases from 150–300°C (Huston et al., Reference Huston, Sie and Suter1995). Modelling also demonstrates that Se concentration in pyrite increases rapidly under oxidizing conditions (log (ԐSO4/ԐH2S) > 0) (Fig. 3). Based on this, stage III pyrite may have precipitated at temperatures as low as 150°C at near neutral pH promoting the incorporation of Se into the crystal lattice. Higher temperatures of >300°C are less favourable for Se incorporation in pyrite with a theoretical maximum of 500 ppm Se; much less than the measured 1862 ppm average (n = 23) (Figs 15 and 16). On this basis pyrite should be distinguishable on Se content which relates to temperature. At Apliki two generations of pyrite are clearly distinguishable based on Se content; stage I low-Se high-temperature pyrite (<250 ppm) and stage III pyrite that formed under cool <300°C oxidized conditions containing >>250 ppm Se (Huston et al., Reference Huston, Sie and Suter1995) (see Fig. 3).
The ability of Cu secondary minerals such as covellite to incorporate Se remains poorly characterized. Auclair et al. (Reference Auclair, Fouquet and Bohn1987) show that the Se content in chalcopyrite remains homogenous with increasing proportions of covellite and digenite. High concentrations of Se within Cu secondaries are reported for the Kidd Creek deposit (Hannington and Barrie, Reference Hannington and Barrie1999); values for digenite average 0.44 wt.% with a maximum of 2.13 wt.% (Hannington and Barrie, Reference Hannington and Barrie1999). It seems likely that Cu secondaries may host significant Se but further analyses are needed to accurately quantify the concentrations of Se in covellite and digenite.
The clear distinction in geochemistry between stage I and III pyrite suggests the timing of mineralization is important in controlling Se enrichment. Selenium incorporation was not simply a function of redox; Se distribution between pyrite generations would be homogenous if this was true. Oxidizing conditions present during the waning stage of VMS formation would have been short-lived and alone do not account for the observed enrichment in Se. In deposits such as Alestos (Troodos) a late pyrite overprint is absent and no enrichment in Se is recorded, however hematite is present, which indicates oxidized conditions. Instead we favour the mobilization of Se from early stage I sulfides during the precipitation of hematite (Fig. 15). The dissolution of Se from pyrite during hematite formation provides a mechanism explaining (1) the distribution of Se and (2) the extreme enrichment in late stage III pyrite.
Conclusion
The South Apliki Breccia Zone is both mineralogically and geochemically distinct within the Solea graben and the Troodos ophiolite. It is significantly enriched in Se with maximum values of 4953 ppm in pyrite and 3956 ppm in chalcopyrite, which are greater than any previously known values for sulfides in Cyprus-type VMS. Dissolution of sulfides and precipitation of oxides caused by an influx of seawater due to fault movement and decreased magmatic-hydrothermal input led to fluctuations in  ${f}_{\!\!{\rm O}_{\rm 2}}$ from reduced to oxidizing conditions. The Se/S ratios suggest an initially seawater-dominated system transitioning to magmatic in stage III pyrite. The addition of a late magmatic input is proposed as a mechanism to restore reducing conditions necessary for stage III pyrite formation. Conditions of stage III mineralization were cooler (<280°C) than stage I mineralization promoting Se incorporation into pyrite. Hematite does not have the same ability as pyrite to accommodate large volumes of Se within its crystal lattice and so the dissolution of early sulfide minerals and precipitation of oxides left an excess of Se in solution. A final magmatic influx toward the end of VMS formation led to overprinting of oxidized facies with late-stage euhedral pyrite. This late stage III pyrite acted as a sink for excess Se and is enriched up to 4953 ppm (averaging 1862 ppm, n = 23). By comparison stage I pyrite, which was not affected by Se displaced during earlier hematite formation averages 182 ppm Se (n = 22). This paper highlights the possible significance of varied redox, dissolution and reprecipitation in achieving high levels of Se enrichment in VMS systems. The findings of this study indicate that chalcopyrite possesses a greater affinity for Se over Te and that rarely, under specific conditions the uptake of Se in chalcopyrite can be matched or be exceeded by pyrite. This study suggests that deposits with fluctuating redox and late oxidizing overprints may contain appreciable Se; moreover this could be important in terms of additional by-product resources and assessing the environmental impact of mining.
Acknowledgements
This research was supported by the Natural Environmental Research Council (NERC) under the tellurium and selenium cycling and supply grant NE/L002191/1 and NE/M010848/1. We thank the Geological Survey Department (GSD) of Cyprus for kindly supplying regional soil geochemistry data. A special thank you to Dr. Andreas Zissimos and the Director Dr. Costas Constantinou for their continued support and enthusiasm. We also thank Hellenic Copper Mines for allowing access to the Apliki mine and Dr. Michael Green, Iphigenia Gabriel and Lazaros Georgiou for their support and advice in the field. We acknowledge the input of Prof. Gawen Jenkin and Dr. Manuel Keith at Leicester University, their guidance helped greatly in advancing this publication. Thanks to Dr. Brian O'Driscoll and an anonymous reviewer for their comments which improved the clarity of this manuscript. This publication is dedicated to the late Prof. Hazel Prichard. Without Hazel none of the above would have been possible, her infectious enthusiasm and passion for geology remain an inspiration.
Supplementary material
To view supplementary material for this article, please visit https://doi.org/10.1180/mgm.2018.81