




No CrossRef data available.
STATIONARITY TESTING WITH COVARIATES
Published online by Cambridge University Press: 05 March 2004
Abstract
Two new stationarity tests are proposed. Both tests can be viewed as generalizations of existing stationarity tests and dominate these in terms of local asymptotic power. Improvements are achieved by accommodating stationary covariates. A Monte Carlo investigation of the small sample properties of the tests is conducted, and an empirical illustration from international finance is provided.This paper has benefited from the comments of Pentti Saikkonen (the co-editor), two anonymous referees, and seminar participants at University of Aarhus, Indiana University, Purdue University, Stanford University, UC Riverside, the 2001 Nordic Econometric Meeting, and the 2001 NBER Summer Institute. A MATLAB program that implements the tests proposed in this paper is available at http://elsa.Berkeley.EDU/users/mjansson.
Information
- Type
- Research Article
- Information
- Copyright
- © 2004 Cambridge University Press
1. INTRODUCTION
Let yt be an observed univariate time series generated by

where μty is deterministic component and vty is an unobserved error process with initial condition v1y = u1y and generating mechanism

where uty is a stationary I(0) process. (In this paper, a process is said to be I(0) if its partial sum process converges weakly to a Brownian motion.)
The problem of testing the null hypothesis H0 : θ = 1 against H1 : θ < 1 has attracted considerable attention in the literature, as has the closely related problem of testing for parameter constancy in the “local-level” unobserved components model. Pertinent references include LaMotte and McWorther (1978), Nyblom and Mäkeläinen (1983), Nyblom (1986), Nabeya and Tanaka (1988), Tanaka (1990), Kwiatkowski, Phillips, Schmidt, and Shin (1992), Saikkonen and Luukkonen (1993a, 1993b), Choi (1994), and Leybourne and McCabe (1994). (For a review, see Stock, 1994.) Under H0, vty = uty and yt is a (trend-) stationary process, whereas yt is an integrated process with a random walk–type nonstationarity under the alternative hypothesis. For this reason, tests of H0 are often referred to as stationarity tests. The cited papers differ somewhat with respect to the assumptions on the underlying stationary process uty and the form of the deterministic component μty. On the other hand, all previous studies (of which the author is aware) have been concerned with the situation where yt is observed in isolation. Specifically, all previously devised tests have exploited only the information contained in yt when testing H0.
In applications, it is extremely rare that individual time series are observed in isolation. As a consequence, it seems reasonable to ask whether more powerful stationarity tests can be obtained be utilizing the information contained in related time series. To fix ideas, suppose a k-vector time series xt of covariates is observed, whose generating mechanism is

where μtx is deterministic component and utx is an unobserved stationary I(0) process. Moreover, suppose the deterministic components μty and μtx are pth-order polynomial trends; that is, suppose

where

are unknown parameters.
The present paper proposes two new tests that exploit the information contained in the covariates xt when testing the null hypothesis that yt is (trend-) stationary. Both tests are valid under mild moment and memory conditions on ut = (uty,utx′)′ and enjoy optimality properties in the special case where ut is Gaussian white noise. The tests can be viewed as generalizations of existing univariate stationarity tests, and the new tests dominate their univariate counterparts in terms of asymptotic local power whenever the zero-frequency correlation between uty and utx is nonzero. (When the zero-frequency correlation equals zero, the new tests coincide with their univariate counterparts.) In fact, substantial power gains can be achieved if an appropriate set of covariates xt can be found. The paper therefore provides an affirmative answer to the question posed in the beginning of the previous paragraph. Results complementary to those obtained here can be found in Hansen (1995) and Elliott and Jansson (2003). These papers demonstrate the usefulness of covariates in the context of testing for an autoregressive unit root.
Section 2 derives the tests and establishes their asymptotic optimality properties in the special case where the underlying innovation sequence is Gaussian white noise. In Section 3, the tests are extended to accommodate general stationary errors by means of nonparametric corrections. Section 4 shows how the tests can be applied to test the null hypothesis that a vector integrated process is cointegrated with a prespecified cointegration vector and presents an empirical illustration. Finally, Section 5 offers a few concluding remarks, and all proofs are collected in the Appendix.
2. TESTING WITH WHITE NOISE ERRORS
Let (yt, xt′)′ be generated by (1)–(4) and suppose

, where

is a known, positive definite matrix (partitioned in conformity with ut). Consider the problem of testing

This problem is that of testing whether the (permanent) component

is absent from the following permanent-transitory decomposition of yt:

To see how the use of stationary covariates xt facilitates the testing problem, consider the series

, whose permanent-transitory decomposition is

where

. Because xt is stationary, the transformation

does not affect the permanent component. On the other hand, Var(uty.x) = (1 − ρ2)Var(uty), so the transformation reduces the variance of the transitory component by a fraction ρ2, where

is the squared coefficient of multiple correlation computed from Σ. The covariates xt can therefore be used to attenuate the transitory component of yt without affecting the permanent component. As a consequence, the use of covariates makes it easier to detect the permanent component of yt if it is present, thereby leading to improvements in power relative to the case where the covariates are ignored. The remainder of this section makes these heuristic ideas more precise.
2.1. Point Optimal Invariant Tests
Define β = (β0y,…, βpy, β0x′,…, βpx′)′ and for any t = 1,…,T, let

where dty = dtx = (1,…, tp)′. Using this notation, the model can be written as

The problem of testing H0 : θ = 1 vs. H1 : θ < 1 is invariant under the group of transformations of the form

. A maximal invariant is mT = D⊥′ vec(z1,…, zT), where D⊥ is a matrix whose columns form an orthonormal basis for the orthogonal complement of the column space of (d1,…, dT)′. For any θ*, let

where yt(θ*) satisfies the difference equation yt(θ*) = Δyt + θ*yt−1(θ*) with initial condition y1(θ*) = y1 and dty(θ*) is defined analogously. The probability density of mT is proportional to

where, for any θ*,
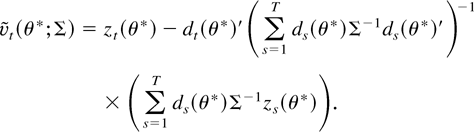
By the Neyman–Pearson lemma, the test that rejects for large values of

is the most powerful invariant test of θ = 1 against the specific alternative θ = θ.
Theorem 1 characterizes the limiting distribution of PT(θ) under a local-to-unity reparameterization of θ and θ in which λ = T(1 − θ) ≥ 0 and λ = T(1 − θ) > 0 are held constant as T increases without bound. The limiting representation of PT(θ) involves the random functional φP, the definition of which is given next.
Let R ∈ [0,1), λ ≥ 0, and λ > 0 be given. Let Σ1/2 be the (lower triangular) Cholesky factor of the 2 × 2 matrix

and for l ∈ {0, λ}, define


, and (V,W)′ is a Brownian motion with covariance matrix Σ. (Here, and elsewhere, the dependence of Ulλ and Dl on R is suppressed.) Finally, let R# = (1 − R2)−1/2 and define

THEOREM 1. Let zt be generated by (1)–(4). Suppose ut ∼ i.i.d. N(0, Σ) and suppose λ = T(1 − θ) ≥ 0 and λ = T(1 − θ) > 0 are fixed as T increases without bound. Then PT(θ) →d φP(λ;λ, ρ2).
Corresponding to any invariant (possibly randomized) test of H0 : θ = 1 there is a test function

such that H0 is rejected with probability φT(m) whenever mT, the maximal invariant, equals m. For any given θ and any such φT, the probability of rejecting H0 is ∫ φT(m) fT(m|θ, Σ) dm, where fT(·|θ, Σ) denotes the probability density of the maximal invariant and the domain of integration is

. A test φT is of level α ∈ (0,1) if its size, namely, ∫ φT(m) fT(m|1, Σ) dm, is less than or equal to α. Similarly, a sequence {φT} of test functions is said to be asymptotically of level α if

When

on the left-hand side equals limT→∞ and the inequality is an equality, {φT} is said to be asymptotically of size α.
The test statistic PT(θ) is point optimal invariant (POI) in the sense that the power

against the point alternative θ = θ is maximized over all invariant tests of level α by the test function 1(PT(θ) > cTP(θ, α, Σ)), where 1(·) is the indicator function and cTP(θ, α, Σ) is such that the test is of size α. This optimality result has an obvious asymptotic analogue. Let the function cP(·,·,·) be implicitly defined by the relation Pr(φP(0;λ, ρ2) > cP(λ, α, ρ2)) = α. The statistic PT(θ) is asymptotically POI under local-to-unity asymptotics in the sense that φTP(mT;λ, α, Σ) = 1(PT(1 − T−1λ) > cP(λ, α, ρ2)) maximizes

over all invariant tests asymptotically of level α; that is,

whenever {φT} is asymptotically of level α. Moreover,

on the right-hand side equals limT→∞ and is given by Pr(φP(λ;λ, ρ2) > cP(λ, α, ρ2)).
Theorem 2 of Saikkonen and Luukkonen (1993a) obtains an upper bound on the asymptotic power function of any location and scale invariant stationarity test in the univariate case. Because scale invariance is not imposed, the result stated here covers a larger class of tests than Theorem 2 of Saikkonen and Luukkonen (1993a) even in the univariate case. (The present paper obviates the need to impose scale invariance by assuming that Σ is known.) Moreover, the multivariate model studied here contains the univariate model of Saikkonen and Luukkonen (1993a) as a special case.
The function πα(λ;ρ2) = Pr(φP(λ;λ, ρ2) > cP(λ, α, ρ2)) provides an upper bound on the asymptotic power function of any invariant test asymptotically of level α. The bound is sharp in the sense that it can be attained for any given λ by the test φTP(mT;λ, α, Σ). Moreover, although no test statistic attains the upper bound uniformly in λ, it turns out that it is possible to construct tests whose power functions are very close to the bound. The Gaussian power envelope therefore constitutes a useful benchmark against which the power function of any invariant test (asymptotically of level α) can be compared.
The univariate counterpart of PT(θ) is

for any θ*. When

, the test that rejects for large values of PTy(θ) is more powerful against the specific alternative θ = θ < 1 than any other invariant test of H0 based solely on yt, where invariance is with respect to transformations of the form

.
When ρ2 = 0, the time series yt and xt are independent. In that case, the covariates xt carry no information about yt, and the statistics PT(θ) and PTy(θ) are equivalent. In contrast, the rejection regions of the tests based on the statistics PT(θ) and PTy(θ) differ whenever ρ2 ≠ 0. These differences persist asymptotically, as PTy(θ) →d φP(λ;λ,0) under the assumptions of Theorem 1. Comparing φP(λ;λ,0) and φP(λ;λ, ρ2), the limiting distribution of PT(θ) is seen to depend on the covariates xt only through the parameter ρ2. As a consequence, the “quality” of the covariates can be summarized by this scalar parameter.
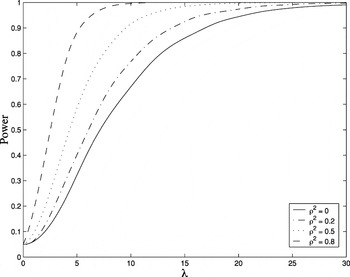
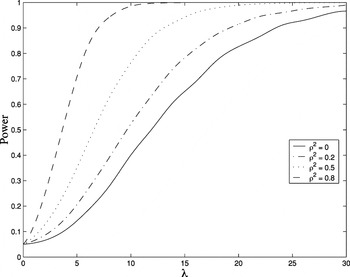
Figure 1 plots π0.05(λ;ρ2) for selected values of ρ2 in the constant mean (p = 0) case. (The curves were generated by taking 20,000 draws from the distribution of the discrete approximation [based on 2,000 steps] to the limiting random variables.) The lowest curve corresponds to ρ2 = 0 and therefore provides an upper bound on the (local asymptotic) power function of any invariant univariate stationarity test. An increase in the quality of the covariates (as measured by ρ2) leads to an increase in the level of the power envelope. Indeed, the difference between the power envelope and its univariate counterpart is quite remarkable for most values of ρ2. For concreteness, consider the alternative λ = 5, which corresponds to a moving average coefficient θ of 0.975 when T = 200. The univariate power envelope is 0.32, whereas the envelopes are 0.40 and 0.58 when ρ2 equals 0.2 and 0.5, respectively. Because they are upper bounds, these power envelopes do not by themselves illustrate the power gains attainable by feasible tests. On the other hand, the evidence presented in Figure 1 clearly suggests that substantial power gains can be achieved by including covariates in a stationarity test provided an appropriate set of covariates can be found. The power envelopes are lower in the linear trend (p = 1) case, but the qualitative conclusion remains the same, as can be seen from Figure 2.

Power envelopes: 5% level tests, constant mean (p = 0).

Power envelopes: 5% level tests, linear trend (p = 1).
2.2. Locally Best Invariant Tests
Even asymptotically, the critical region of the test based on PT(1 − T−1λ) depends on λ. As a consequence, no test is asymptotically uniformly most powerful (with respect to the class of invariant tests) in the sense of Basawa and Scott (1983). In such cases, tests based on weaker optimality concepts seem worth considering. One such concept, the concept of point optimality, justifies the test based on PT(1 − T−1λ[dagger]), where λ[dagger] is a prespecified alternative against which maximal power is desired. As an alternative to that test, the present section develops a test based on a Taylor series expansion of PT(1 − T−1λ) around λ = 0. The resulting test can be implemented without specifying an alternative in advance and enjoys certain local optimality properties.
Using simple algebra, it can be shown that

where


. (The dependence of

has been suppressed to achieve notational economy, and the notation

recognizes the fact that

does not depend on Σ.)
Under the assumptions of Theorem 1,

. As a consequence, the limiting distribution of

is degenerate:

. On the other hand, Theorem 2(a), which follows, shows that under the same assumptions the limiting distribution of LT equals that of the random variable φL(λ;ρ2), where, for any 0 ≤ R < 1,

The test that rejects for large values of LT is asymptotically equivalent (in an obvious sense) to the test that rejects for large values of the second-order Taylor approximation to PT(1 − T−1λ), namely,

. This observation suggests that LT enjoys certain local optimality properties. A sequence {φT} of tests is asymptotically locally efficient (with respect to the class of invariant tests asymptotically of size α) in the sense of Basawa and Scott (1983) if it maximizes

over all invariant tests asymptotically of size α. As Theorem 2(b) shows, any invariant test (asymptotically of size α) is asymptotically locally efficient according to that definition.1
In fact, the conclusion of Theorem 2(b) holds whenever {φT} is asymptotically of level α.

where lT(q)(m|Σ) = ∂q log fT(m|1 − T−1λ, Σ)/∂λq|λ=0. An invariant test is said to be asymptotically locally best invariant (LBI) if it maximizes

over all invariant tests asymptotically of the same size. In regular cases where partial derivatives of ∫ log fT(m|1 − T−1λ, Σ)·fT(m|1, Σ) dm with respect to λ can be obtained by differentiating under the integral sign, this concept of local asymptotic optimality agrees with that of Basawa and Scott (1983) when q* = 1. The testing problem studied here has q* = 2 and as Theorem 2(c) shows, LT is asymptotically LBI in the (stronger) sense defined here.2
An alternative sufficient condition for the conclusion of Theorem 2(c) is that {φT} is asymptotically of level α and α ≤ Pr(φL(0;ρ2) > E(φL(0;ρ2))).
THEOREM 2. Let zt be generated by (1)–(4). Suppose ut ∼ i.i.d. N(0, Σ) and suppose λ = T(1 − θ) ≥ 0 is fixed as T increases without bound. Then
(a) LT →d φL(λ;ρ2).
If {φT} is asymptotically of size α ∈ (0,1), then
(b)

(c)

where φTL(mT;α, Σ) = 1(LT > cL(α, ρ2)) and Pr(φL(0;ρ2) > cL(α, ρ2)) = α.
The univariate counterpart of LT is

where

. The statistics LT and LTy are equivalent if and only if ρ2 = 0. Moreover, LTy →d φL(λ;0) under the assumptions of Theorem 2, so the difference between LT and LTy persists asymptotically whenever ρ2 ≠ 0. As was the case with the power envelopes derived in the previous section, the inclusion of covariates can have a substantial effect on the power properties of the LBI test. (This will become apparent in Section 3.2.)
3. TESTING WITH WEAKLY DEPENDENT ERRORS
The analysis in the previous section proceeded under the restrictive assumption that

, where Σ is known. The optimality theory seems to depend on the normality assumption. On the other hand, it is straightforward to construct feasible test statistics having limiting representations of the form φP and φL under much less stringent assumptions on ut. For instance, the following assumption suffices.
A1.

, where

has full rank, and

, where ∥·∥ is the Euclidean norm.
3.1. Feasible Tests
Define the matrices

where the partitioning is in conformity with ut. Moreover, let ρ2 = ωyy−1ωxy′Ωxx−1ωxy be the squared coefficient of multiple correlation computed from Ω, the long-run covariance matrix of ut. (Because Ω = E(utut′) when ut is white noise, the present definition of ρ2 is consistent with that of Section 2.)
Under A1 and local-to-unity asymptotics, LT(Ω) →d φL(λ;ρ2), so an “autocorrelation robust” version of LT can be obtained by employing the long-run covariance matrix Ω in the definition of the test statistic. Analogously, an autocorrelation robust POI test can be based on PT(θ;Ω). In general, PT(θ;Ω) suffers from “serial correlation bias” under A1. Specifically, PT(θ;Ω) →d φP(λ;λ, ρ2) + 2λωyy.x−1γyy.x, where γyy.x = γyy − ωxy′Ωxx−1γxy. Let

The statistic QT(θ;Ω, Γ) coincides with PT(θ;Ω) when ut is white noise, because Γ = 0 in that case. More generally, QT(θ;Ω, Γ) corrects PT(θ;Ω) for serial correlation bias and QT(θ;Ω, Γ) →d φP(λ;λ, ρ2) under A1 and local-to-unity asymptotics.
In most (if not all) applications, the tests based on LT(Ω) and QT(θ;Ω, Γ) are infeasible because Ω and Γ are unknown. It therefore seems natural to consider the test statistics

, where

are estimators of Ω and Γ, respectively.
THEOREM 3. Let zt be generated by (1)–(4). Suppose A1 holds and suppose λ = T(1 − θ) ≥ 0 and λ = T(1 − θ) > 0 are fixed as T increases without bound. If

.
Conventional (possibly prewhitened) kernel estimators of Ω and Γ (e.g., Andrews, 1991; Andrews and Monahan, 1992) meet the consistency requirement of Theorem 3. Conditions under which VAR(1) prewhitened kernel estimators are consistent are provided in Section 3.3.
The statistics

and

are univariate counterparts of

, respectively. Under the assumptions of Theorem 3,

φL(λ;0). The test statistic

is well known (e.g., Kwiatkowski et al., 1992). On the other hand, the semiparametric version

of the univariate POI test would appear to be new.
3.2. Asymptotic Power Properties
Saikkonen and Luukkonen (1993a) considered the constant mean case and found that their test statistic

, which corresponds to

, has a local asymptotic power function that is almost indistinguishable from the univariate power envelope. The choice λ = 7 produces a test that is asymptotically 0.50-optimal, level 0.05 in the sense of Davies (1969). In other words, λ = 7 is the alternative for which the univariate power envelope for 5% level tests equals 0.50. In the general case, it therefore seems natural to consider

, where λ[dagger] is such that the test statistic is asymptotically 0.50-optimal, level 0.05. Although computationally feasible, such a procedure seems cumbersome in view of the fact that the power envelope for 5% level tests depends not only on the order of the deterministic component in the model but also on the parameter ρ2, which measures the quality of the covariates. To construct test statistics that are asymptotically 0.50-optimal, level 0.05 one would therefore have to use a new λ[dagger] for each ρ2. Fortunately, a much simpler approach yields very satisfactory results. The approach taken here is to use the same λ[dagger] for all values of ρ2. The value of λ[dagger] is chosen in such a way that the test is asymptotically 0.50-optimal, level 0.05 in the worst case scenario ρ2 = 0, the case where the univariate test is optimal. This approach generates a test that has excellent power properties (relative to the power envelope) when ρ2 is low. Moreover,

dominates its univariate counterpart for all values of ρ2. In fact, the test has a power function that is very close to the power envelope even for nonzero values of ρ2.
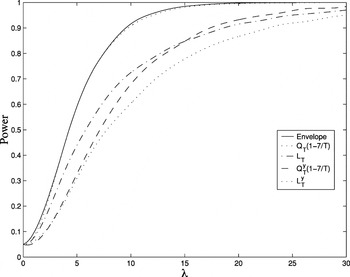
Figure 3 illustrates this in the constant mean case with ρ2 = 0.50. In addition to the power envelope and the local asymptotic power of

, Figure 3 also plots the local power function of the LBI test

and the univariate tests

. Comparing

, it is seen that the inclusion of covariates can lead to huge gains in power in cases where an appropriate set of covariates can be found. The Pitman asymptotic relative efficiency (ARE) of

with respect to

(evaluated at power 0.50) is 1.65, implying that in large samples the univariate test needs 65% more observations than the test using covariates to have comparable power properties when ρ2 = 0.50. The case where covariates are included is qualitatively similar to the univariate case in the sense that the POI test dominates the LBI test for all but extremely small values of λ. Indeed, the inferiority (as measured by the Pitman ARE) of the LBI test is somewhat more pronounced when useful covariates are available.

Power curves, ρ2 = 0.5: 5% level tests, constant mean (p = 0).
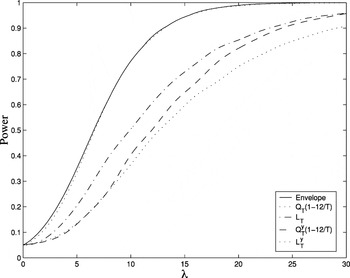
Figure 4 presents results for the linear trend case. The statistics

use λ[dagger] = 12, the value that yields an asymptotically 0.50-optimal, level 0.05 test in the univariate case. All power curves lie below the curves for the constant mean case, but the pattern is the same as in Figure 3. In particular, the statistic

has a power function that lies close to the envelope and far above the power functions corresponding to

. For instance, the Pitman ARE of

with respect to

(evaluated at power 0.50) is 1.82, indicating that the inclusion of covariates is even more beneficial in the linear trend case than in the constant mean case.

Power curves, ρ2 = 0.5: 5% level tests, linear trend (p = 1).
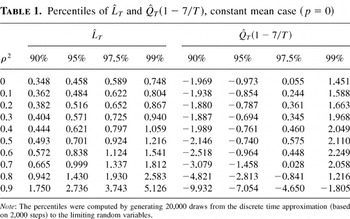
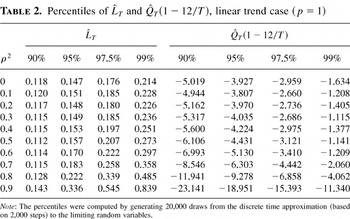
Tables 1 and 2 give various critical values for

for p ∈ {0,1}, which seem to be the cases of empirical relevance. In the case of

, the critical values correspond to the recommended values of λ[dagger], namely, λ[dagger] = 7 when p = 0 and λ[dagger] = 12 when p = 1. The critical values are presented for ρ2 in steps of 0.1. The recommendation is to use the critical value corresponding to

computed from

. Interpolation can be used to obtain critical values for values of

between those given in the tables.
Percentiles of and (1 − 7/T), constant mean case (p = 0)

Percentiles of and (1 − 12/T), linear trend case (p = 1)

In general, point optimal and locally optimal tests may fail to be consistent in curved statistical models (van Garderen, 2000). In view of the following fixed parameter result, the tests based on

are consistent if

are well behaved under fixed alternatives.
THEOREM 4. Let zt be generated by (1)–(4). Suppose A1 holds and suppose θ < 1 and λ = T(1 − θ) > 0 are fixed as T increases without bound. If

, then

for any c ∈ R.
3.3. Covariance Matrix Estimation
Under fairly general conditions, the requirements of Theorems 3 and 4 are met by VAR(1) prewhitened kernel estimators with plug-in bandwidths. These estimators are defined as follows.
For t = 2,…,T, let

, where

is a (k + 1) × (k + 1) matrix and

. Define

where k(·) is a kernel and

is a sequence of (possibly sample-dependent) bandwidth parameters. The proposed estimators of Ω and Γ are

respectively. Consider the following assumption.
A2.
(i) k(0) = 1, k(·) is continuous at zero, sups≥0|k(s)| < ∞, and

, where k(r) = sups≥r|k(s)| (for every r ≥ 0).
(ii)

, where

are positive with

and bT−1 + T−1/2bT = o(1).
(iii)

for some A such that (I − A) is nonsingular.
(iv) The matrix A in (iii) is block upper triangular.
Assumption A2(i) is discussed in Jansson (2002), whereas Assumptions A2(ii) and (iii) are adapted from Andrews and Monahan (1992). Assumption A2(iv) is helpful when studying the behavior of

under fixed alternatives. When

are standard kernel estimators and A2(iii) and (iv) are trivially satisfied. A nondegenerate prewhitening matrix satisfying A2(iii) is discussed subsequently.
LEMMA 5. Let zt be generated by (1)–(4). Suppose A1 and A2(i)–(iii) hold and suppose λ = T(1 − θ) ≥ 0 and λ = T(1 − θ) > 0 are fixed as T increases without bound. Then

.
LEMMA 6. Let zt be generated by (1)–(4). Suppose A1 and A2 hold and suppose θ < 1 and λ = T(1 − θ) > 0 are fixed as T increases without bound. Then

.
Under local alternatives (i.e., under the assumptions of Theorem 3 and Lemma 5), A2(iii) is satisfied by the least squares estimator

On the other hand, standard cointegration arguments can be used to show that the first column of

converges at rate T to first unit vector in

under fixed alternatives (i.e., under the assumptions of Theorem 4 and Lemma 6). As a consequence,

violates A2(iii) under fixed alternatives.
An estimator

satisfying A2(iii) under both local and fixed alternatives can be obtained by modifying

as follows. Let

be the Jordan decomposition of

. Define

, where

is a Jordan matrix obtained from

by dividing the diagonal elements of each Jordan block by max(1,|μ|/0.97), where μ is the eigenvalue (real or complex) associated with the Jordan block and |·| denotes absolute value. This adjustment preserves the eigenvectors of

and bounds the eigenvalues of

away from unity. By construction,

whenever the eigenvalues of

do not exceed 0.97. More generally, the properties of

are easily deduced once the properties of

have been established. In particular,

satisfies A2(iii) whenever

for some ALS (as is true under both local and fixed alternatives), whereas A2(iv) holds if the matrix ALS is block upper triangular (as is the case under fixed alternatives). Lemmas 5 and 6 therefore demonstrate the plausibility of the high-level assumptions on

made in Theorems 3 and 4, respectively.
3.4. Finite Sample Properties
To investigate the finite sample properties of the test statistics introduced in Section 3.1, a small Monte Carlo experiment is conducted. Samples of size T = 200 are generated according to (1)–(4). The errors ut are generated by the bivariate model

where

. Two specifications of cyy(L) are considered:

corresponding to an AR(1) and an MA(1) model for uty, respectively. In both cases,

In particular, the parameter ρ in (8) is the correlation coefficient computed from Ω.
The parameters Ω and Γ are estimated using VAR(1) prewhitened kernel estimators. Specifically,

are constructed using the quadratic spectral kernel (which clearly satisfies Assumption A2(i)) along with a plug-in bandwidth. The value of the plug-in bandwidth is obtained by setting bT = 1.3221·T1/5 (following Andrews, 1991) and

, where

is computed from Andrews's (1991) equation (6.4) (with wa = 1 for all a). Because

is imposed, A2(ii) is automatically satisfied. In particular, the condition

controls the behavior of the estimated bandwidth under fixed alternatives, thereby circumventing the problems discussed by Choi (1994). Finally, the matrix

used in the prewhitening procedure was computed by modifying the ordinary least squares (OLS) estimator in the manner described in Section 3.3.
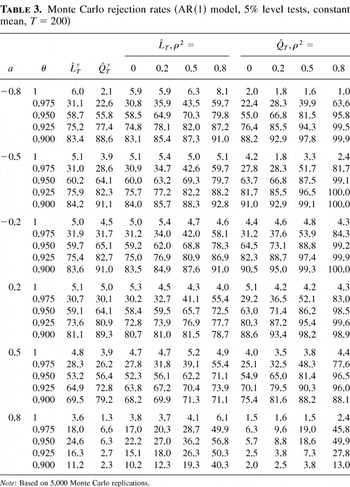
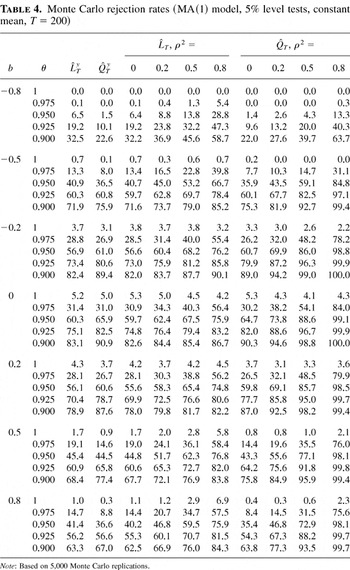
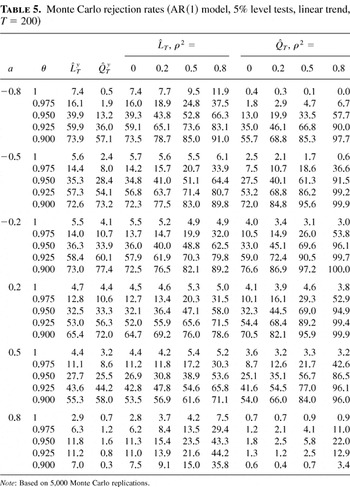
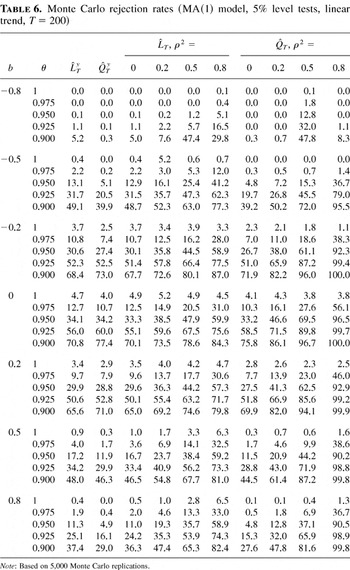
Tables 3 and 4 and 5 and 6 summarize the results for the constant mean and linear trend cases, respectively. The tables report the observed rejection rates of 5% level tests implemented using critical values based on the estimate

computed from

. As was the case with the asymptotic analysis of Section 3.2, the simulation evidence is favorable to the tests developed in this paper. The rejection rates of the new tests are quite similar to those of their univariate counterparts under the null hypothesis. No noticeable loss in power is observed in the case where the covariates are uninformative (when ρ2 = 0), whereas substantial power gains are achieved in the cases where the covariates do carry information about yt.
Monte Carlo rejection rates (AR(1) model, 5% level tests, constant mean, T = 200)

Monte Carlo rejection rates (MA(1) model, 5% level tests, constant mean, T = 200)

Monte Carlo rejection rates (AR(1) model, 5% level tests, linear trend, T = 200)

Monte Carlo rejection rates (MA(1) model, 5% level tests, linear trend, T = 200)

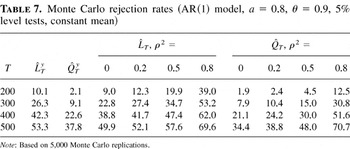
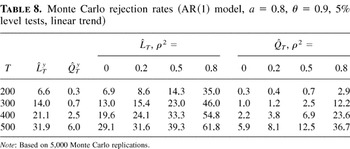
In addition to documenting the superiority of the new tests, the simulation evidence also points out some problems with the small sample properties of the new tests and their univariate counterparts. Rejection rates under the null tend to fall far short of the nominal level in the MA(1) model with |b| ≥ 0.5, which leads to an unnecessary reduction in power when asymptotic critical values are used. Likewise, power is very low in the AR(1) model with a = 0.8, especially so for the point optimal tests. Moreover, the pattern exhibited by the rejection rates in the AR(1) model with a = 0.8 is rather peculiar. In part, the latter phenomenon appears to be due to imprecision of the estimates of Ω and Γ, because simulation results (not reported here) show that the power of the infeasible tests using the true values of Ω and Γ is monotonic in θ. It follows from Theorem 4 that the low power in the AR(1) model with a = 0.8 is a finite sample phenomenon. In an attempt to quantify the effect of a change in the sample size for moderate values of T, Tables 7 and 8 investigate the power against the (fixed) alternative θ = 0.9 for T ∈ {200,300,400,500} in the AR(1) model with a = 0.8. As the sample size increases, power increases in all cases but remains disappointingly low in the case of the point optimal test. Indeed, even in samples of size T = 500 the point optimal test fails to dominate the locally optimal test. As a consequence, the locally optimal test is likely to be superior to the point optimal test in cases where the time series is believed to be highly persistent under the null hypothesis.
Monte Carlo rejection rates (AR(1) model, a = 0.8, θ = 0.9, 5% level tests, constant mean)

Monte Carlo rejection rates (AR(1) model, a = 0.8, θ = 0.9, 5% level tests, linear trend)

4. COINTEGRATION TESTING WITH A PRESPECIFIED COINTEGRATION VECTOR
An example of the applicability of the tests proposed in this paper can be obtained from the theory of cointegrated time series. Suppose (Yt, Xt′)′ is a (k + 1)-vector integrated process generated by the cointegrated system

where Yt is a scalar, Xt is a k-vector, μtY and μtX are deterministic components, and (utY,utX′)′ satisfies A1. Setting yt = Yt − ψ′Xt, μty = μtY − ψ′μtX, xt = ΔXt, and μtx = μtX, the cointegration model reduces to (1)–(4) with (uty,utx′)′ = (utY,utX′)′ and θ = 1. In this context, the null hypothesis θ = 1 is the hypothesis that (Yt, Xt′)′ is cointegrated with cointegrating vector (1, −ψ′)′, whereas the alternative θ < 1 is the hypothesis that (Yt, Xt′)′ is not cointegrated.
In many applications, the (potentially) cointegrating vector (1, −ψ′)′ is known a priori from economic theory (e.g., Horvath and Watson, 1995; Zivot, 2000).3
The stationarity tests considered here cannot be used to test the null hypothesis of cointegration if the (potentially) cointegrating vector is unknown. For that testing problem, Shin (1994), Choi and Ahn (1995), and Nyblom and Harvey (2000) propose consistent tests, whereas Jansson (2003) derives a Gaussian power envelope and develops (nearly) efficient tests.
In part, this is the raison d'être of the huge literature on efficient inference in cointegrated systems (e.g., Phillips and Hansen, 1990; Phillips, 1991; Saikkonen, 1991, 1992; Park, 1992; Stock and Watson, 1993).
As an illustration, the tests are used to examine the relevance of long-run purchasing power parity (PPP). Specifically, the bilateral intercountry relationship between the United States, the domestic country, and the United Kingdom, the foreign country, is considered. The aim is to test the following version of the PPP hypothesis (e.g., Froot and Rogoff, 1995):

where st is the logarithm of domestic currency price of a unit of foreign exchange, ptD and ptF are the logarithms of the price indices in the domestic and foreign countries, and ut is a stationary error term capturing deviations from PPP. In this setup, a rejection of the null hypothesis of cointegration is interpreted as evidence against long-run PPP. Upon imposing the symmetry and proportionality restriction ψD = −ψF = 1, the problem reduces to that of testing whether the real exchange rate st − ptD + ptF is (trend-)stationary. The data consist of st − ptD + ptF and (ΔptD, ΔptF), where the inflation rates ΔptD and ΔptF serve as covariates.
The tests are implemented using quarterly data from the Global Financial Database (GFD). The exchange rate data is from GFD series __GBP_D, and the price series are consumer price indices. Prices for the United States and the United Kingdom are from GFD series CPUSAM and CPGBRM, respectively. When implementing the tests, the nuisance parameters are estimated in the same way as in the Monte Carlo experiment of Section 3.4. The linear trend version of the test statistics is used. In other words, p = 1 is imposed.5
Empirical tests of long-run PPP are typically conducted using the constant mean versions of the univariate stationarity tests. The reasons for not imposing β1 = 0 in (9) are twofold. First, as pointed out to the author by Maurice Obstfeld, the presence of a deterministic trend component in (9) cannot be ruled out on theoretical grounds. Indeed, a simple Harrod–Balassa–Samuelson model (e.g., Obstfeld and Rogoff, 1996, Chap. 4) in which the differential between productivity growth in tradables and nontradables differs between the home and foreign countries might produce a nonzero β1 in (9). Second, the real exchange rate appears to have a nonconstant mean, suggesting that β1 should be unrestricted in (9).
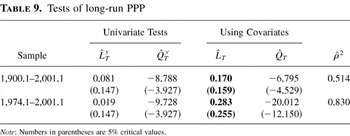
Tests of long-run PPP

In agreement with other studies (e.g., Culver and Papell, 1999; Kuo and Mikkola, 1999), the tests fail to reject the null hypothesis of stationarity when the covariates are ignored. The tests using covariates, in contrast, provide mixed evidence regarding the validity of long-run PPP. The locally optimal test based on

rejects the null at the 5% level in both cases, whereas the point optimal test based on

fails to reject in both cases. To the extent that the stationary component of st − ptD + ptF might be well approximated by a highly persistent autoregressive process (e.g., Engel, 2000; Kuo and Mikkola, 1999), the fact that

fails to reject is to be expected in view of the simulation results reported in Section 3.4. The estimates

are large, suggesting that substantial power gains are achieved by using covariates, which in turn might explain why the

test reaches different conclusions than the univariate tests.
5. CONCLUSION
The tests proposed here enable researchers to utilize the information contained in related (stationary) time series when testing the null hypothesis of stationarity. Substantial power gains can be achieved by doing so. The new tests are easy to implement and are applicable whenever a set of stationary covariates is available. In particular, they are useful when testing the null hypothesis that a vector integrated process is cointegrated with a prespecified cointegrating vector, because an obvious set of covariates is available in that case.
APPENDIX
The proofs of Theorems 1–4 make use of Lemma 7, which shows how functional laws for sample moments of the transformed data zt(θ) and dt(θ) can be deduced from functional laws for zt and dt. Because these preliminary results might be of independent interest, they are presented in greater generality than needed for the proofs of Theorems 1–4.
In Lemma 7 and elsewhere in the Appendix, [lfloor ]·[rfloor ] denotes the integer part of the argument, and all functions are understood to be CADLAG functions defined on the unit interval (equipped with the Skorohod topology).
LEMMA 7. Let {FTt : 0 ≤ t ≤ T,T ≥ 1} and {(gTt′, hTt′)′ : 1 ≤ t ≤ T,T ≥ 1} be triangular arrays of (vector) random variables with FT0 = 0 for all T. Let l > 0 be given and define FTt(l) = ΔFTt + (1 − T−1l)FT, t−1(l), gTt(l) = ΔgTt + (1 − T−1l)gT, t−1(l), and hTt(l) = ΔhTt + (1 − T−1l)hT, t−1(l) with initial conditions FT0(l) = FT0, gT1(l) = gT1, and hT1(l) = hT1.
(a) Suppose

where F and G are continuous. Then

jointly with (A.1), where

.
(b) Suppose

jointly with (A.1), where H, ΓFH, and ΓGH are continuous and H is a semimartingale. Then

jointly with (A.1)–(A.3), where

.
Proof of Lemma 7. For t = 0,…,T, FTt(l) can expressed as

This relation can be restated as follows:

Now, limT→∞ sup0≤r≤1|(1 − T−1l)[lfloor ]Tr[rfloor ] − exp(−lr)| = 0 and FT, [lfloor ]T·[rfloor ] →d F(·), where F is continuous, so

by the continuous mapping theorem.
Next, using summation by parts,

for t = 1,…,T, where

and GTt(l) = ΔGTt + (1 − T−1l)GT, t−1(l) with initial conditions GT0(l) = GT0 = 0. A second application of the proof of FT, [lfloor ]T·[rfloor ](l) →d Fl(·) yields GT, [lfloor ]T·[rfloor ](l) →d Gl(·). Moreover, using Billingsley (1999, Theorem 13.4), max1≤t≤T∥GTt(l) − GT, t−1(l)∥ →d 0, so

as claimed.
Finally, using (GT, [lfloor ]T·[rfloor ], gT, [lfloor ]T·[rfloor ] − gT, [lfloor ]T·[rfloor ](l)) →d (G(·), lGl(·)), the continuous mapping theorem (CMT), and the relation

,

The proof of part (a) is completed by noting that the convergence results in the preceding displays hold jointly with (A.1).
Using the assumption on

, part (a), and CMT,

Next,

where the equalities follow from summation by parts and integration by parts, respectively.
This result, part (a), and CMT can be used to show that

Similar reasoning yields

The convergence results in the preceding displays hold jointly with (A.1)–(A.3). █
Proof of Theorems 1 and 2. The proof proceeds under the assumptions of Theorem 3, strengthening A1 only when necessary. Define Ω and Γ as in Section 3. Let

Because limT→∞ max0≤i≤p sup0≤r≤1|T−i[lfloor ]Tr[rfloor ]i − ri| = 0 and

, where

it follows from Lemma 7 that

where dt[dagger](l) = dt(1 − T−1l)·Ω−1/2′,

and Dly(r) and Dx(r) are defined as in the text.
Standard weak convergence results (e.g., Phillips and Solo, 1992; Phillips, 1988; Hansen, 1992) for linear processes can be used to show that the following hold jointly:


where

is a Brownian motion with covariance matrix

. By (A.7), Lemma 7, and the relation

, simple algebra yields

where vt[dagger](l) = Ω−1/2(zt(1 − T−1l) − dt(1 − T−1l)′β) and Vlλ is defined in terms of V as in the text. Similarly, using (A.7), (A.8), and Lemma 7, the following results can be verified:


where ρ# = (1 − ρ2)−1/2, ρ = (ωyy−1ωxy′Ωxx−1ωxy)1/2, and γyy.x = γyy − ωxy′Ωxx−1γxy.
The limiting distributions of PT(θ;Ω) and LT(Ω) do not depend on k, the dimension of xt. The remainder of the proof proceeds under the assumption that k = 1 and δ = ∥δ∥ = ρ, because these assumptions simplify the algebra without leading to a loss of generality. When k = 1 and δ = ρ, the processes

coincide with the processes Dl, Ul and W defined in the text (with R = ρ). Now,

where

. By the algebra of OLS, (A.6), and (A.9),

for l ∈ {0, λ}. Using this along with (A.10) and (A.11) and the relation

it follows that

Because γyy.x = 0 and Σ = Ω under the assumptions of Theorem 1, the proof of that theorem is now complete.
Next, LT(Ω) can be written as LT*(Ω) + LT**(Ω), where
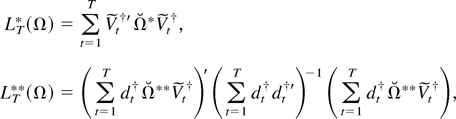

. When

coincide with Σ* and Σ** defined in the text.
The result LT(Ω) →d φL(λ;ρ2) now follows from simple algebra and the fact that

under the assumptions of Theorem 3, where

is defined as in the text (with R = ρ). In particular, Theorem 2(a) follows because Σ = Ω under the assumptions of Theorem 2.
Under the assumptions of Theorem 2, integrals such as

can be differentiated with respect to λ by differentiating under the integral sign. As a consequence,

where Var0(·) denotes the variance under H0. The first inequality uses |φT| ≤ 1 and the modulus inequality for integrals, the second inequality uses the Cauchy–Schwarz inequality, and the last equality uses ∫ l(1)(m|Σ) fT(m|1, Σ) dm = 0 and the fact that l(1)(mT|Σ) differs from

by an additive constant. Using the fact that ut is Gaussian white noise, it is easy to show that

. Therefore, the

of the left-hand side of the preceding display is zero, as claimed in Theorem 2(b).
For any T, let

, where

is such that

By the Neyman–Pearson lemma and the fact that l(2)(mT|Σ) − 2T−1l(1)(mT|Σ) differs from 2LT by an additive constant,

Moreover, for any sequence {ηT} of bounded functions,

where the second equality uses ∫ l(1)(m|Σ)2fT(m|1, Σ) dm = o(1). Combining the preceding displays, it follows that

The proof of 2(c) can be completed by showing that

which, because

is bounded, holds if

where E0(·) denotes expectation under H0. Now, using E0(l(1)(mT|Σ)) = 0 and

and the fact that l(2)(mT|Σ) − 2T−1l(1)(mT|Σ) differs from 2LT by an additive constant,

where LTμ = LT − E0(LT). Using this relation and

,

Because {φT} is asymptotically of level α, it can be shown (using Theorem 2(a)) that

. Therefore,

. Moreover, {LTμ} is uniformly integrable under H0, so

as was to be shown. █
Proof of Theorem 3. The proof of Theorems 1 and 2(a) carries over to the case where Ω and Γ are replaced with consistent estimators if the following analogues of equations (A.6) and (A.9)–(A.11) can be established:


where

.
Now,

where the first inequality uses the triangle inequality, the first equality uses the relation

and (A.6), the second inequality uses the properties of ∥·∥, and the last equality uses (A.6) and the assumption

.
Similar reasoning establishes (A.13)–(A.15). █
Proof of Theorem 4. By the properties of seemingly unrelated regressions,

does not depend on

:

because dty(1) = dty = dtx. Partition

after the first row as

.
Under the assumptions of Theorem 4, it follows from standard results for linear processes that

and

where

W is a Wiener process, and Dy is defined as in the text. By (A.17) and CMT,

where

.
For any

,

and the first inequality uses the fact that

is positive definite, whereas the second inequality uses

, (A.16), (A.18), and the portmanteau theorem (e.g., Billingsley, 1999).
Next, consider

Now,

where

. Partition

after the first row as

. The series

satisfies the difference

with initial condition

. As a consequence,

and the last equality uses

, whereas the convergence result follows from (A.17), Lemma 7, and CMT.
Now,

By the portmanteau theorem and the fact that the function Kλ(·,·) is positive definite in the sense that

for any nonzero, continuous function f (·),

for any

Proof of Lemma 5. Let utPW = ut − Aut−1, where A is the matrix appearing in A2(iii). The equations defining

are sample counterparts of the relations

Because

under A2(iii), it therefore suffices to show that

.
Let

, where

. Let

. Using notation typified by


can be written as

. Now,

by Corollary 4 of Jansson (2002). The proof of

is completed by using the relation

and straightforward, but tedious, bounding arguments to show that

. Indeed, the proof of Lemma 5 of Jansson and Haldrup (2002) carries over to the present case. The details are omitted for brevity.
Proceeding in analogous fashion, it can be shown that

. █
Proof of Lemma 6. In view of A2(iii) and (iv), it suffices to show that

, where

are defined in the obvious way. Now,

because

. Moreover,

where the second inequality uses the Cauchy–Schwarz inequality and the last equality uses

(Jansson, 2002) and

.
Similar reasoning can be used to show that

. █
References
REFERENCES
Andrews, D.W.K.
(1991)
Heteroskedasticity and autocorrelation consistent covariance matrix
estimation.
Econometrica
59,
817–858.Google Scholar
Andrews, D.W.K. &
J.C. Monahan
(1992)
An improved heteroskedasticity and autocorrelation consistent
covariance matrix estimator.
Econometrica
60,
953–966.Google Scholar
Basawa, I.V. &
D.J. Scott
(1983)
Asymptotic Optimal Inference for Non-Ergodic Models.
Springer-Verlag.
Billingsley, P.
(1999)
Convergence of Probability Measures,
2nd ed.
Wiley.
Choi, I.
(1994)
Residual-based tests for the null of stationarity with application
to U.S. macroeconomic time series.
Econometric Theory
10,
720–746.Google Scholar
Choi, I. &
B.C. Ahn
(1995)
Testing for cointegration in a system of equations.
Econometric Theory
11,
952–983.Google Scholar
Culver, S.E. &
D.H. Papell
(1999)
Long-run purchasing power parity with short-run data: Evidence with
Journal of International Money and Finance
18,
751–768.Google Scholar
Davies, R.B.
(1969)
Beta-optimal tests and an application to the summary evaluation of
experiments.
Journal of the Royal Statistical Society, Series B
31,
524–538.Google Scholar
Elliott, G. &
M. Jansson
(2003)
Testing for unit roots with stationary covariates.
Journal of Econometrics
115,
75–89.Google Scholar
Engel, C.
(2000)
Long-run PPP may not hold after all.
Journal of International Economics
57,
243–273.Google Scholar
Froot, K.A. &
K. Rogoff
(1995)
Perspectives on PPP and long-run real exchange rates. In
G. Grossman &
K. Rogoff (eds.),
Handbook of International Economics,
vol. 3, pp.
1647–1688.
North-Holland.
Hansen, B.E.
(1992)
Convergence to stochastic integrals for dependent heterogeneous
processes.
Econometric Theory
8,
489–500.Google Scholar
Hansen, B.E.
(1995)
Rethinking the univariate approach to unit root testing: Using
covariates to increase power.
Econometric Theory
11,
1148–1171.Google Scholar
Horvath, M.T.K. &
M.W. Watson
(1995)
Testing for cointegration when some of the cointegrating vectors
are prespecified.
Econometric Theory
11,
984–1014.Google Scholar
Jansson, M.
(2002)
Consistent covariance matrix estimation for linear processes.
Econometric Theory
18,
1449–1459.Google Scholar
Jansson, M.
(2003)
Point Optimal Tests of the Null Hypothesis of Cointegration.
Working paper,
UC Berkeley.
Jansson, M. &
N. Haldrup
(2002)
Regression theory for nearly cointegrated time series.
Econometric Theory
18,
1309–1335.Google Scholar
Kuo, B.-S. &
A. Mikkola
(1999)
Re-examining long-run purchasing power parity.
Journal of International Money and Finance
18,
251–266.Google Scholar
Kwiatkowski, D.,
P.C.B. Phillips,
P. Schmidt, &
Y. Shin
(1992)
Testing the null hypothesis of stationarity against the alternative
of a unit root: How sure are we that economic time series have a unit
root?
Journal of Econometrics
54,
159–178.Google Scholar
LaMotte, L.R. &
A. McWorther
(1978)
An exact test for the presence of random walk coefficients in a
linear regression model.
Journal of the American Statistical Association
73,
816–820.Google Scholar
Leybourne, S.J. &
B.P.M. McCabe
(1994)
A consistent test for a unit root.
Journal of Business and Economic Statistics
12,
157–166.Google Scholar
Nabeya, S. &
K. Tanaka
(1988)
Asymptotic theory of a test for the constancy of regression
coefficients against the random walk alternative.
Annals of Statistics
16,
218–235.Google Scholar
Nyblom, J.
(1986)
Testing for deterministic linear trend in time series.
Journal of the American Statistical Association
81,
545–549.Google Scholar
Nyblom, J. &
A. Harvey
(2000)
Tests of common stochastic trends.
Econometric Theory
16,
176–199.Google Scholar
Nyblom, J. &
T. Mäkeläinen
(1983)
Comparisons of tests for the presence of random walk coefficients
in a simple linear model.
Journal of the American Statistical Association
78,
856–864.Google Scholar
Obstfeld, M. &
K. Rogoff
(1996)
Foundations of International Macroeconomics.
MIT Press.
Phillips, P.C.B.
(1988)
Weak convergence of sample covariance matrices to stochastic
integrals via martingale approximations.
Econometric Theory
4,
528–533.Google Scholar
Phillips, P.C.B.
(1991)
Optimal inference in cointegrated systems.
Econometrica
59,
283–306.Google Scholar
Phillips, P.C.B. &
B.E. Hansen
(1990)
Statistical inference in instrumental variables regression with
I(1) variables.
Review of Economic Studies
57,
99–125.Google Scholar
Phillips, P.C.B. &
V. Solo
(1992)
Asymptotics for linear processes.
Annals of Statistics
20,
971–1001.Google Scholar
Saikkonen, P.
(1991)
Asymptotically efficient estimation of cointegration regressions.
Econometric Theory
7,
1–21.Google Scholar
Saikkonen, P.
(1992)
Estimation and testing of cointegrated systems by an autoregressive
approximation.
Econometric Theory
8,
1–27.Google Scholar
Saikkonen, P. &
R. Luukkonen
(1993a)
Point optimal tests for testing the order of differencing in ARIMA
models.
Econometric Theory
9,
343–362.Google Scholar
Saikkonen, P. &
R. Luukkonen
(1993b)
Testing for a moving average unit root in autoregressive integrated
moving average models.
Journal of the American Statistical Association
88,
596–601.Google Scholar
Shin, Y.
(1994)
A residual-based test of the null of cointegration against the
alternative of no cointegration.
Econometric Theory
10,
91–115.Google Scholar
Stock, J.H.
(1994)
Unit roots, structural breaks and trends. In
R.F. Engle &
D.L. McFadden (eds.),
Handbook of Econometrics,
vol. 4, pp.
2739–2841.
North-Holland.
Stock, J.H. &
M.W. Watson
(1993)
A simple estimator of cointegrating vectors in higher order
integrated systems.
Econometrica
61,
783–820.Google Scholar
Tanaka, K.
(1990)
Testing for a moving average unit root.
Econometric Theory
6,
433–444.Google Scholar
van Garderen, K.J.
(2000)
An alternative comparison of classical tests: Assessing the
effects of curvature. In
P. Marriott &
M. Salmon (eds.),
Applications of Differential Geometry to Econometrics, pp.
230–280.
Cambridge University Press.
Zivot, E.
(2000)
The power of single equation tests for cointegration when the
cointegrating vector is prespecified.
Econometric Theory
16,
407–439.Google Scholar
Power envelopes: 5% level tests, constant mean (p = 0).
Power envelopes: 5% level tests, linear trend (p = 1).
Power curves, ρ2 = 0.5: 5% level tests, constant mean (p = 0).
Power curves, ρ2 = 0.5: 5% level tests, linear trend (p = 1).
Percentiles of and (1 − 7/T), constant mean case (p = 0)
Percentiles of and (1 − 12/T), linear trend case (p = 1)
Monte Carlo rejection rates (AR(1) model, 5% level tests, constant mean, T = 200)
Monte Carlo rejection rates (MA(1) model, 5% level tests, constant mean, T = 200)
Monte Carlo rejection rates (AR(1) model, 5% level tests, linear trend, T = 200)
Monte Carlo rejection rates (MA(1) model, 5% level tests, linear trend, T = 200)
Monte Carlo rejection rates (AR(1) model, a = 0.8, θ = 0.9, 5% level tests, constant mean)
Monte Carlo rejection rates (AR(1) model, a = 0.8, θ = 0.9, 5% level tests, linear trend)
Tests of long-run PPP
 You have
Access
- 23
- Cited by