



1 Introduction
Helmholtz flows describe any of a number of problems that deal with two-dimensional, steady, inviscid free-streamline flows. They are of particular interest in water-entry and droplet impact problems, as the flow local to the root of the splash jet that forms upon impact reduces to a Helmholtz flow in a frame moving with the root of the jet, see for example Wagner (Reference Wagner1932) or Howison, Ockendon & Wilson (Reference Howison, Ockendon and Wilson1991).
In a recent analysis on droplet–droplet impact problems, Cimpeanu & Moore (Reference Cimpeanu and Moore2018) noted that the Helmholtz solution over-predicts the thickness of the splash jet close to its root and speculate that it is the neglect of other physical effects that leads to this discrepancy. This has led to a desire to find the viscous perturbation to the free-surface location predicted by the Helmholtz flow.
The previous study of Moore et al. (Reference Moore, Ockendon, Ockendon and Oliver2014) addresses the effects of both viscosity and surface tension near free surfaces in high Reynolds number flows. They found that, for flows in which the free boundary is smooth in the inviscid limit, boundary-layer separation could only occur if the dimensionless curvature in the inviscid limit was of the order of the Reynolds number. While this conclusion is indeed true, it was reached based on a study of the third term in an asymptotic expansion in terms of the Reynolds number, but one term was inadvertently omitted from the equation for the perturbed free boundary. It transpires that this term is necessary in order to find the perturbation to the free-surface profile explicitly.
This paper is motivated by both the need to remedy this shortcoming and by the insight provided by powerful computational fluid dynamics tools for flows of this type. We begin in §§ 2–3 by formulating the general Helmholtz problem, reviewing the large-Reynolds-number boundary-layer analysis and showing how the complete three-term asymptotic analysis reduces the problem to that of finding a Dirichlet-to-Neumann map for Laplace’s equation. Although this map cannot be found explicitly, we show in § 4 that conformal mappings can be employed to pose the problem as a singular integro-differential equation that can be solved relatively easily numerically and asymptotically. Using this output and that of the implementation built on top of the  architecture (Popinet Reference Popinet2003, Reference Popinet2009) on the full interfacial problem, in § 5 we present viscous free-boundary profiles for the simple case of symmetric jet impact and for the Wagner droplet impact model studied in, for example, Purvis & Smith (Reference Purvis and Smith2005) and Cimpeanu & Moore (Reference Cimpeanu and Moore2018). The perturbation resulting from viscous effects is found to be remarkably similar in both cases and it reveals the existence of unexpected non-monotonic behaviour in the perturbation to the free boundary near the point where its curvature reaches its maximum.
2 Problem formulation
We consider a steady, two-dimensional free-surface flow of an incompressible fluid of constant density
 $\unicode[STIX]{x1D70C}$
and viscosity
 $\unicode[STIX]{x1D707}$
. The surface tension coefficient is
 $\unicode[STIX]{x1D70E}$
. In the limit in which viscosity and surface tension are vanishingly small, under the assumption that the fluid is initially irrotational, there is an inviscid solution
 $\boldsymbol{U}=\unicode[STIX]{x1D735}\unicode[STIX]{x1D6F7}$
, where
 $\boldsymbol{U}$
is the fluid velocity and
 $\unicode[STIX]{x1D6F7}$
is the velocity potential. The corresponding fluid pressure is given by
 $P$
, while the free-surface location is given by
 $y=H(x)$
. Here
 $(x,y)$
are Cartesian coordinates chosen suitably for a given problem. We call this the Helmholtz solution and, in particular, we non-dimensionalise in such a way that
 $P=0$
or, equivalently,
 $|\unicode[STIX]{x1D735}\unicode[STIX]{x1D6F7}|^{2}=1$
on the free surface. An example of a particular Helmholtz problem is the impact of two symmetric jets, as depicted in figure 1.
The steady impact of two inviscid, symmetric jets is an example of a Helmholtz flow. Subject to suitable non-dimensionalisation – here with
 $L/2$
chosen as a length scale and
 $V$
as a velocity scale – the Helmholtz problem is that depicted on the left. The curvilinear coordinate system
 $(s,n)$
embedded in the inviscid free surface is also shown.

The most convenient coordinate frame in which to analyse perturbations to the Helmholtz flow due to viscosity is one tailored to
 $y=H(x)$
. Here we let
 $(s,n)$
denote this curvilinear coordinate system, where
 $s$
denotes arc length along the free surface and
 $n$
denotes the direction normal to this curve. This coordinate system is depicted in figure 1. The scale factor,
 $m$
, when moving to this system is given by
 $m=1+\unicode[STIX]{x1D705}(s)n$
, where
 $\unicode[STIX]{x1D705}(s)$
denotes the curvature of the inviscid free boundary. We will only consider flows in which the free boundary is of infinite length and the fluid is incoming from
 $s=-\infty$
; thus we take
 $s\in (-\infty ,\infty )$
, and we take the fluid to be in
 $n>0$
. Finally, we shall assume that there is no incoming vorticity from the upstream flow, that is, there is no effect of viscosity as
 $s\rightarrow -\infty$
.
The dimensionless Navier–Stokes equations for the fluid velocity
 $\boldsymbol{u}=(u,v)$
and the fluid pressure
 $p$
in this curvilinear coordinate system are given by
 $$\begin{eqnarray}\displaystyle & \displaystyle \frac{u}{m}\frac{\unicode[STIX]{x2202}u}{\unicode[STIX]{x2202}s}+v\frac{\unicode[STIX]{x2202}u}{\unicode[STIX]{x2202}n}+\frac{\unicode[STIX]{x1D705}uv}{m}=-\frac{1}{m}\frac{\unicode[STIX]{x2202}p}{\unicode[STIX]{x2202}s}+\frac{1}{mRe}\left[\frac{\unicode[STIX]{x2202}\unicode[STIX]{x1D70F}_{ss}}{\unicode[STIX]{x2202}s}+\frac{1}{m}\frac{\unicode[STIX]{x2202}}{\unicode[STIX]{x2202}n}(m^{2}\unicode[STIX]{x1D70F}_{sn})\right], & \displaystyle\end{eqnarray}$$
 $$\begin{eqnarray}\displaystyle & \displaystyle \frac{u}{m}\frac{\unicode[STIX]{x2202}v}{\unicode[STIX]{x2202}s}+v\frac{\unicode[STIX]{x2202}v}{\unicode[STIX]{x2202}n}-\frac{\unicode[STIX]{x1D705}u^{2}}{m}=-\frac{\unicode[STIX]{x2202}p}{\unicode[STIX]{x2202}n}+\frac{1}{mRe}\left[\frac{\unicode[STIX]{x2202}\unicode[STIX]{x1D70F}_{sn}}{\unicode[STIX]{x2202}s}+\frac{\unicode[STIX]{x2202}}{\unicode[STIX]{x2202}n}(m\unicode[STIX]{x1D70F}_{nn})-\unicode[STIX]{x1D705}\unicode[STIX]{x1D70F}_{ss}\right], & \displaystyle\end{eqnarray}$$
 $$\begin{eqnarray}\displaystyle & \displaystyle \frac{\unicode[STIX]{x2202}u}{\unicode[STIX]{x2202}s}+\frac{\unicode[STIX]{x2202}}{\unicode[STIX]{x2202}n}(mv)=0, & \displaystyle\end{eqnarray}$$
where
 $Re=\unicode[STIX]{x1D70C}LU/\unicode[STIX]{x1D707}$
is the Reynolds number based on reference length and velocity scales
 $L$
,
 $U$
respectively, and the components of the stress tensor
 $\unicode[STIX]{x1D749}$
are given by
 $$\begin{eqnarray}\displaystyle & \displaystyle \unicode[STIX]{x1D70F}_{ss}=\frac{2}{m}\left(\frac{\unicode[STIX]{x2202}u}{\unicode[STIX]{x2202}s}+\unicode[STIX]{x1D705}v\right),\quad \unicode[STIX]{x1D70F}_{sn}=\frac{\unicode[STIX]{x2202}u}{\unicode[STIX]{x2202}n}-\frac{\unicode[STIX]{x1D705}u}{m}+\frac{1}{m}\frac{\unicode[STIX]{x2202}v}{\unicode[STIX]{x2202}s},\quad \unicode[STIX]{x1D70F}_{nn}=2\frac{\unicode[STIX]{x2202}v}{\unicode[STIX]{x2202}n}. & \displaystyle\end{eqnarray}$$
On the perturbed free boundary,
 $n=h(s)$
, the kinematic boundary condition is given by
 $$\begin{eqnarray}\displaystyle & \displaystyle v=\frac{u}{m}\frac{\text{d}h}{\text{d}s}. & \displaystyle\end{eqnarray}$$
As mentioned in Moore et al. (Reference Moore, Ockendon, Ockendon and Oliver2014) and discussed in detail in appendix A, the leading-order effect of sufficiently small surface tension is simply to displace the free boundary normally by an amount proportional to
 $-1/We$
, with no induced perturbation to the outer inviscid flow (since the outer problem is invariant under rigid body translations and rotations). Here
 $We=\unicode[STIX]{x1D70C}LU^{2}/\unicode[STIX]{x1D70E}$
is the Weber number. Hence we will neglect surface tension, so that the stress-free boundary conditions are given by
 $$\begin{eqnarray}\displaystyle & \displaystyle \frac{p}{m}\frac{\text{d}h}{\text{d}s}-\frac{\unicode[STIX]{x1D70F}_{ss}}{mRe}\frac{\text{d}h}{\text{d}s}+\frac{\unicode[STIX]{x1D70F}_{sn}}{Re}=0,\quad -p+\frac{\unicode[STIX]{x1D70F}_{nn}}{Re}-\frac{\unicode[STIX]{x1D70F}_{sn}}{mRe}\frac{\text{d}h}{\text{d}s}=0, & \displaystyle\end{eqnarray}$$
on
 $n=h(s)$
. Finally, since the flow field upstream is uniform, we assume far-field conditions such that viscous perturbations are negligible upstream and away from the free surface.
3 Solution for large
 $Re$

For the rest of this analysis, we shall assume that
 $\unicode[STIX]{x1D700}^{2}=1/Re$
is small. Under the assumption that any vorticity generated due to viscosity is confined to a boundary layer near the free surface, the flow for
 $n=O(1)$
can be assumed to be inviscid, with
 $\boldsymbol{u}=\unicode[STIX]{x1D735}\unicode[STIX]{x1D719}$
, for some velocity potential
 $\unicode[STIX]{x1D719}(s,n)$
. In particular, if we expand
 $$\begin{eqnarray}\displaystyle & \displaystyle \unicode[STIX]{x1D719}(s,n)=\unicode[STIX]{x1D719}_{0}(s,n)+\unicode[STIX]{x1D700}^{2}\unicode[STIX]{x1D719}_{1}(s,n)+o(\unicode[STIX]{x1D700}^{2}),\quad p=p_{0}+\unicode[STIX]{x1D700}^{2}p_{1}+o(\unicode[STIX]{x1D700}^{2}), & \displaystyle\end{eqnarray}$$
we simply have
 $\unicode[STIX]{x1D719}_{0}(s,n)=\unicode[STIX]{x1D6F7}(s,n)$
,
 $p_{0}=P(s,n)$
from the Helmholtz solution. In particular,
 $$\begin{eqnarray}\displaystyle u=1+O(n),\quad v=O(n^{2}),\quad p=O(n)\quad \text{as }n\rightarrow 0. & & \displaystyle\end{eqnarray}$$
3.1 Leading-order boundary-layer solution
In order to satisfy the stress-free conditions (2.6a,b ), there must be a boundary layer close to the free surface where viscous effects are non-negligible. Asymptotic expansions introduced in Moore et al. (Reference Moore, Ockendon, Ockendon and Oliver2014) show that the relevant scalings are
 $$\begin{eqnarray}\left.\begin{array}{@{}c@{}}n=\unicode[STIX]{x1D700}{\tilde{n}},\quad u=1+\unicode[STIX]{x1D700}\tilde{u} ,\quad v=\unicode[STIX]{x1D700}^{2}\tilde{v},\quad p=\unicode[STIX]{x1D700}\tilde{p},\quad h=\unicode[STIX]{x1D700}^{2}\tilde{h},\quad \unicode[STIX]{x1D70F}_{ss}=\unicode[STIX]{x1D700}\tilde{\unicode[STIX]{x1D70F}}_{ss},\\ \unicode[STIX]{x1D70F}_{sn}=\tilde{\unicode[STIX]{x1D70F}}_{sn},\quad \unicode[STIX]{x1D70F}_{nn}=\unicode[STIX]{x1D700}\tilde{\unicode[STIX]{x1D70F}}_{nn}.\end{array}\right\}\end{eqnarray}$$
We substitute these into (2.1)–(2.6) and expand as asymptotic series in powers of
 $\unicode[STIX]{x1D700}$
. To leading order in the boundary layer, we see that
 $$\begin{eqnarray}\displaystyle & \displaystyle \frac{\unicode[STIX]{x2202}\tilde{p}_{0}}{\unicode[STIX]{x2202}{\tilde{n}}}=\unicode[STIX]{x1D705},\quad \frac{\unicode[STIX]{x2202}\tilde{u} _{0}}{\unicode[STIX]{x2202}s}=-\frac{\unicode[STIX]{x2202}\tilde{p}_{0}}{\unicode[STIX]{x2202}s}+\frac{\unicode[STIX]{x2202}^{2}\tilde{u} _{0}}{\unicode[STIX]{x2202}{\tilde{n}}^{2}},\quad \frac{\unicode[STIX]{x2202}\tilde{u} _{0}}{\unicode[STIX]{x2202}s}+\frac{\unicode[STIX]{x2202}\tilde{v}_{0}}{\unicode[STIX]{x2202}{\tilde{n}}}=0, & \displaystyle\end{eqnarray}$$
subject to
 $$\begin{eqnarray}\displaystyle & \displaystyle \tilde{p}_{0}(s,0)=0,\quad \frac{\unicode[STIX]{x2202}\tilde{u} _{0}}{\unicode[STIX]{x2202}{\tilde{n}}}(s,0)=\unicode[STIX]{x1D705},\quad \tilde{v}_{0}(s,0)=\frac{\text{d}\tilde{h}_{0}}{\text{d}s}, & \displaystyle\end{eqnarray}$$
on the free surface, and
 $$\begin{eqnarray}\displaystyle \tilde{u} _{0}\rightarrow 0\quad \text{as }s\rightarrow -\infty ,\quad \tilde{u} _{0}\sim -\unicode[STIX]{x1D705}{\tilde{n}}\quad \text{as }{\tilde{n}}\rightarrow \infty . & & \displaystyle\end{eqnarray}$$
Clearly, from (3.4a ), (3.5a ),
 $$\begin{eqnarray}\displaystyle \tilde{p}_{0}=\unicode[STIX]{x1D705}{\tilde{n}}. & & \displaystyle\end{eqnarray}$$
Upon writing
 $\tilde{u} _{0}=-\unicode[STIX]{x1D705}{\tilde{n}}+\tilde{w}$
to reduce (3.4b
) to the heat equation, we employ a Fourier transform in
 $s$
to deduce that
 $$\begin{eqnarray}\displaystyle & \displaystyle \tilde{w}=-\frac{2}{\sqrt{\unicode[STIX]{x03C0}}}\int _{-\infty }^{s}\frac{\unicode[STIX]{x1D705}(\unicode[STIX]{x1D709})}{\sqrt{s-\unicode[STIX]{x1D709}}}\exp \left(\frac{-{\tilde{n}}^{2}}{4(s-\unicode[STIX]{x1D709})}\right)\,\text{d}\unicode[STIX]{x1D709}. & \displaystyle\end{eqnarray}$$
It is straightforward to show that, provided the curvature decays upstream,
 $\tilde{w}$
is exponentially small as
 ${\tilde{n}}\rightarrow \infty$
.
Finally, we can find the transverse velocity,
 $\tilde{v}_{0}$
, by integrating the continuity equation, (3.4c
), and applying the linearised kinematic boundary condition, (3.5c
), on the free surface. However, the pertinent information, as previously deduced in Moore et al. (Reference Moore, Ockendon, Ockendon and Oliver2014), is that, in the far field, we have
 $$\begin{eqnarray}\displaystyle & \displaystyle \tilde{v}_{0}=\frac{\text{d}\unicode[STIX]{x1D705}}{\text{d}s}\frac{{\tilde{n}}^{2}}{2}+\frac{\text{d}\tilde{h}_{0}}{\text{d}s}+2\unicode[STIX]{x1D705}+\text{exp. small terms} & \displaystyle\end{eqnarray}$$
as
 ${\tilde{n}}\rightarrow \infty$
. This gives us a matching condition for the transverse velocity in the
 $O(\unicode[STIX]{x1D700}^{2})$
-problem in the outer region.
3.2 Second-order boundary-layer solution
In order to close the problem and find an equation for the correction to the free-surface location,
 $\tilde{h}_{0}$
, we also need a matching condition for the pressure, which means we must proceed to the next order in our boundary-layer analysis.
At
 $O(\unicode[STIX]{x1D700})$
in (2.2), we have
 $$\begin{eqnarray}\displaystyle & \displaystyle -2\unicode[STIX]{x1D705}\tilde{u} _{0}+\unicode[STIX]{x1D705}^{2}{\tilde{n}}=-\frac{\unicode[STIX]{x2202}\tilde{p}_{1}}{\unicode[STIX]{x2202}{\tilde{n}}}, & \displaystyle\end{eqnarray}$$
subject to the
 $O(\unicode[STIX]{x1D700})$
-form of the normal stress boundary condition, (2.6b
),
 $$\begin{eqnarray}\displaystyle & \displaystyle \tilde{p}_{1}+\tilde{h}_{0}\frac{\unicode[STIX]{x2202}\tilde{p}_{0}}{\unicode[STIX]{x2202}{\tilde{n}}}=0\quad \text{on }{\tilde{n}}=0. & \displaystyle\end{eqnarray}$$
Recalling that
 $\unicode[STIX]{x2202}\tilde{p}_{0}/\unicode[STIX]{x2202}{\tilde{n}}=\unicode[STIX]{x1D705}$
, we find that the second-order boundary-layer pressure is
 $$\begin{eqnarray}\displaystyle & \displaystyle \tilde{p}_{1}=-\frac{3\unicode[STIX]{x1D705}^{2}{\tilde{n}}^{2}}{2}-\unicode[STIX]{x1D705}\tilde{h}_{0}+2\unicode[STIX]{x1D705}\left[\tilde{w}^{\ast }-\int _{{\tilde{n}}}^{\infty }\tilde{w}(s,\unicode[STIX]{x1D708})\,\text{d}\unicode[STIX]{x1D708}\right], & \displaystyle\end{eqnarray}$$
where, from (3.8),
 $$\begin{eqnarray}\displaystyle & \displaystyle \tilde{w}^{\ast }=\int _{0}^{\infty }\tilde{w}(s,\unicode[STIX]{x1D708})\,\text{d}\unicode[STIX]{x1D708}=-2\int _{-\infty }^{s}\unicode[STIX]{x1D705}(\unicode[STIX]{x1D709})\,\text{d}\unicode[STIX]{x1D709}. & \displaystyle\end{eqnarray}$$
In particular, the far-field expansion of the
 $O(\unicode[STIX]{x1D700})$
-pressure is given by
 $$\begin{eqnarray}\displaystyle & \displaystyle \tilde{p}_{1}=-\frac{3\unicode[STIX]{x1D705}^{2}{\tilde{n}}^{2}}{2}+\unicode[STIX]{x1D705}(2\tilde{w}^{\ast }-\tilde{h}_{0})+\text{exp. small terms} & \displaystyle\end{eqnarray}$$
as
 ${\tilde{n}}\rightarrow \infty$
.
3.3 Second-order inviscid problem
We now have enough information to solve for both
 $\unicode[STIX]{x1D719}_{1}$
and
 $\tilde{h}_{0}$
. Following Moore et al. (Reference Moore, Ockendon, Ockendon and Oliver2014), the second-order velocity potential and pressure in the inviscid region satisfy the Laplace and Bernoulli equations
 $$\begin{eqnarray}\displaystyle & \displaystyle \unicode[STIX]{x1D6FB}^{2}\unicode[STIX]{x1D719}_{1}=0,\quad p_{1}+\left[\left(\frac{1}{1+\unicode[STIX]{x1D705}{\tilde{n}}}\right)^{2}\frac{\unicode[STIX]{x2202}\unicode[STIX]{x1D719}_{0}}{\unicode[STIX]{x2202}s}\frac{\unicode[STIX]{x2202}\unicode[STIX]{x1D719}_{1}}{\unicode[STIX]{x2202}s}+\frac{\unicode[STIX]{x2202}\unicode[STIX]{x1D719}_{0}}{\unicode[STIX]{x2202}n}\frac{\unicode[STIX]{x2202}\unicode[STIX]{x1D719}_{1}}{\unicode[STIX]{x2202}n}\right]=0, & \displaystyle\end{eqnarray}$$
in
 $n>0$
. The matching conditions for the transverse component of velocity and the pressure as we approach the boundary layer give
 $$\begin{eqnarray}\displaystyle & \displaystyle \frac{\unicode[STIX]{x2202}\unicode[STIX]{x1D719}_{1}}{\unicode[STIX]{x2202}n}=\frac{\text{d}\tilde{h}_{0}}{\text{d}s}+2\unicode[STIX]{x1D705},\quad \frac{\unicode[STIX]{x2202}\unicode[STIX]{x1D719}_{1}}{\unicode[STIX]{x2202}s}=\unicode[STIX]{x1D705}(\tilde{h}_{0}-2\tilde{w}^{\ast })\quad \text{on }n=0. & \displaystyle\end{eqnarray}$$
We note that it is the equation for
 $\unicode[STIX]{x2202}\unicode[STIX]{x1D719}_{1}/\unicode[STIX]{x2202}s$
in (3.16) that was incorrect in Moore et al. (Reference Moore, Ockendon, Ockendon and Oliver2014), as it did not include the
 $\tilde{w}^{\ast }$
-term, which measures the viscous perturbation to the flow due to the curvature of the Helmholtz free surface. The correct condition makes it somewhat more complicated to derive an expression for the free-surface displacement. We will now show how a Dirichlet-to-Neumann operator can be used to relate the two boundary conditions in (3.16), leading to a singular integro-differential equation for
 $\tilde{h}_{0}(s)$
.
4 Dirichlet-to-Neumann map
Let
 $z=x+\text{i}y$
be a complex variable in the physical plane,
 $\unicode[STIX]{x1D6FA}$
, with the free boundary
 $y=H(x)$
, and let
 $w_{0}=\unicode[STIX]{x1D719}_{0}+\text{i}\unicode[STIX]{x1D713}_{0}$
be the corresponding complex potential. In (3.15)–(3.16), we have derived a problem for the correction to the leading-order inviscid solution in
 $\unicode[STIX]{x1D6FA}$
with complex potential
 $w_{1}(z)$
, which will now be mapped to
 ${\mathcal{W}}(w_{0})$
in the potential plane so that
 $$\begin{eqnarray}\displaystyle & \displaystyle \frac{\text{d}w_{1}}{\text{d}z}=\frac{\text{d}{\mathcal{W}}}{\text{d}w_{0}}\frac{\text{d}w_{0}}{\text{d}z}. & \displaystyle\end{eqnarray}$$
Now, since
 $|w_{0}^{\prime }(z)|^{2}=1$
on the free surface, we set
 $w_{0}^{\prime }(z)=\text{e}^{-\text{i}\unicode[STIX]{x1D703}}$
for
 $\unicode[STIX]{x1D703}\in (\unicode[STIX]{x1D703}_{0},\unicode[STIX]{x1D703}_{1})$
there. Thus, with
 ${\mathcal{W}}={\mathcal{P}}+\text{i}{\mathcal{Q}}$
, we have
 $$\begin{eqnarray}\displaystyle & \displaystyle \frac{\unicode[STIX]{x2202}\unicode[STIX]{x1D719}_{1}}{\unicode[STIX]{x2202}x}-\text{i}\frac{\unicode[STIX]{x2202}\unicode[STIX]{x1D719}_{1}}{\unicode[STIX]{x2202}y}=\text{e}^{-\text{i}\unicode[STIX]{x1D703}}\left(\frac{\unicode[STIX]{x2202}{\mathcal{P}}}{\unicode[STIX]{x2202}\unicode[STIX]{x1D719}_{0}}-\text{i}\frac{\unicode[STIX]{x2202}{\mathcal{P}}}{\unicode[STIX]{x2202}\unicode[STIX]{x1D713}_{0}}\right). & \displaystyle\end{eqnarray}$$
By definition, the tangent and normal to the free surface are given by
 $$\begin{eqnarray}\displaystyle \boldsymbol{t}=(\cos \unicode[STIX]{x1D703},\sin \unicode[STIX]{x1D703}),\quad \boldsymbol{n}=(-\sin \unicode[STIX]{x1D703},\cos \unicode[STIX]{x1D703}), & & \displaystyle\end{eqnarray}$$
so that the first-order velocity is
 $$\begin{eqnarray}\displaystyle \displaystyle \frac{\unicode[STIX]{x2202}\unicode[STIX]{x1D719}_{1}}{\unicode[STIX]{x2202}x}\boldsymbol{i}+\frac{\unicode[STIX]{x2202}\unicode[STIX]{x1D719}_{1}}{\unicode[STIX]{x2202}y}\boldsymbol{j} & = & \displaystyle \left.\left(\frac{1}{1+\unicode[STIX]{x1D705}n}\frac{\unicode[STIX]{x2202}\unicode[STIX]{x1D719}_{1}}{\unicode[STIX]{x2202}s}\boldsymbol{t}+\frac{\unicode[STIX]{x2202}\unicode[STIX]{x1D719}_{1}}{\unicode[STIX]{x2202}n}\boldsymbol{n}\right)\right|_{n=0}\nonumber\\ \displaystyle & = & \displaystyle \displaystyle \left(\cos \unicode[STIX]{x1D703}\frac{\unicode[STIX]{x2202}\unicode[STIX]{x1D719}_{1}}{\unicode[STIX]{x2202}s}-\sin \unicode[STIX]{x1D703}\frac{\unicode[STIX]{x2202}\unicode[STIX]{x1D719}_{1}}{\unicode[STIX]{x2202}n}\right)\boldsymbol{i}+\left(\sin \unicode[STIX]{x1D703}\frac{\unicode[STIX]{x2202}\unicode[STIX]{x1D719}_{1}}{\unicode[STIX]{x2202}s}+\cos \unicode[STIX]{x1D703}\frac{\unicode[STIX]{x2202}\unicode[STIX]{x1D719}_{1}}{\unicode[STIX]{x2202}n}\right)\boldsymbol{j},\end{eqnarray}$$
and hence
 $$\begin{eqnarray}\displaystyle & \displaystyle \frac{\unicode[STIX]{x2202}\unicode[STIX]{x1D719}_{1}}{\unicode[STIX]{x2202}x}-\text{i}\frac{\unicode[STIX]{x2202}\unicode[STIX]{x1D719}_{1}}{\unicode[STIX]{x2202}y}=\text{e}^{-\text{i}\unicode[STIX]{x1D703}}\left(\frac{\unicode[STIX]{x2202}\unicode[STIX]{x1D719}_{1}}{\unicode[STIX]{x2202}s}-\text{i}\frac{\unicode[STIX]{x2202}\unicode[STIX]{x1D719}_{1}}{\unicode[STIX]{x2202}n}\right) & \displaystyle\end{eqnarray}$$
on the free surface.
Therefore, after combining (4.2) and (4.5), we see that
 $$\begin{eqnarray}\displaystyle & \displaystyle \frac{\unicode[STIX]{x2202}{\mathcal{P}}}{\unicode[STIX]{x2202}\unicode[STIX]{x1D719}_{0}}-\text{i}\frac{\unicode[STIX]{x2202}{\mathcal{P}}}{\unicode[STIX]{x2202}\unicode[STIX]{x1D713}_{0}}=\frac{\unicode[STIX]{x2202}\unicode[STIX]{x1D719}_{1}}{\unicode[STIX]{x2202}s}-\text{i}\frac{\unicode[STIX]{x2202}\unicode[STIX]{x1D719}_{1}}{\unicode[STIX]{x2202}n} & \displaystyle\end{eqnarray}$$
on the lowest-order free surface
 $\unicode[STIX]{x1D713}_{0}=1,-\infty <\unicode[STIX]{x1D719}_{0}=s<\infty$
.
Now, let us map the
 $w_{0}$
-plane to the strip
 ${\mathcal{Z}}=\{\unicode[STIX]{x1D701}=\unicode[STIX]{x1D709}+\text{i}\unicode[STIX]{x1D702}\;|\;0<\unicode[STIX]{x1D702}<1,-\infty <\unicode[STIX]{x1D709}<\infty \}$
in a
 $\unicode[STIX]{x1D701}$
-plane under the map
 $\unicode[STIX]{x1D701}=F(w_{0})$
. The complex potential
 ${\mathcal{W}}(w_{0})$
is mapped to
 $\hat{{\mathcal{W}}}(\unicode[STIX]{x1D701})$
. We shall require that the free surface is mapped to
 $\unicode[STIX]{x1D702}=\text{i}$
and the remaining boundaries, which will be lines of symmetry or solid walls, to
 $\unicode[STIX]{x1D702}=0$
; thus the appropriate boundary condition is
 $$\begin{eqnarray}\displaystyle & \displaystyle \frac{\unicode[STIX]{x2202}\hat{{\mathcal{P}}}}{\unicode[STIX]{x2202}\unicode[STIX]{x1D702}}=0\quad \text{on }\unicode[STIX]{x1D702}=0, & \displaystyle\end{eqnarray}$$
where
 $\hat{{\mathcal{W}}}=\hat{{\mathcal{P}}}+\text{i}\hat{{\mathcal{Q}}}$
. On the free surface, we have
 $$\begin{eqnarray}\displaystyle & \displaystyle \frac{\unicode[STIX]{x2202}\hat{{\mathcal{P}}}}{\unicode[STIX]{x2202}\unicode[STIX]{x1D709}}-\text{i}\frac{\unicode[STIX]{x2202}\hat{{\mathcal{P}}}}{\unicode[STIX]{x2202}\unicode[STIX]{x1D702}}=\left[\frac{\unicode[STIX]{x2202}\unicode[STIX]{x1D719}_{1}}{\unicode[STIX]{x2202}s}-\text{i}\frac{\unicode[STIX]{x2202}\unicode[STIX]{x1D719}_{1}}{\unicode[STIX]{x2202}n}\right]\left.\frac{\text{d}}{\text{d}\unicode[STIX]{x1D701}}F^{-1}(\unicode[STIX]{x1D701})\right|_{\unicode[STIX]{x1D701}=\unicode[STIX]{x1D709}+\text{i}}=f(\unicode[STIX]{x1D709})-\text{i}g(\unicode[STIX]{x1D709}), & \displaystyle\end{eqnarray}$$
say, for functions
 $f(\unicode[STIX]{x1D709})$
,
 $g(\unicode[STIX]{x1D709})$
that depend on
 $F(\unicode[STIX]{x1D701})$
.
Now that we have reduced the problem to one in the strip
 ${\mathcal{Z}}$
, we can utilise Fourier transforms to solve both the Dirichlet and Neumann problems separately. Equating them on the boundary, we find that
 $$\begin{eqnarray}\displaystyle \text{i}{\mathcal{F}}(g)(k)=\text{tanh}\,k{\mathcal{F}}(f)(k), & & \displaystyle\end{eqnarray}$$
where
 ${\mathcal{F}}(\cdot )$
indicates the Fourier transform. This is readily inverted to deduce that
 $$\begin{eqnarray}\displaystyle & \displaystyle g(\unicode[STIX]{x1D709})=-\frac{1}{2}\unicode[STIX]{x2A0D}_{-\infty }^{\infty }f(t)\text{cosech}\left(\frac{\unicode[STIX]{x03C0}(\unicode[STIX]{x1D709}-t)}{2}\right)\,\text{d}t, & \displaystyle\end{eqnarray}$$
where the latter integral is interpreted in the Cauchy principal value sense.
5 Two examples
5.1 Symmetric jet impact
Consider the classical problem of the steady impact of two symmetric jets, see for example Milne-Thomson (Reference Milne-Thomson1996). We shall assume that they collide horizontally on the
 $y$
-axis on their line of symmetry so that the system reaches a steady state. The configuration in the top-left quadrant is depicted in figure 2. The corresponding potential plane is depicted in figure 3.
Steady impact of two symmetric jets. By symmetry, we consider the top-left quadrant only. Fluid is entering the domain from BC and leaving the domain at AD.

The potential plane for the steady impact of two symmetric jets.

After a straightforward application of the hodograph method, we find that the inviscid prediction for the free-surface location is given parametrically by
 $$\begin{eqnarray}\displaystyle & \displaystyle x(\unicode[STIX]{x1D703})=-1+\frac{2}{\unicode[STIX]{x03C0}}\log \tan \frac{\unicode[STIX]{x1D703}}{2},\quad y(\unicode[STIX]{x1D703})=1+\frac{2}{\unicode[STIX]{x03C0}}\log \tan \left(\frac{\unicode[STIX]{x1D703}}{2}+\frac{\unicode[STIX]{x03C0}}{4}\right), & \displaystyle\end{eqnarray}$$
where
 $\unicode[STIX]{x1D703}\in (0,\unicode[STIX]{x03C0}/2)$
. The arc length around the free surface and its curvature are given by
 $$\begin{eqnarray}\displaystyle & \displaystyle s(\unicode[STIX]{x1D703})=\frac{2}{\unicode[STIX]{x03C0}}\log \tan \unicode[STIX]{x1D703},\quad \unicode[STIX]{x1D705}(s)=\frac{\unicode[STIX]{x03C0}}{4}\text{sech}\frac{\unicode[STIX]{x03C0}s}{2}. & \displaystyle\end{eqnarray}$$
As is clear from figure 3, the potential plane is the strip
 ${\mathcal{Z}}$
. Hence, with
 $F(\unicode[STIX]{x1D701})=\unicode[STIX]{x1D701}$
,
 $$\begin{eqnarray}\displaystyle & \displaystyle f(s)=\frac{\unicode[STIX]{x2202}\unicode[STIX]{x1D719}_{1}}{\unicode[STIX]{x2202}s},\quad g(s)=\frac{\unicode[STIX]{x2202}\unicode[STIX]{x1D719}_{1}}{\unicode[STIX]{x2202}n}, & \displaystyle\end{eqnarray}$$
so that from (3.16) and (4.10) the perturbation to the free surface satisfies the singular integro-differential equation
 $$\begin{eqnarray}\displaystyle & \displaystyle 0=\frac{\text{d}\tilde{h}_{0}}{\text{d}s}+2\unicode[STIX]{x1D705}(s)+\frac{1}{2}\unicode[STIX]{x2A0D}_{-\infty }^{\infty }\text{cosech}\left(\frac{\unicode[STIX]{x03C0}(s-t)}{2}\right)\left[\tilde{h}_{0}(t)\unicode[STIX]{x1D705}(t)-2\unicode[STIX]{x1D705}(t)\tilde{w}^{\ast }(t)\right]\,\text{d}t, & \displaystyle\end{eqnarray}$$
where
 $$\begin{eqnarray}\displaystyle \tilde{w}^{\ast }=-2\text{arctan}(\text{e}^{\unicode[STIX]{x03C0}s/2}). & & \displaystyle\end{eqnarray}$$
As
 $s\rightarrow \pm \infty$
, we know that the second-order velocity potential in the inviscid region must approximately satisfy
 $$\begin{eqnarray}\displaystyle & \displaystyle \frac{\unicode[STIX]{x2202}^{2}\unicode[STIX]{x1D719}_{1}}{\unicode[STIX]{x2202}n^{2}}=0,\quad \left.\frac{\unicode[STIX]{x2202}\unicode[STIX]{x1D719}_{1}}{\unicode[STIX]{x2202}n}\right|_{n=0}=\frac{\text{d}\tilde{h}_{0}}{\text{d}s}+2\unicode[STIX]{x1D705}(s),\quad \left.\frac{\unicode[STIX]{x2202}\unicode[STIX]{x1D719}_{1}}{\unicode[STIX]{x2202}n}\right|_{n=1}=0, & \displaystyle\end{eqnarray}$$
where the final condition is due to the symmetry of the problem. Hence, we must have
 $$\begin{eqnarray}\displaystyle & \displaystyle \frac{\text{d}\tilde{h}_{0}}{\text{d}s}\rightarrow -2\unicode[STIX]{x1D705}(s)\quad \text{as }s\rightarrow \pm \infty . & \displaystyle\end{eqnarray}$$
This can, however, be improved upon. If we assume that the integrand in the principal value integral in (5.4) satisfies a Hölder condition, we can integrate (5.4) over all
 $s$
and exchange the order of integration to see that
 $$\begin{eqnarray}\displaystyle \tilde{h}_{0}(\infty )=\tilde{h}_{0}(-\infty )-\unicode[STIX]{x03C0}. & & \displaystyle\end{eqnarray}$$
Therefore, the effect of viscosity is to thicken the jet at the outlet by twice the angle the tangent to the free surface turns as
 $s$
increases, or in other words, the ratio of the jet thickness at the outlet (
 $s=\infty$
) to that at the inlet (
 $s=-\infty$
) is given by
 $$\begin{eqnarray}\displaystyle & \displaystyle \frac{(H+\unicode[STIX]{x1D700}^{2}\tilde{h}_{0})(\infty )}{(H+\unicode[STIX]{x1D700}^{2}\tilde{h}_{0})(-\infty )}=1+\frac{\unicode[STIX]{x03C0}}{Re}+o\left(\frac{1}{Re}\right). & \displaystyle\end{eqnarray}$$
We check the veracity of this prediction by comparing (5.9) to results extracted from direct numerical simulations (DNS) of the full unsteady Navier–Stokes equations performed in  (Popinet Reference Popinet2003, Reference Popinet2009). The developed computational configuration includes the air flow and the effects of viscosity and surface tension. We have considered a range of Reynolds numbers from
 $10^{3}$
to
 $1.6\times 10^{4}$
with the Weber number fixed at
 $We=10^{4}$
. The appropriate length and velocity scales upon which these numbers are based have been taken in this problem to be the thickness and speed of the jet upstream (i.e. at BC). The Weber number has been chosen to be consistent with our asymptotic analysis, in which we have assumed that viscous perturbations dominate, or are at worst comparable to, surface tension-driven perturbations to the inviscid flow. The results are displayed in figure 4. We see excellent agreement over a this range of Reynolds numbers.
The correction to the ratio of the size of the jet outlet to the jet inlet as a function of the Reynolds number, with
 $We=10^{4}$
fixed. The analytical prediction (5.9) is depicted by the squares while the results extracted from the DNS are depicted by the circles.

In order to study the perturbed free boundary in more detail, we set
 $$\begin{eqnarray}\displaystyle & \displaystyle s=\frac{2{\hat{s}}}{\unicode[STIX]{x03C0}},\quad t=\frac{2\hat{t}}{\unicode[STIX]{x03C0}},\quad {\hat{h}}({\hat{s}})=\tilde{h}_{0}(s)-2\tilde{w}^{\ast }(s), & \displaystyle\end{eqnarray}$$
so that
 $$\begin{eqnarray}\displaystyle & \displaystyle \frac{\text{d}{\hat{h}}}{\text{d}{\hat{s}}}+\frac{1}{2\unicode[STIX]{x03C0}}\unicode[STIX]{x2A0D}_{-\infty }^{\infty }\frac{{\hat{h}}(\hat{t})}{\cosh \hat{t}\sinh ({\hat{s}}-\hat{t})}\,\text{d}\hat{t}=\frac{1}{\cosh {\hat{s}}}. & \displaystyle\end{eqnarray}$$
An asymptotic expansion of (5.11) allows us to show that
 $$\begin{eqnarray}\displaystyle & \displaystyle {\hat{h}}\sim \left(2+\frac{2}{\unicode[STIX]{x03C0}}\int _{-\infty }^{\infty }\frac{{\hat{h}}(\hat{t})}{1+\text{e}^{2\hat{t}}}\,\text{d}\hat{t}\right)\text{e}^{{\hat{s}}}\quad \text{as }s\rightarrow -\infty , & \displaystyle\end{eqnarray}$$
 $$\begin{eqnarray}\displaystyle & \displaystyle {\hat{h}}\sim \unicode[STIX]{x03C0}+\left(2{\hat{s}}+\frac{2}{\unicode[STIX]{x03C0}}\int _{-\infty }^{\infty }\frac{{\hat{h}}(\hat{t})-\unicode[STIX]{x03C0}}{1+\text{e}^{-2\hat{t}}}\,\text{d}\hat{t}\right)\text{e}^{-{\hat{s}}}\quad \text{as }{\hat{s}}\rightarrow \infty . & \displaystyle\end{eqnarray}$$
We can utilise these far-field expansions to solve (5.11) using collocation. We truncate the
 ${\hat{s}}$
-domain at some large
 $M$
and use (5.12)–(5.13) to approximate
 ${\hat{h}}({\hat{s}})$
far upstream and far downstream respectively. For
 ${\hat{s}}\in (-M,M)$
, we subdivide the domain and approximate
 ${\hat{h}}({\hat{s}})$
by piecewise cubics in each subsection. By enforcing suitable smoothness of the free-surface perturbation, we are able to find the coefficients of the cubics using the singular integro-differential equation.
The viscous correction to the free-surface location,
 $\tilde{h}_{0}(s)$
, for the symmetric jet impact problem (solid line) alongside the corresponding perturbation derived from the DNS (circles). This comparison is displayed for
 $Re=4\times 10^{3},We=10^{4}$
. The solution to (5.4) has been shifted by a constant value to account for the Weber number.

Vorticity in the symmetric jet impingement example. The results of the direct numerical simulations for
 $Re=4000$
,
 $We=10\,000$
depicting: (a) vorticity in both fluids, (b) vorticity in the liquid phase only. There is a clear thickening of the boundary layer as the flow turns the corner of the free surface, as precited by (5.9). The maximum/minimum colour bars in the plots have been chosen to aid visualisation. The maximum value of the vorticity in the liquid phase is approximately
 $1.5$
. (c) Contours of the corresponding leading-order vorticity magnitude extracted from the boundary-layer analysis (5.14) are depicted in the
 $(s,{\tilde{n}})$
-plane. Note that from (5.2a
), the range of
 $s$
in (c) covers the majority of the free surface. We see a similar thickening of the boundary layer downstream.

The leading-order viscous free-surface perturbation
 $\tilde{h}_{0}(s)={\hat{h}}+2\tilde{w}^{\ast }$
is displayed as the solid line in figure 5 alongside data extracted from the DNS, as represented by the circles. Note that the solution of the integro-differential equation has been shifted uniformly in
 $s$
to account for the surface tension that is included in the full numerical simulations (see appendix A for more details). The data from the direct numerical simulations have been calculated by evaluating the normal distance between the inviscid free surface (5.1) and the numerical data for a large range of
 $s$
.
It is clear that there is good agreement between the theoretical prediction and the numerical results in figure 5, except for large negative
 $s$
(cf. figure 6
a). It is perhaps surprising to see that the free-surface perturbation is not monotonic in arc length: there is a minimum in the viscous perturbation close to (but not exactly at) the point of maximum curvature in the inviscid problem (
 $s=0$
). We also note that the dimensionless curvature is always much smaller than
 $Re$
, which means that the scalings in § 3 are never violated.
We have performed extensive numerical investigations into the upstream disparities. Whilst the results are certainly affected by changes in the physical properties (density and viscosity) of the surrounding gas, another significant issue is that the size of the deviations in question are of the order of within the smallest grid cells used in the DNS. The reader should also recall that the size of the perturbations depicted in figure 5 have been scaled by
 $Re$
, so that the size of perturbation we are seeking is of
 $O(10^{-4})$
dimensionless spatial units in a large domain spanning
 $O(10)$
units in either direction, which is a significant computational challenge. Despite this sensitivity near the inlet (which could in principle be improved upon either by further refinement or by using a larger domain at greatly increased computational cost), the overall good quality of the comparison and key features of the results remain consistent across a wide range of parameters constructed in view of the applicability of the asymptotic treatment of the analytical solution.
Finally, we consider the vorticity produced in the boundary layer due to the presence of the curved free surface. The leading-order vorticity is given by
 $$\begin{eqnarray}\displaystyle & \displaystyle \unicode[STIX]{x1D74E}_{0}=\left(\frac{\unicode[STIX]{x2202}\tilde{u} _{0}}{\unicode[STIX]{x2202}{\tilde{n}}}+\unicode[STIX]{x1D705}\right)\boldsymbol{k}=\frac{\unicode[STIX]{x2202}\tilde{w}_{0}}{\unicode[STIX]{x2202}{\tilde{n}}}\boldsymbol{k}, & \displaystyle\end{eqnarray}$$
which is independent of the viscous free-surface perturbation,
 $\tilde{h}_{0}(s)$
.
We display contours of constant vorticity as a function of
 $(s,\!{\tilde{n}})$
in figure 6(c). Firstly, we note that the range of
 $s$
considered encapsulates the majority of the free surface, since
 $\tan \unicode[STIX]{x1D703}$
decays exponentially quickly as a function of
 $s$
, see (5.2a
). The vorticity is relatively small throughout the boundary layer, indeed it decays exponentially as
 ${\tilde{n}}\rightarrow \infty$
and
 $|s|\rightarrow \infty$
. However, there is an evident thickening of the profile downstream of the point of maximum curvature on the inviscid free surface (
 $s=0$
), suggesting that the boundary layer thickens downstream. This is further corroboration of the result given by (5.9).
Plots of vorticity magnitude extracted from the DNS are displayed alongside the analytical prediction. In figure 6(a), the vorticity in both the liquid and air phases is shown, while in figure 6(b), we display simply the vorticity in the liquid phase. We clearly see that the vorticity induced by the jet is larger in the air, while in figure 6(b), it is evident that the boundary layer has thickened as it moves around the corner. Finally, we note that the scales of the colour bars in the DNS plots of figure 6(a,b) have been chosen to aid visualisation: the maximum value of the vorticity in the liquid phase is approximately 1.5, in good agreement with the leading-order analytical prediction of approximately 1.4.
5.2 The Wagner droplet impact problem
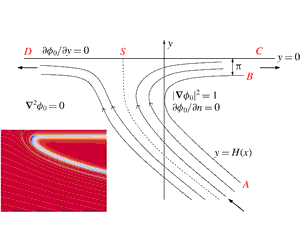
As described in detail in Cimpeanu & Moore (Reference Cimpeanu and Moore2018), the leading-order inner Helmholtz flow arising in the Wagner theory for symmetric droplet impact and its corresponding potential plane are depicted in figures 7–8 respectively. Adapting the solution of Wagner (Reference Wagner1932) for the problem of solid–liquid impact, the leading-order inner solution is given parametrically by
 $$\begin{eqnarray}\displaystyle \unicode[STIX]{x1D719}_{0}+\text{i}\hat{\unicode[STIX]{x1D713}}_{0}=\unicode[STIX]{x1D710}-\log \unicode[STIX]{x1D710}+1,\quad x+\text{i}y=-(1+\unicode[STIX]{x1D710}+4\sqrt{\unicode[STIX]{x1D710}}+\log \unicode[STIX]{x1D710}), & & \displaystyle\end{eqnarray}$$
where the fluid lies in
 $\text{Im}(\unicode[STIX]{x1D710})>0$
, the free surface lies along
 $\unicode[STIX]{x1D710}=a$
where
 $a$
is real and negative and the branch cuts are taken along the negative real axis. In particular, the free-surface profile is given parametrically by
 $$\begin{eqnarray}\displaystyle x(a)=-1-a-\log (-a),\quad y(a)=-\unicode[STIX]{x03C0}-4\sqrt{-a}, & & \displaystyle\end{eqnarray}$$
so that arc length along the free surface and its curvature are given by
 $$\begin{eqnarray}\displaystyle & \displaystyle s=1+a-\log (-a),\quad \unicode[STIX]{x1D705}=\frac{\sqrt{-a}}{(1-a)^{2}}, & \displaystyle\end{eqnarray}$$
where we note that
 $s\in (-\infty ,\infty )$
. Finally, we see that
 $$\begin{eqnarray}\displaystyle \tilde{w}^{\ast }=-2\unicode[STIX]{x03C0}+4\text{arctan}(\sqrt{-a}). & & \displaystyle\end{eqnarray}$$
The (suitably scaled) leading-order inner problem according to Wagner theory for a droplet–droplet impact at small times. The dashed line indicates a dividing streamline that terminates at a relative stagnation point on the body at S. In a frame moving with the turnover points, the problem is a Helmholtz flow.

The potential plane corresponding to the Helmholtz flow depicted in figure 7.

The map from the Wagner potential plane to the strip
 ${\mathcal{Z}}$
is given by
 $$\begin{eqnarray}\displaystyle \unicode[STIX]{x1D719}_{0}+\text{i}\unicode[STIX]{x1D713}_{0}=\text{e}^{\unicode[STIX]{x03C0}\unicode[STIX]{x1D701}}-\unicode[STIX]{x03C0}\unicode[STIX]{x1D701}+1, & & \displaystyle\end{eqnarray}$$
where, on the free surface, we can write
 $a=-\text{e}^{\unicode[STIX]{x03C0}\unicode[STIX]{x1D709}}$
to give
 $$\begin{eqnarray}\displaystyle s=\unicode[STIX]{x1D712}(\unicode[STIX]{x1D709})=-\unicode[STIX]{x03C0}\unicode[STIX]{x1D709}-\text{e}^{\unicode[STIX]{x03C0}\unicode[STIX]{x1D709}}+1. & & \displaystyle\end{eqnarray}$$
Note that
 $\unicode[STIX]{x1D709}=\infty$
corresponds to
 $s=-\infty$
and
 $\unicode[STIX]{x1D709}=-\infty$
corresponds to
 $s=\infty$
. Thus,
 $$\begin{eqnarray}\displaystyle & \displaystyle f(\unicode[STIX]{x1D709})=\unicode[STIX]{x1D712}^{\prime }(\unicode[STIX]{x1D709})\left.\frac{\unicode[STIX]{x2202}\unicode[STIX]{x1D719}_{1}}{\unicode[STIX]{x2202}s}\right|_{s=\unicode[STIX]{x1D712}(\unicode[STIX]{x1D709})},\quad g(\unicode[STIX]{x1D709})=\unicode[STIX]{x1D712}^{\prime }(\unicode[STIX]{x1D709})\left.\frac{\unicode[STIX]{x2202}\unicode[STIX]{x1D719}_{1}}{\unicode[STIX]{x2202}n}\right|_{s=\unicode[STIX]{x1D712}(\unicode[STIX]{x1D709})}, & \displaystyle\end{eqnarray}$$
and hence (4.10) gives
 $$\begin{eqnarray}\displaystyle & \displaystyle \unicode[STIX]{x1D712}^{\prime }(\unicode[STIX]{x1D709})\left.\frac{\unicode[STIX]{x2202}\unicode[STIX]{x1D719}_{1}}{\unicode[STIX]{x2202}n}\right|_{s=\unicode[STIX]{x1D712}(\unicode[STIX]{x1D709})}+\frac{1}{2}\unicode[STIX]{x2A0D}_{-\infty }^{\infty }\unicode[STIX]{x1D712}^{\prime }(t)\left.\frac{\unicode[STIX]{x2202}\unicode[STIX]{x1D719}_{1}}{\unicode[STIX]{x2202}s}\right|_{s=\unicode[STIX]{x1D712}(t)}\text{cosech}\left(\frac{\unicode[STIX]{x03C0}(\unicode[STIX]{x1D709}-t)}{2}\right)\,\text{d}t=0. & \displaystyle\end{eqnarray}$$
Now, recalling (3.16) and letting
 $$\begin{eqnarray}\displaystyle {h\unicode[STIX]{x0030A}}(\unicode[STIX]{x1D709})=\tilde{h}_{0}(s(\unicode[STIX]{x1D709})),\quad {\unicode[STIX]{x1D705}\unicode[STIX]{x0030A}}(\unicode[STIX]{x1D709})=\unicode[STIX]{x1D705}(s(\unicode[STIX]{x1D709})),\quad {w\unicode[STIX]{x0030A}}^{\ast }(\unicode[STIX]{x1D709})=\tilde{w}^{\ast }(s(\unicode[STIX]{x1D709})), & & \displaystyle\end{eqnarray}$$
we see that
 $$\begin{eqnarray}\frac{\text{d}{h\unicode[STIX]{x0030A}}}{\text{d}\unicode[STIX]{x1D709}}+\frac{1}{2}\unicode[STIX]{x2A0D}_{-\infty }^{\infty }\unicode[STIX]{x1D712}^{\prime }(t){\unicode[STIX]{x1D705}\unicode[STIX]{x0030A}}(t)\text{cosech}\left(\frac{\unicode[STIX]{x03C0}}{2}(\unicode[STIX]{x1D709}-t)\right)({h\unicode[STIX]{x0030A}}(t)-2{w\unicode[STIX]{x0030A}}^{\ast }(t))\,\text{d}t=-2\unicode[STIX]{x1D712}^{\prime }(\unicode[STIX]{x1D709}){\unicode[STIX]{x1D705}\unicode[STIX]{x0030A}}(\unicode[STIX]{x1D709}).\end{eqnarray}$$
As with (5.11), if we integrate (5.24) over all
 $\unicode[STIX]{x1D709}$
, then assuming the integrand satisfies a Hölder condition, we can reverse the order of integration, and, after returning to arc length as a variable, we deduce that
 $$\begin{eqnarray}\displaystyle & \displaystyle \tilde{h}_{0}(\infty )=\tilde{h}_{0}(-\infty )-2\int _{-\infty }^{\infty }\unicode[STIX]{x1D705}(s)\,\text{d}s=\tilde{h}_{0}(-\infty )-2\unicode[STIX]{x03C0}. & \displaystyle\end{eqnarray}$$
Thus, the ratio of the perturbation to the Wagner free surface upstream to that downstream is given by
 $$\begin{eqnarray}\displaystyle & \displaystyle \frac{(H+\unicode[STIX]{x1D700}^{2}\tilde{h}_{0})(\infty )}{(H+\unicode[STIX]{x1D700}^{2}\tilde{h}_{0})(-\infty )}=1+\frac{2\unicode[STIX]{x03C0}}{Re}+o\left(\frac{1}{Re}\right). & \displaystyle\end{eqnarray}$$
We can also solve (5.24) numerically by collocation. Firstly, note that
 $$\begin{eqnarray}\displaystyle & \displaystyle \unicode[STIX]{x1D712}^{\prime }(\unicode[STIX]{x1D709}){\unicode[STIX]{x1D705}\unicode[STIX]{x0030A}}(\unicode[STIX]{x1D709})=-\frac{\unicode[STIX]{x03C0}}{2}\text{sech}\frac{\unicode[STIX]{x03C0}\unicode[STIX]{x1D709}}{2}. & \displaystyle\end{eqnarray}$$
Thus, if we set
 $$\begin{eqnarray}\displaystyle \unicode[STIX]{x1D709}=\frac{-2\hat{\unicode[STIX]{x1D709}}}{\unicode[STIX]{x03C0}},\quad t=\frac{-2\hat{t}}{\unicode[STIX]{x03C0}},\quad {\hat{h}}(\hat{\unicode[STIX]{x1D709}})={h\unicode[STIX]{x0030A}}(\unicode[STIX]{x1D709})-2{w\unicode[STIX]{x0030A}}^{\ast }(\unicode[STIX]{x1D709}), & & \displaystyle\end{eqnarray}$$
we deduce that
 $$\begin{eqnarray}\displaystyle & \displaystyle \frac{\text{d}{\hat{h}}}{\text{d}\hat{\unicode[STIX]{x1D709}}}-\frac{1}{\unicode[STIX]{x03C0}}\unicode[STIX]{x2A0D}_{-\infty }^{\infty }\frac{{\hat{h}}(\hat{t})}{\cosh \hat{t}\sinh (\hat{\unicode[STIX]{x1D709}}-\hat{t})}\,\text{d}\hat{t}=\frac{2}{\cosh \hat{\unicode[STIX]{x1D709}}}, & \displaystyle\end{eqnarray}$$
which is remarkably similar to (5.11). As in (5.12)–(5.13), a far-field analysis of (5.29) shows us that
 $$\begin{eqnarray}\displaystyle & \displaystyle {\hat{h}}(\hat{\unicode[STIX]{x1D709}})\sim 4\left(1-\frac{1}{\unicode[STIX]{x03C0}}\int _{-\infty }^{\infty }\frac{{\hat{h}}(\hat{t})}{1+\text{e}^{2\hat{t}}}\,\text{d}\hat{t}\right)\text{e}^{\hat{\unicode[STIX]{x1D709}}}\quad \text{as }\unicode[STIX]{x1D709}\rightarrow -\infty , & \displaystyle\end{eqnarray}$$
 $$\begin{eqnarray}\displaystyle & \displaystyle {\hat{h}}(\hat{\unicode[STIX]{x1D709}})\sim 2\unicode[STIX]{x03C0}-8\hat{\unicode[STIX]{x1D709}}\text{e}^{-\hat{\unicode[STIX]{x1D709}}}-4\left(3+\frac{1}{\unicode[STIX]{x03C0}}\int _{-\infty }^{\infty }\frac{{\hat{h}}(\hat{t})-2\unicode[STIX]{x03C0}}{1+\text{e}^{-2\hat{t}}}\,\text{d}\hat{t}\right)\text{e}^{-\hat{\unicode[STIX]{x1D709}}}\quad \text{as }\hat{\unicode[STIX]{x1D709}}\rightarrow \infty . & \displaystyle\end{eqnarray}$$
Truncating the
 $\hat{\unicode[STIX]{x1D709}}$
-domain and utilising these far-field forms as previously, we can solve for
 ${\hat{h}}(\hat{\unicode[STIX]{x1D709}})$
numerically.
The viscous correction to the free-surface location,
 $\tilde{h}_{0}(s)$
, for the Wagner jet root. Downstream as
 $s\rightarrow \infty$
, one can see the perturbation approaching the predicted value of
 $-2\unicode[STIX]{x03C0}$
, while upstream we see inverse square-root decay back into the bulk (the outer Wagner region), which we display in further detail in the inset, where the dashed line indicates square-root decay.

Returning to original variables, we plot the leading-order viscous correction
 $\tilde{h}_{0}(s)$
as a function of arc length in figure 9. The perturbation is again not monotonic in arc length near the point of maximum curvature in the inviscid problem (
 $s=1.77$
), although in this case we now see that the maximum normal shift from the Helmholtz solution is no longer far downstream, where we approach
 $-2\unicode[STIX]{x03C0}$
as predicted by (5.26). Moreover, we see much slower decay upstream as we move out of the Wagner jet root back into the outer region. The perturbation decays like
 $1/\sqrt{-s}$
as
 $s\rightarrow -\infty$
, which is expected when one considers the far field of the eigensolutions for the Laplace problem depicted in figure 7.
There are significant difficulties in reaching good quantitative agreement between the direct numerical simulation results and the asymptotic theory. Setting up a finite computational domain that is sufficiently large to appropriately incorporate the analytically derived far-field conditions requires length scales of at least
 $O(10^{2})$
. At the same time, as hinted in (5.26), the target solutions would differ by
 $O(Re^{-1})$
, which leads to a multi-scale environment spanning at least six orders of magnitude in a highly sensitive set-up. Furthermore, there are intrinsic subtleties connected to the construction of suitable boundary conditions in the gas, as well as immediately adjacent stable outflow boundary conditions in a non-trivially evolving flow. Ultimately we anticipate that the presence of surface tension effects, solving for the full Navier–Stokes solutions in both liquid and gas phases, as well as any discretisation errors in general would all lead to minor discrepancies at the level of the solution comparison. A representative result is illustrated on the left-hand side of figure 10, wherein an inset is used to indicate the accuracy of the comparison near the turnover region. As dictated by the scalings (3.3), we consider morphological features of interest at
 $O(1/Re)$
, thus making the set-up a very challenging one. Therefore even qualitative flow properties are very difficult to obtain and would in themselves contribute to a successful and informative study. We display such qualitative results in figure 10(b). In order to be consistent with the analytical formulation, the data extracted from the DNS have been shifted horizontally to fix the turnover point at
 $x=0$
and vertically to align with the jet far downstream. We have then calculated the normal distance between the inviscid free-surface profile and the simulation data. We see remarkably good qualitative agreement in the perturbation profile when comparing with figure (9), in particular capturing the square root decay upstream and the non-monotonic behaviour in the profile downstream of
 $s=0$
.
(a) A typical comparison between the analytically predicted shape of the interface (dashed line), alongside a profile extracted from the direct numerical simulations (continuous line). The highlighted inset focuses on the discrepancies found near the turnover point. (b) The normal distance between the free-surface location as found via direct numerical simulation of the full Navier–Stokes problem and the inviscid prediction of Wagner theory. As elaborated upon in the text, we only concentrate on qualitative rather than quantitative comparisons between the analytical prediction and the results of the full simulations, but we see clear evidence of the shape of the viscous perturbation predicted by (5.29) and displayed in figure 9.

Vorticity produced by the curved free boundary in the Wagner jet-root problem. The DNS results for the vorticity distribution in: (a) both the liquid and air phases; (b) the liquid phase only. The simulations use
 $Re=4000$
and
 $We=10\,000$
and we have included streamlines (in white) and chosen the colour bar scale to aid the visualisation. (c) Magnitude of the leading-order vorticity as predicted by the analytical solution. Both the numerical and analytical results show that the boundary layer thickens downstream of the turnover point, as predicted by (5.26).

Finally, we consider the vorticity in the jet-root problem. The vorticity is now given by
 $$\begin{eqnarray}\displaystyle & \displaystyle \unicode[STIX]{x1D74E}_{0}=-\frac{\unicode[STIX]{x2202}\tilde{w}_{0}}{\unicode[STIX]{x2202}{\tilde{n}}}\boldsymbol{k}, & \displaystyle\end{eqnarray}$$
where the change in sign from (5.14) comes from the change in chirality of the coordinate system.
We display the analytical prediction for the leading-order vorticity magnitude in figure 11(c). Similarly to the symmetric jets example and consistent with (5.26), we see that the boundary layer is thicker downstream of the turnover point (
 $s=0$
). A similar picture is seen from the vorticity data extracted from the DNS, as shown for the liquid phase in figure 11(b). As alluded to previously, although we can only really expect qualitative comparisons between the full numerical simulations and the analytical predictions, the minimum value of the vorticity in the numerical solution is
 $-0.62$
, which is not too dissimilar to the analytical prediction, which is approximately
 $-0.6$
(cf. figure 11
c). As with the symmetric jet case, we see in figure 11(a) that vorticity in the air is again larger than that in the liquid, although still of a similar order of magnitude.
Noticeably, in both the analytical predictions and the DNS results, there is no singularity in the boundary layer in this regime, and the conclusion reached in Batchelor (Reference Batchelor1967) and Moore et al. (Reference Moore, Ockendon, Ockendon and Oliver2014) still holds, namely that we require
 $\unicode[STIX]{x1D705}=O(Re)$
somewhere on the free surface for the vorticity to be shed into the inviscid bulk.
6 Conclusion
For steady free-surface flows at large Reynolds number, a systematic three-term asymptotic expansion has confirmed the conjecture of Moore et al. (Reference Moore, Ockendon, Ockendon and Oliver2014) that the principal effect of viscosity is to displace the inviscid free boundary normally by a distance of
 $O(Re^{-1})$
compared to the inviscid length scale. For inviscid free-surface curvature of
 $O(1)$
as
 $Re\rightarrow \infty$
, the analysis confirms that the vorticity is confined to the boundary layer, decaying exponentially quickly as we move away from the boundary.
However, the updated theory yields a singular integro-differential equation for the viscous perturbation to the free-surface location, equation (4.10). Analysis of this equation suggests that, as predicted by Moore et al. (Reference Moore, Ockendon, Ockendon and Oliver2014), the thickening of the free surface (and hence the boundary layer) due to viscosity is proportional to twice the angle turned by the tangent vector to the inviscid free surface (cf. (5.9), (5.26)). However, numerical investigations of (4.10) for two particular examples also predict the appearance of non-monotonic behaviour in the viscous correction to the free-boundary profile: such behaviour has not been reported previously. This prediction has been confirmed by direct numerical simulation of the full Navier–Stokes equations.
Naturally, the discovery of non-monotonic perturbations leads to the question of whether such behaviour is present for other free-surface flows. Possible avenues for further investigation could include flows with larger curvature such as oblique jet impact, or considering the importance of unsteady effects in the production and diffusion of vorticity (particularly if the inviscid free surface is rotating or expanding/contracting). This latter case is considered briefly in Batchelor (Reference Batchelor1967), although he does not consider the shape of the free-surface perturbation due to viscosity. It is an interesting question as to whether an equivalent equation to (4.10) holds in these regimes, and whether it admits solutions with such non-monotonic behaviour, or indeed solutions with singularities.
Moreover, it would be interesting to investigate the stability of these configurations and also to apply the asymptotic approach to free boundaries between nearly inviscid fluids of comparable densities, for which the stability results of, for example, Hooper & Boyd (Reference Hooper and Boyd1983) would be relevant.
Appendix A. The role of surface tension
For the purposes of motivation, we begin by considering the effects of surface tension in a purely inviscid flow with velocity potential
 $\unicode[STIX]{x1D719}$
, in which the flow has nearly unit velocity in the
 $x$
-direction. We assume the cavity boundary is near the
 $x$
-axis and described by
 $y=-\unicode[STIX]{x1D705}x^{2}/2$
in Cartesian coordinates, and on this boundary the normal of derivative of
 $\unicode[STIX]{x1D719}$
vanishes while the pressure is
 $-\unicode[STIX]{x1D705}/We$
. Thus from Bernoulli’s equation,
 $$\begin{eqnarray}\displaystyle & \displaystyle |\unicode[STIX]{x1D735}\unicode[STIX]{x1D719}|^{2}=1+\frac{\unicode[STIX]{x1D705}}{We}. & \displaystyle\end{eqnarray}$$
When we write
 $\unicode[STIX]{x1D719}=x+\unicode[STIX]{x1D719}_{1}$
for small
 $\unicode[STIX]{x1D719}_{1}$
, we find that, to first order in
 $1/We$
,
 $$\begin{eqnarray}\displaystyle & \displaystyle \frac{\unicode[STIX]{x2202}\unicode[STIX]{x1D719}_{1}}{\unicode[STIX]{x2202}y}+\unicode[STIX]{x1D705}x=0\quad \text{and}\quad \frac{\unicode[STIX]{x2202}\unicode[STIX]{x1D719}_{1}}{\unicode[STIX]{x2202}x}=\frac{\unicode[STIX]{x1D705}}{We}, & \displaystyle\end{eqnarray}$$
on
 $y=0$
. This means that the potential function
 $\unicode[STIX]{x1D719}_{1}$
that grows least rapidly at infinity (in order to match with a far field) is
 $$\begin{eqnarray}\displaystyle & \displaystyle \unicode[STIX]{x1D719}_{1}=-\unicode[STIX]{x1D705}x\left(y-\frac{1}{We}\right), & \displaystyle\end{eqnarray}$$
and the effect of surface tension is to translate the free boundary normally.
However, when
 $Re$
is large but finite with
 $1/We=O(1/Re)$
, we can in fact go further than this. Writing
 $$\begin{eqnarray}\displaystyle & \displaystyle \frac{1}{We}=\frac{\unicode[STIX]{x1D6FC}}{Re}, & \displaystyle\end{eqnarray}$$
where
 $\unicode[STIX]{x1D6FC}=O(1)$
, the stress conditions on the free surface (2.6) become
 $$\begin{eqnarray}\displaystyle & \displaystyle \frac{p}{m}\frac{\text{d}h}{\text{d}s}-\frac{\unicode[STIX]{x1D70F}_{ss}}{mRe}\frac{\text{d}h}{\text{d}s}+\frac{\unicode[STIX]{x1D70F}_{sn}}{Re}=-\frac{\unicode[STIX]{x1D6FC}}{mRe}\frac{\text{d}h}{\text{d}s}\left(\unicode[STIX]{x1D735}\boldsymbol{\cdot }\boldsymbol{n}\right),\quad -p+\frac{\unicode[STIX]{x1D70F}_{nn}}{Re}-\frac{\unicode[STIX]{x1D70F}_{sn}}{mRe}\frac{\text{d}h}{\text{d}s}=\frac{\unicode[STIX]{x1D6FC}}{Re}(\unicode[STIX]{x1D735}\boldsymbol{\cdot }\boldsymbol{n}) & \displaystyle \nonumber\\ \displaystyle & & \displaystyle\end{eqnarray}$$
on
 $n=h(s)$
, where
 $$\begin{eqnarray}\displaystyle & \displaystyle \unicode[STIX]{x1D735}\boldsymbol{\cdot }\boldsymbol{n}=\unicode[STIX]{x1D705}-\unicode[STIX]{x1D705}^{2}h-\frac{\text{d}^{2}h}{\text{d}s^{2}}+o(h), & \displaystyle\end{eqnarray}$$
for small
 $h$
.
The viscous correction to the free-surface location,
 $\tilde{h}_{0}(s)$
, for the symmetric jet problem for various values of the Weber number. This comparison is displayed for
 $Re=4\times 10^{3}$
and the analytical prediction is represented by the solid line. One can clearly see that for Weber numbers comparable to
 $Re$
and larger, surface tension has no qualitative effect on the leading-order viscous perturbation.

Hence, performing a large-
 $Re$
asymptotic expansion as in § 3, we see that the leading-order problem remains unchanged, with surface tension entering the second-order pressure, so that (3.12) becomes
 $$\begin{eqnarray}\displaystyle & \displaystyle \tilde{p}_{1}=-\frac{3\unicode[STIX]{x1D705}^{2}{\tilde{n}}^{2}}{2}-\unicode[STIX]{x1D6FC}\unicode[STIX]{x1D705}-\unicode[STIX]{x1D705}\tilde{h}_{0}+2\unicode[STIX]{x1D705}\left[\tilde{w}^{\ast }-\int _{{\tilde{n}}}^{\infty }\tilde{w}(s,\unicode[STIX]{x1D708})\,\text{d}\unicode[STIX]{x1D708}\right]. & \displaystyle\end{eqnarray}$$
The appropriate matching conditions for the second-order inviscid problem are therefore
 $$\begin{eqnarray}\displaystyle & \displaystyle \frac{\unicode[STIX]{x2202}\unicode[STIX]{x1D719}_{1}}{\unicode[STIX]{x2202}n}=\frac{\text{d}\tilde{h}_{0}}{\text{d}s}+2\unicode[STIX]{x1D705},\quad \frac{\unicode[STIX]{x2202}\unicode[STIX]{x1D719}_{1}}{\unicode[STIX]{x2202}s}=\unicode[STIX]{x1D705}(\tilde{h}_{0}+\unicode[STIX]{x1D6FC}-2\tilde{w}^{\ast })\quad \text{on }n=0. & \displaystyle\end{eqnarray}$$
Therefore, mapping
 $\tilde{h}_{0}\rightarrow \tilde{h}_{0}-\unicode[STIX]{x1D6FC}$
removes surface tension from the problem.
We confirm this by reconsidering the viscous free-surface perturbation in the symmetric jets problem for several values of the Weber number while keeping the Reynolds number fixed. As in figure 5, we consider an example for which
 $Re=4\times 10^{3}$
, but consider a range of Weber numbers from
 $2.5\times 10^{3}-4\times 10^{4}$
. For each case, we take the DNS data, subtract off a term equivalent to the inviscid prediction and a uniform normal shift according to the Weber number and plot the results, which are displayed in figure 12. The excellent collapse of the DNS data for each of these values of the Weber number indicates that the above analysis holds in this regime.
Clearly, we need significantly larger surface tension to alter the leading-order stress conditions, specifically
 $1/We=\unicode[STIX]{x1D6FC}/\sqrt{Re}$
, where
 $\unicode[STIX]{x1D6FC}=O(1)$
. In this limit, we anticipate a larger perturbation to the outer inviscid flow –
 $O(1/\sqrt{Re})$
as opposed to
 $O(1/Re)$
– but this is beyond the scope of the present paper.



