NOMENCLATURE
- a ∞
-
free-stream speed of sound [m/s]
- c
-
reference length [m]
- C m
-
pitching moment coefficient
- C n
-
normal force coefficient
- f
-
functional output
- M
-
local Mach number
- N
-
number of rotor blades
- Q
-
flow solution/state
- r/R
-
non-dimensional blade radius
- R
-
flow solution residual
- Re
-
Reynolds number, U ∞ c/ν∞
- U ∞
-
free-stream velocity [m/s]
- v
-
flow velocity vector [m/s]
- X
-
data point
- γ
-
ratio of specific heats, γ = 1.4
- λ
-
adjoint variable
- μ
-
mean of a statistic distribution
- μ T
-
eddy viscosity [m2/s]
- ν∞
-
free-stream kinematic viscosity [m2/s]
- |ξ|
-
vorticity magnitude, |∇ × (v/a ∞)|
- ϕ
-
phase [degrees]
- σ2
-
variance of a statistic distribution
- {}0
-
value on current mesh
- {}∞
-
infinitely refined mesh value
Greek Symbol
1.0 INTRODUCTION
Future design thrusts for vertical lift seek to leverage transformative technologies integrated into innovative rotorcraft platforms to achieve significant increases in hover lift, forward flight speed, and improved capabilities for low speed manoeuvring. These ambitious performance goals will be achieved by significant aerodynamic improvements outlined in U.S. Army(1,Reference Merritt2) and NASA(Reference Gorton3) Scientific and Technology (S&T) thrusts including, but not limited to, reduction of rotor download in hover, low drag hubs in high-speed flight, and lift augmentation during manoeuvres. The S&T goals crosscut the range of vehicle size and capabilities from heavy lift to small Unmanned Air Vehicles (UAVs), requiring numerical solvers that fit within the interlocking puzzle of physics that makes up the technology needs of these disparate vehicles. As many of these transformative technologies are multidisciplinary, the Verification and Validation (V&V) processes to meet regulatory requirements must be extensible across these disciplines.
Rotorcraft are not the only air vehicle platforms that use Virtual Engineering (VE), but their complex physics gives rise to unique systems of systems that require significant care in developing V&V processes, without requiring onerous costs that can impede or even eliminate the ability to use innovative solutions. The need for the development of validated VE processes to augment testing during certification has been frequently articulated by Dr. Bill Lewis, Chief of U.S. Army Aviation S&T. For example, he seeks a 90% reduction in the flight test requirement during external load certification(Reference Shechter4), where the optimal approach is a validated VE tool. A recent example for the need of these tools is the failure of the original equipment manufacturers and the U.S. Federal Aviation Administration (FAA) to come to a consensus for the certification of Inlet Barrier Filters (IBF) on helicopters, specifically the Sikorsky S-92(Reference Head5). The use of IBFs is critical for operational use in areas where engine-damaging particulates may be present. The FAA has now called for “IBF manufacturers to perform complex, specialised flight testing to determine any associated inlet distortion”(Reference Head5). The costs of the required flight testing will essentially eliminate the aftermarket for these IBFs. Given that the U.S. has invested millions of dollars and person-hours to develop complex, high-fidelity CSE solvers, it is important to ensure that they can be employed to offset at least a portion of the flight testing.
High-fidelity simulation solvers based directly on first-principles or governing equations of motion are Computational Science and Engineering (CSE) methods, a subset of VE. These solvers include Computational Fluid Dynamics (CFD), Computational Structural Dynamics (CSD) based on finite element analysis, and computational aeroelasticity (CFD/CSD) methodologies. The term Modelling and Simulation (M&S) refers to rapid, less accurate simulations such as reduced-order models and rapid design tools. CFD has often been applied during the design and analysis phase, but it is still considered to be an “art” as the large number and complexity of inputs drive the solution accuracy. In addition, a CFD-based tool can give dramatically varying results for the same problem when utilised by different engineers. The mesh, time step, turbulence model, algorithm selection, and other user-selected variables all have an impact on the solution. However, when applied appropriately, CSE tools can capture complex unsteady behaviours that drive vertical lift component design(Reference Hodara, Lind, Jones and Smith6,Reference Reich, Shenoy, Schmitz and Smith7) .
Significant inroads to understand complex rotorcraft engineering problems have been made when both numerical and experimental researchers, with careful quality control, have collaborated together. An example is the case of dynamic stall in reverse flow(Reference Hodara, Lind, Jones and Smith6). Indeed, these collaborations have resulted in situations where the numerical results drive the experimental design to capture situations of interest(Reference Datta, Yeo and Norman8-Reference Schmitz, Reich, Smith and Centolanza10) or to identify errors or inconsistencies in the physical experiments(Reference Schmitz, Reich, Smith and Centolanza10,Reference Shenoy and Smith11) . While these and many other numerical efforts provide significant improvement in the understanding of complex physics or CFD predictive capability, they do not typically provide an adequate set of quantitative metrics in which to judge the accuracy of the simulation. In addition, a CFD solver provides a single number at each discrete point in time for each parameter of interest, e.g. performance coefficients. After a simulation, an engineer has literally gigabytes of data with no quantitative assessment of its accuracy or sensitivity. The cost in performing these computations can vary from several hours to several weeks, precluding the ability to perform sensitivity studies to provide sufficient data to resolve these questions in an engineering project environment.
The term “numerical experiments” has been coined as early as the 1970’s(Reference Chapman12) to indicate a new paradigm of numerical simulations that provide the same confidence as carefully executed physical experiments. The key fundamental characteristics of the numerical experiment include: (a) validation and verification, (b) accuracy and error assessment, and (c) sensitivities. This is particularly important when it comes to the development of transformative numerical modelling concepts in the academic community; in many instances these innovative numerical modelling solutions languish at a low Technology Readiness Level (TRL) because of poor technology transfer and/or lack of proper uncertainty quantification of the solver.
Herein, a V&V approach of CSE tools for rotorcraft engineering is proposed, with a description of the salient errors that must be quantified if certification of these tools is to be achieved. Current fundamental research can be leveraged to minimise or eliminate some of these errors. Adjoint adaptation, developed primarily for design optimisation, can also address one of the less controllable uncertainties in CFD, mesh generation, and is illustrated here. The ability to assess the errors in individual CFD simulations is also a requirement for certification of CFD solvers. This paper demonstrates how an existing M&S error analysis could be extended and utilised for this purpose.
2.0 CFD CERTIFICATION FOR VERTICAL LIFT APPLICATIONS
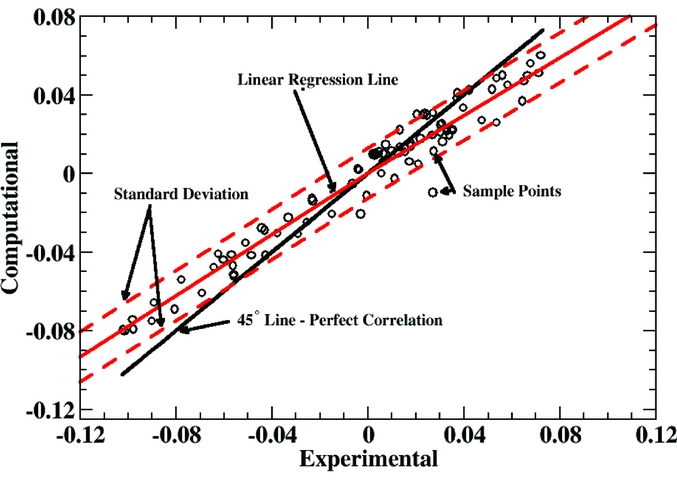
Current validation of CFD-based prediction tools on vertical lift problems of interest typically involve comparative plots of a single variable (e.g. pitching moment coefficient) over one rotor revolution against existing experimental or flight test data. Where available, the error bounds of the physical test data are included to show if the CFD predictions fall within the bounds. Bousman introduced linear regressions (cross-plot physical test and numerical predictive data) to provide a measure of quantitative assessment(Reference Bousman13), as illustrated in Fig. 1. Smith expanded this approach with visualisation and computation of additional statistical parameters(Reference van der Wall, Lim, Smith, Jung, Bailly, Baeder and Boyd14). To meet the goals of V&V for certification approval of CSE tools, these validation approaches need to be expanded into a systematic approach that is comparable – where possible – to M&S software certification.
Current practice of statistical analysis of CFD-based validation with experimental data. From Smith et al(Reference van der Wall, Lim, Smith, Jung, Bailly, Baeder and Boyd14).

In this instance, V&V for software certification requires a deep understanding of each component of the numerical process and each of the errors associated with these components. As the overall goal is to reduce certification testing, an analysis of the entire simulation approach without an understanding of the component errors can lead to incorrect conclusions when applied to new configurations, which defeats the purpose of the validation. Verification should ensure that the software algorithms are correct, within the bounds of numerical errors inherent in the algorithms. Validation should ensure that any errors that propagate through the software are bounded and can be quantified. Software developers will estimate many of these errors during development, but the errors are not routinely communicated to the general user. Thus, it is recommended that this information should be required for all CSE software employed by the vertical lift community.
A process for the assessment of computational errors in high-performance computing (e.g. CFD) has been proposed by Oberkampf and Trucano(Reference Oberkampf and Trucano15). In 2002, it was refined by Roy and Oberkampf(Reference Roy and Oberkampf16), and this approach has been adopted by many in the computational field, including wind energy, to guide the certification of CSE tools. Since 2011, research by the first author and her collaborators have successfully quantified computational uncertainties using these principles for CSE (e.g. Shenoy(Reference Shenoy17)), as well as M&S development(Reference Prosser18,Reference Prosser and Smith19) . This approach relies on uncertainty quantification, a branch of mathematical analysis that has been widely adopted for accurate validation, design, and certification of engineering systems. The use of uncertainty quantification in engineering is not new, but significant research, particularly since the beginning of the new millennium, has rapidly expanded its application, primarily in design. In the context of multidisciplinary applications, uncertainty quantification can first be utilised to identify the errors associated with any one component, and then integrated into a system of systems approach to assess entire multidisciplinary concepts.
The uncertainty process proposed here(Reference Oberkampf and Trucano15,Reference Roy and Oberkampf16,Reference Oberkampf, DeLand, Rutherford, Diegert and Alvin20) follows the steps: identification and characterisation of pertinent sources of uncertainty; elimination or estimation of code and solution verification errors; uncertainty identification in the system response due to input uncertainty propagation through the model; quantification of mathematical model uncertainty; and estimation of model uncertainty when extrapolating to new applications and conditions. An application of this process applied to a complex system of systems approach for M&S is described in Prosser and Smith(Reference Prosser and Smith21) and Lorieau and Smith(Reference Lorieau and Smith22).
The sources of uncertainty can be differentiated into three types(Reference Oberkampf, DeLand, Rutherford, Diegert and Alvin20): the model inputs; the numerical approximations; and the model form uncertainties. All model inputs must be taken into account in the analysis in order to develop a rigorous framework. The deterministic inputs may be excluded from the uncertainty analysis with care after determining there is no uncertainty associated with their implementation. In this model, examples of deterministic input parameters are the gas constant R and the ratio of specific heats γ, as their usage for most vertical lift applications falls within calorically perfect gas assumptions. The model input sources come from either the parameters used in the model (geometry, constitutive model parameters, initial conditions) or data from the surroundings (boundary conditions, external forces or moments, etc.).
The numerical approximations, also called code and solution verification errors by Oberkampf et al(Reference Oberkampf and Trucano15,Reference Oberkampf, DeLand, Rutherford, Diegert and Alvin20) , are divided into four categories: discretisation errors, convergence errors, round-off errors, and programming mistakes. The model form uncertainties come from the engineering assumptions of the model and the choices that have been made in order to achieve an efficient and implementable model: environmental assumptions, conceptualisations (model choice), approximations, and mathematical representations of the physical phenomena. The errors themselves are categorised as “aleatory” and “epistemic” errors. Aleatory errors are those which are typically quantifiable through repetitive analysis, and they are usually quantified by statistical methods such as standard deviation. Epistemic errors are more difficult to ascertain, as they are not readily assessed and are beyond the control of the user. It is first necessary to identify the sensitivity of the simulation to an epistemic parameter (e.g. atmospheric turbulence) to determine if it is an important quantity.
Once a realistic simulation approach has been designed, then each error source in the three categories is assessed. For example, a CFD analysis will include, at minimum: input errors, numerical algorithm errors (truncation, discretisation, round-off, etc.), mesh (grid) errors, and user-defined sensitivities (time step, turbulence model, flux limiters, etc.). Each component assessment will result in a series of parameters that should be evaluated for their impact on the simulation for the appropriate conditions. For example, for a helicopter fuselage drag analysis, numerical parameter variation with a low subsonic Mach regime (0–0.4) should be assessed, but supersonic Mach numbers are not practically relevant for this problem, and therefore, they should not be part of the analysis.
While the numerical aspects of the solver are conventionally assessed during the software development stage, areas of parametric assessment that will be new to most CSE users is that of the input error and model form uncertainty assessment. Some of these inputs are categorised differently from the process of selecting options in the solver; instead, they pertain to the actual errors that may be encountered in the geometry and actual operations. Aleatory errors, such as geometric variations on a rotor blade during manufacturing can be assessed through a series of physical tests, theory, and computations to create a mean and standard deviation of the likely geometric variation. For epistemic errors, for example, the impact of the atmospheric turbulence on rotor blade performance is much more difficult to assess as the engineer has no reliable quantification of the variations. Epistemic error analysis may require additional research to resolve. Thus, an understanding of the issues associated with certification of a CSE tool for a particular application must be examined early in software or project development to ensure that there is time to provide an adequate assessment.
Care must be taken when validating with or using experimental data as inputs, as errors may also be present in those data. Conventional wisdom suggests that physical experiments are more physically accurate than computational experiments. However, this is not always the case, given the improvement of turbulence modelling and availability of large computers. New collaborations (e.g. NATO AVT 282(23)) are relying on high-fidelity computations to understand the limiting cases where experiments cannot readily obtain information. In another recent example, numerical evaluations on a set of experiments (unpublished) revealed problems with the model and mount, which rendered the experimental data unusable, and requiring improved models and a redesigned mount before a new experimental campaign was undertaken. These high-fidelity numerical simulations have themselves provided insight into uncertainty analysis and sensitivity, when correlated with other experiments with limited data. A detailed analysis of the model itself provided aerodynamic sensitivity to model imperfections.
It is also necessary to consider the operating conditions, such as the atmospheric turbulence, as previously noted. To illustrate their importance, during a recent sensitivity analysis and correlation with flight test data of dynamic slung loads(Reference Prosser and Smith21), the impact of atmospheric turbulence indicated that this parameter should not be ignored when determining the onset of instabilities of some loads. Thus, a CSE or M&S-based simulation that can easily implement varying levels of atmospheric turbulence and helicopter unsteady motion would be preferred over a statically-mounted wind-tunnel evaluation. In this case, because the analysis showed that the flight speed at which the onset of instability occurred was not conservative, this is especially important.
3.0 MINIMISING USER ERROR AND CHARACTERISING INDIVIDUAL SIMULATION UNCERTAINTIES: ADJOINT ANALYSIS
Refereed literature often present software “best practices,” but there is no quality control in the community to ensure that users apply these findings in their simulations. Thus, the application of the same software can often have widely varying results. This is often cited as a major drawback to CSE approaches where the user is still in control of inputs that drive the quality of the simulation, i.e. the amount of discretisation error in the simulation. As early as the 1970s(Reference Chapman12), researchers recognised that the quality control of individual simulations needed to be considered if CFD was truly to attain the level of “numerical experiments.”
In addition to the selection of the turbulence closure, the mesh resolution and structure drives the solution accuracy. Inadequate mesh fidelity in rapidly changing and/or highly turbulent regions of the flow will adversely influence the accuracy of the simulation; however, it is not always clear which flow features are important and where they will occur a priori to the simulation. For unsteady simulations, these flow features can travel and appear/disappear during the course of the simulation. In addition, for engineering and design purposes, the use of a single baseline mesh for a broad range of flight conditions is sought to minimise the setup time for the simulations.
While applying published “best practices” or “rules of thumb” can aid in designing meshes that result in improved solution accuracy, the amount of discretisation error (as discussed in the prior section) may be reduced, but it is not minimised nor quantified as one would like for certification quality V&V of the software practice. Because CFD meshes consisting of millions of degrees of freedom are solved for tens of thousands of time steps, determining the error or uncertainty on a output of that process due to discretisation is not a trivial task.
Feature-based mesh adaptation has helped to improve simulation accuracy without requiring unwieldy mesh sizes, but the selection of the adaptation feature that drives the CFD can result in new errors(Reference Shenoy, Smith and Park24). With respect to design, applying unadapted or feature-adapted CFD solutions to inform design decisions could lead to less than optimal conclusions.
Although it requires significant development effort to implement, adjoint analysis offers a computationally efficient way of estimating the uncertainty of large calculations such as CFD(Reference Park25). For each node (degree of freedom) in the CFD mesh, the adjoint analysis produces a local error contribution of node to the global output from which a global uncertainty can be formed, and then adaptation can be performed to reduce the mathematical uncertainty. Thus, adjoints can serve a multi-role function to quantify errors as well as be utilised to perform Adaptive Mesh Refinement (AMR) on the baseline mesh for new flight conditions without needing to manually modify/recreate the baseline mesh.
3.1 An introduction to adjoints
To understand how the solution to the adjoint problem can estimate the uncertainty of the solution, consider a Taylor series of output functional, f, about the calculated flow solution, Q 0, to determine the flow solution at an infinitely refined mesh, Q ∞:
 $$\begin{equation}
f \left( Q_\infty \right) = f \left( Q_0 \right) +\left[ \left. \frac{\partial f}{\partial R} \right|_0 \right]^T \left( R \left(Q_\infty \right) - R \left(Q_0 \right) \right)+ \cdots ,
\end{equation}$$
where R is the set of flow equation residuals. Assuming that the infinitely refined solution exactly satisfies the governing equations, the residual, R(Q ∞), is zero. The previous equation can be simplified to:
 $$\begin{equation}
f \left( Q_\infty \right) = f \left( Q_0 \right) + \left[ \left. -\frac{\partial f}{\partial R}\right|_0 \right]^T R \left(Q_0 \right) + \cdots
\end{equation}$$
The vector in square brackets is known as the adjoint solution, λ. In this equation, the second term on the right hand side, formed from the flow residuals and adjoint solution, represents an estimation of the error in the functional output. The adjoint vector can be found by solving the adjoint equations which are formed by the application of the chain rule to
 $\frac{\partial f}{\partial Q}$
:
 $$\begin{equation}
\frac{\partial f}{\partial Q} = \left[\frac{\partial f}{\partial R}\right]^T \frac{\partial R}{\partial Q} .
\end{equation}$$
Substituting in the adjoint vector and taking the transpose leads to the typical form of the adjoint equations:
 $$\begin{equation}
\left[\frac{\partial R}{\partial Q}\right]^{T} \lambda = -\left[\frac{\partial f}{\partial Q}\right]^{T}.
\end{equation}$$
The transpose Jacobian on the left hand side and right hand side vector in the adjoint equations are not trivial to form. They are typically either hand coded or generated through the process of automatic differentiation(Reference Müller and Cusdin26,Reference Lyu, Kenway, Paige and Martins27) . Since the adjoint solution is essentially the sensitivity of the output functional to the flow residual equations, discretisation errors in regions with a large magnitude of the adjoint variable will contribute more to the output functional error than the same amount of discretisation error would in regions where the adjoint value is closer to zero. This property makes the adjoint a good basis for forming mesh adaptation metrics because it essentially reveals where it is important to resolve the flow.
Improvements to the estimated error term can be made from interpolation of the flow and adjoint solution to a refined mesh. From estimated error on the original mesh and the interpolated mesh, an adaptation procedure can be developed to adapt the solution according to the desired functional output. A full discussion of the adjoint-based adaptation process proposed and demonstrated here is available in Ref. Reference Park25.
One disadvantage of the adjoint method is that the adjoint equations are dependent on the output functional which implies that one adjoint solution and set of adaptation cycles is required for each functional of interest; however, adjoint-based adaptation has been shown to produce more accurate results than feature-based methods(Reference Venditti and Darmofal28). The reason is that the feature-based method may be able to improve the resolution of a flow feature, but if the flow feature is in the wrong location, its refinement will not improve the overall error. The adjoint-based adaptation will sufficiently refine the critical flow features, and it will also refine the regions that affect the flow features’ properties. This has been demonstrated by Venditti and Darmofal(Reference Venditti and Darmofal28) who studied a RAE 2822 aerofoil in transonic flow with output-based adaptation and feature-based adaptation utilising Mach number for the adaptation indicator. The forces on the transonic aerofoil are strongly dependent on the location of shock on the aerofoil. The shock is in turn dependent on the flow upstream of the shock where Mach number gradients are not as large. The feature-based refinement did not sufficiently refine the region upstream of the shock resulting in inaccurate shock characteristics. Because the adjoint process identifies which regions the functional output error is most sensitive to, the mesh was subsequently adapted upstream of the shock to provide a more accurate shock location in addition to sufficiently refining the shock itself. The adjoint-based adaptation converged to more accurate load predictions while requiring few nodes.
In addition to producing more effective refinement, adjoint-based adaptation is typically more efficient. For example, the adjoint-based adaptation on a supersonic double aerofoil configuration in Ref. Reference Venditti and Darmofal29 required 89.7% fewer nodes than a pressure-based adaptation to achieve convergence of drag on the rear aerofoil. The pressure-based adaptation resolved all of the shocks at the leading edge and trailing edge of both aerofoils resulting in the larger number of nodes; however, the adjoint-based method sufficiently resolved the regions that affected drag on the rear aerofoil which did not include all of the shocks or the full extent of any shock.
The adjoint method is applicable to any choice of discretisation of the flow equations (finite volume(Reference Park25), finite element(Reference Fidkowski and Luo30), etc.). It has been applied for both spatial and temporal adaptation(Reference Fidkowski and Darmofal31). Due the strong dependence on any perturbation in any turbulent (chaotic) flow, the standard adjoint solutions will grow unbounded and become useless for adaptation. Using the adjoint in chaotic systems is an active area of research with methods such as least squares shadowing(Reference Wang, Hu and Blonigan32) proposed as a possible approach. The least squares shadowing method is effective, but until the computational cost of the method is reduced, it is too expensive to apply to real engineering problems with current computer resources.
3.2 Demonstration of adjoints
To demonstrate the benefits of an adjoint analysis, a wind turbine blade is examined. This case is also analogous to a rotor in hover. The National Renewable Energy Laboratory (NREL) Phase VI Unsteady Aerodynamics Experiment(Reference Hand, Simms, Fingersh, Jager, Cotrell, Schreck and Larwood33) was a series of tests to study the unsteady loads and responses of a horizontal axis wind turbine. The tests were designed to build a dataset for studying the complex aerodynamic interactions of wind turbines for the purpose of improving computational models. The blades were outfitted with numerous pressure taps and strain gages for measuring the unsteady loads. The tests were run in upwind and downwind configurations with sweeps of free-stream speed, pitch angle, and yaw angle.
A blind study(Reference Simms, Schreck, Hand and Fingersh34) compared different wind turbine computational prediction tools to one another and experimental data for a range for M&S and CSE tools ranging from blade element methods to CFD. Across the spectrum of tools, there was very little agreement between the prediction methods, as well as between the predictions and the experiment. For example, the study showed that even for the simple case examined here at a no-yaw and no-stall condition, predicted power for the turbine ranged from 25% to 175% of the measured values. The large range in predicted performance and loads in the study, even amongst the CFD models, illustrates the need for more accurate predictive capabilities.
With adjoint-based adaptation applied in this example, the adjoint solution gives the local contribution of each mesh point to the global output function. This allowed the mesh to be refined and coarsened in different regions of the mesh, providing an efficient and accurate solution without the need to over refine the mesh in areas where it is not needed. The adjoint adaptation procedure also produces an estimated uncertainty, something the codes in the blind NREL study did not have. The user can use these outputs to drive the error to a certain tolerance.
Of the many tests performed from the Phase VI Unsteady Aerodynamics Experiment, the Sequence S 10m/s case was selected for this illustration of adjoint adaptation. The Sequence S case is an upwind, rigid rotor with zero yaw, a three degree blade pitch and no coning angle. The simulation was performed in FUN3D(35), an unstructured, adjoint-enabled CFD code. The blade was modelled with a steady-state flow in a non-inertial reference frame, typical of many hover analyses. The compressible path in FUN3D was selected with the Spalart-Allmaras turbulence model(Reference Spalart and Allmaras36).
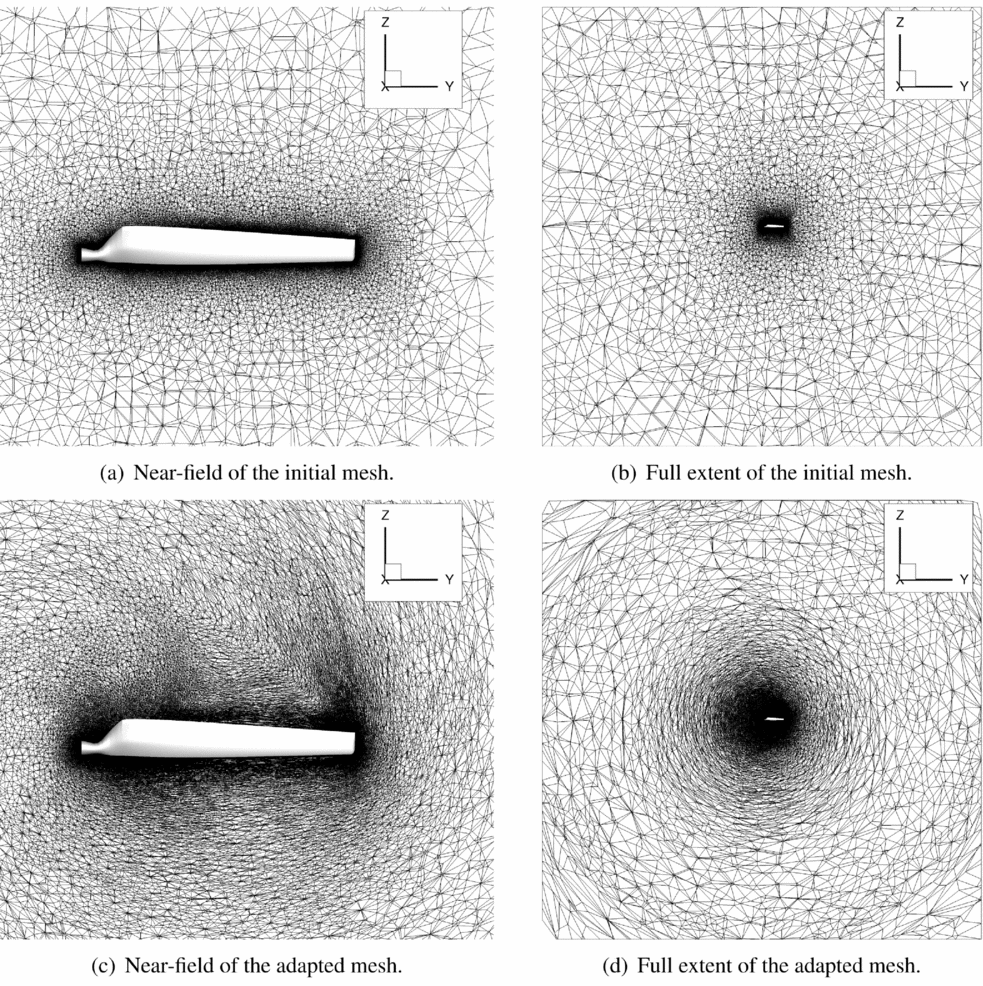
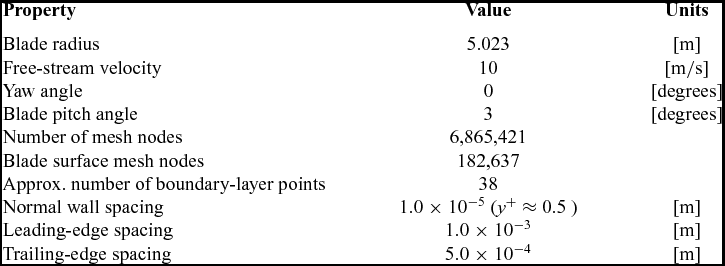
The salient details of the Sequence S operating conditions(Reference Hand, Simms, Fingersh, Jager, Cotrell, Schreck and Larwood33) and initial mesh is provided in Table 1. During the adaptation process, the mesh in the surface mesh boundary-layer region was frozen since the refinement method utilised does not perform well in the high aspect ratio cells in the boundary layer. Away from the surface, the mesh was rapidly coarsened with no effort put forth to refine any flow features as seen in Fig. 2(a) and (b). The lack of refinement of the volume mesh was specifically chosen to demonstrate the ability of the adjoint mesh adaptation to improve mesh quality for an inexperienced user.
Slices of the initial and adjoint-adapted NREL-VI meshes in the plane of the rotor. The flow direction and axis of rotation is the x-axis.

Adjoint-based adaptation test case and initial mesh properties

The adjoint-based adaptation was performed using the coefficient of torque about the rotor axis as the output of interest. The adaptation process starts with a converged static flow solution, after which the adjoint solver is run until the adjoint solution converges. At this point, the adjoint solver is restarted with adaptation flags that create the new grid that is refined in regions where the estimated local contribution to the functional error is higher and coarsening where it is low. Then the process cycles back to the flow solver. For FUN3D, the adjoint adaptation is implemented currently only for steady flows, but development of time-accurate adjoint adaptation capabilities are underway. (The adjoint solution for unsteady flow is implemented; the overset mesh adaptation using unsteady adjoints is not.)
To demonstrate this approach, seven adaptation cycles were performed to improve the torque coefficient, which reached a value of 0.00235 with an estimated uncertainty of 2.91 × 10⁻⁴, whereas the original mesh predicted a torque coefficient of 0.00216. The corresponding experimental torque coefficient of the blade is 0.00241, which is within the estimated uncertainty of the computation. Although more adaptation cycles would lead to lower uncertainty in the value, this study is only a demonstration of the potential on this method.
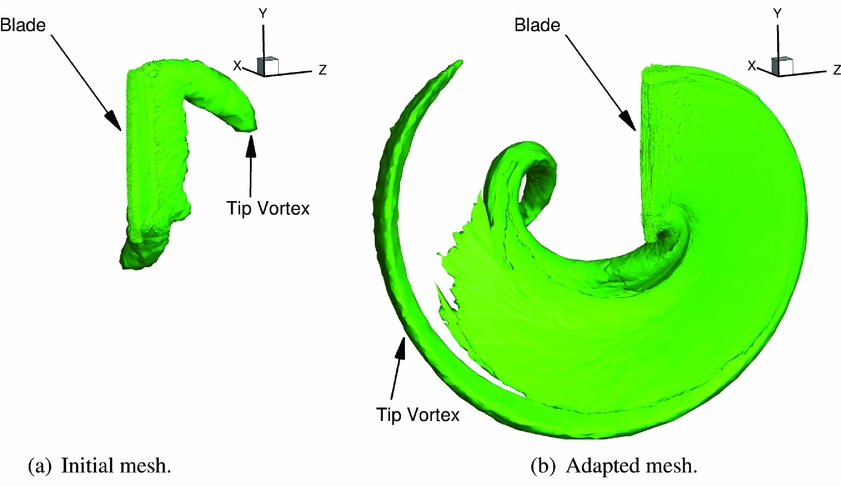
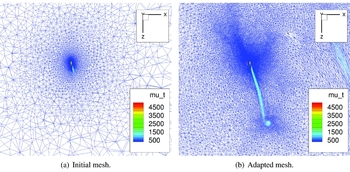
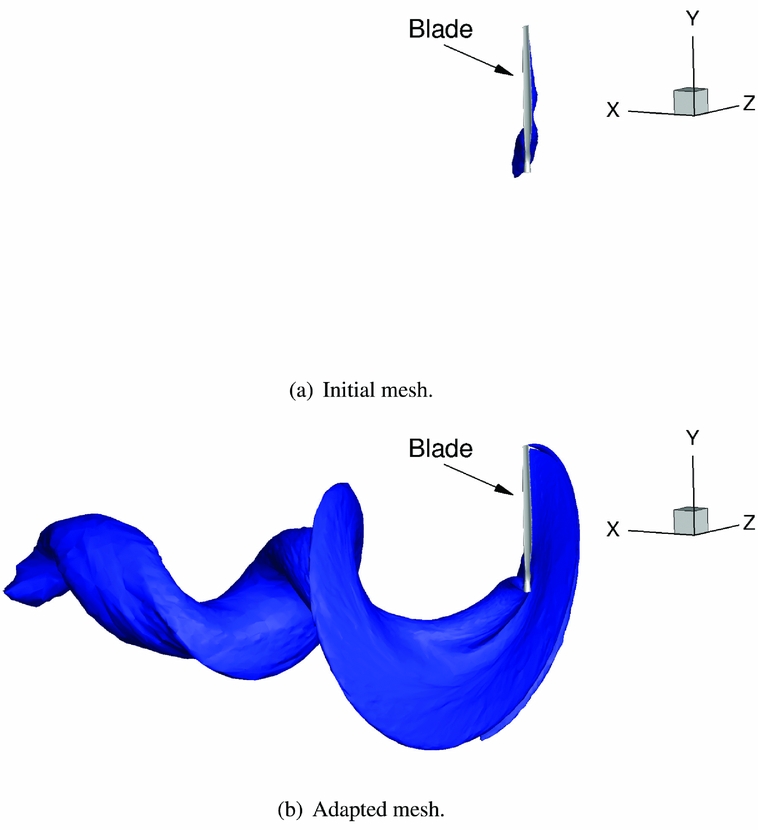
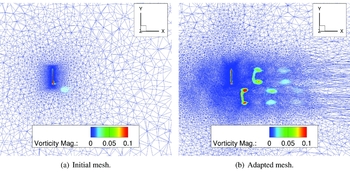
The seventh adapted mesh contains 9.5 million grid nodes with the mesh notably refined in some regions to certain flow features. In addition to improving the predicted values for this particular case, this adapted mesh permits engineering insight into the important flow phenomena. The region near the rotor disc shows higher mesh resolution in Fig. 2(d) when compared to the initial mesh in Fig. 2(b). Some of the farfield regions such as the corners of Fig. 2(d) have been coarsened because they do not significantly contribute to the desired output function. Two of the flow features that the adjoint adapted mesh refines significantly are the stagnation streamlines and the wake of the blade. In Fig. 2(c), this is evident where there are more nodes along the path that the tip vortex follows. In Fig. 3, iso-surfaces of the vorticity magnitude illustrate that the tip vortex in the initial mesh rapidly decays due to numerical viscosity and poor resolution while the adapted case preserves the tip vortex about six times as far downwind. In Fig. 4 where the mesh is sliced at the midspan, there is significant refinement of the stagnation streamline and wake compared to the initial mesh. The region of higher eddy viscosity in the wake of the blade is preserved multiple chord lengths, whereas in the initial mesh, the higher eddy viscosity region of the wake quickly dissipates. The iso-surfaces of eddy viscosity in Fig. 5 and the mesh slices of vorticity magnitude in Fig. 6 further demonstrates the preservation of the wake in the adapted case.
Iso-surfaces of the vorticity magnitude with a value of 0.05 for the NREL blade. The free-stream flow is in the x direction.

Initial and adapted mesh coloured by eddy viscosity, μ T , at a slice through the midspan.

Iso-surfaces of eddy viscosity with a value of μ T = 500 for the NREL blade. The free-stream flow is in the x direction.

Illustration of wake refinement from initial to adapted mesh. Meshes coloured by vorticity magnitude at a slice through the span of the blade.

If careful considerations are not taken, the adaptation process can introduce poor quality elements in the mesh due to anisotropy that have the potential to negatively impact the robustness of the solver. This is particularly relevant in regions where there is anisotropy in the flow such as boundary layers and shocks. Ideally, the anisotropy of the mesh would align with that of the flow to reduce the number of required elements while maintaining the robustness of the flow solver and adaptation process. Loseille(Reference Loseille37) presented an adaptation process that could potentially address this issue. Given a metric tensor field, Loseille’s method can create a mesh that is locally structured and aligned with the eigenvectors of the metric tensor using a combination of a cavity-based operator(Reference Loseille and Menier38) which is a generalisation of the typical adaptation operations (insertion, deletion, and face swapping) and an advancing front method(Reference Lohner and Onate39) similar to those typically used to make boundary layers in unstructured meshes. Solvers will need to address these mesh anisotropies so that the adjoint approach can attain the TRL and robustness needed for certification of the process.
3.3 Other methods of error estimation
Besides adjoint-based methods, there are other methods to estimate discretisation error in a CFD solution. One such method is the classic Richardson extrapolation (see Ref. Reference Vassberg40 for an example aerospace application). Although easier to implement than the adjoint, Richardson extrapolation is agnostic to the underlying equations being solved, which means that a Richardson extrapolation cannot inform the model where refinement is critical as the adjoint can. In a Richardson extrapolation, the mesh is uniformly refined with no guarantee that the critical features are sufficiently resolved at the finest level. The results (e.g. integrated quantities like torque coefficient) from the different levels of refinement are then extrapolated to a theoretical infinitely refined mesh; however, if a critical flow feature is under-resolved, this extrapolation can lead to inaccurate extrapolations, or utilising uniform refinement to sufficiently resolve those small features will refine areas that do not significantly affect the result leading to an unnecessarily large computational cost. Other methods such as defect correction(Reference Pierce and Giles41) or error transport equations(Reference Phillips and Roy42) are similar to the adjoint method in that they require solving additional equations to estimate the discretisation error. These methods have the advantage of utilising only one additional solution to the defect or error transport equations for any number of output functional, unlike the adjoint method which requires one additional adjoint solution per functional. The outputs of the these methods show where discretisation error exists in the domain as opposed to the adjoint solution which shows where it is important to resolve the flow. Therefore, the adjoint is superior for adaptation purposes. Utilising the solution of the error transport equation as a basis for adaptation will lead to the same issues discussed above for feature-based adaptation. However, as discussed in Ref. Reference Derlaga and Park43, use of the adjoint or error transport equation solution does not preclude the other. A solver with both implemented could potentially use the error transport equations to understand and visualise where discretisation exists in the solution while utilising the adjoint approach to reduce the error.
4.0 A NEW VALIDATION APPROACH FOR COMPLEX CSE SYSTEMS
A major roadblock noted as early as 1979 by Chapman in his Dryden lecture(Reference Chapman12) is the inability to assess the accuracy not of the numerical simulations or predictions (as discussed earlier), but how to assess its accuracy with physical data and to estimate its accuracy when physical data are not present. This remains problematic today, but new tools have been developed for M&S solvers that can be applied to CSE solvers as well.
An assumption is made here that the quantities of interest are variables on the surface of the vehicle, in particular those relating to performance. This can include aerodynamic and structural coefficients, as well as discrete events such as transition or separation. For a vertical lift system, it is also assumed that there will be an unsteady or periodic vehicle response, so that the data, and required analysis, are more complex. As discussed earlier, the need for this has been observed, but the current analyses are not sufficient for certification.
Rather than using scalar-based statistics to assess the accuracy of the CSE simulation, it is proposed that a higher-fidelity approach be undertaken. The CSE simulations of interest here are based in the time domain, but significant data can be obtained by assessment of the frequency domain. Specifically, the frequency content and range of the data should be assessed, in addition to the errors associated with the prediction of the magnitude. By evaluating the frequency at which the errors occur, aided by the visualisation of the simulation in time domain, the simulation’s ability to capture the rotorcraft’s behaviour can be quantitatively assessed. While there are some validation efforts where the frequency domain has been assessed, for example in the recent U.S. hub workshop, where the higher harmonics of the hub drag were assessed(Reference Schmitz, Reich, Smith and Centolanza10), this is not the norm in CFD-based analysis across all parameters of interest.
This alternate approach to quantify and assess the accuracy of complex CFD data can be accomplished by writing tools to transform the data into the complex domain and performing various analyses. Assumptions made by different individuals in implementing algorithms for numerical analysis, such as Fast Fourier Transforms (FFTs), may lead to differences that could bias conclusions. To remove this potential uncertainty, a standardised and supported numerical analysis package that can be used across the industry is proposed. This approach is demonstrated using one such framework developed for M&S development, CIFER® (Reference Tischler44). CIFER® is generally used for system identification purposes in flight dynamics. It permits engineers to evaluate time-history data in the frequency domain. The data are converted to frequency domain by performing FFTs. Outputs are provided in the form of frequency plots and a scalar cost function. The accuracy of the data can be assessed by the magnitude and phase of its signal, which in many instances can be easier than evaluating a complex time history over a rotor revolution. In addition, the frequency analysis – when related to known frequencies per revolution – can provide insight into what physics the simulation is lacking.
4.1 An introduction to CIFER®
For system identification and flight-dynamics modelling, CIFER® has been extensively used to approximate mathematical models of flight test data. This process is performed by approximating a transfer-function that closely resembles the frequency response of the flight test data subjected to pilot inputs. The acquisition of an identified system can be performed by employing a numerical optimisation algorithm used to minimise the magnitude and phase errors between the frequency response of experimental data, T, and the composite frequency response estimate matrix
 $\hat{T}$
determined from a variation of the proposed design space. Once a mathematical model has been estimated, the accuracy of the estimated model can be evaluated. The evaluation can be performed by taking the difference between the magnitude and phase of the two frequency responses over a specified frequency range. Tischler(Reference Tischler44) describes that a cost function of J ⩽ 100 is considered an acceptable level of accuracy, while a cost function of J ⩽ 50 defines a model that is virtually indistinguishable from the original flight data in both the frequency and time domains.
Here, the new application of CIFER® is not to design and assess transfer functions, but to validate CSE simulation data. Hence, this analysis focuses on evaluating the differences between the frequency response of experimental (flight or wind-tunnel test) and computational data (simulation prediction). As a result, a cost function can be used to quantify the difference between the experimental and computational data, providing a scalar estimate, along with frequency data analysis to assess the accuracy of the simulations. The quadratic cost function(Reference Tischler44) used to analyse the error between test and simulated data can be formulated as
 $$\begin{equation}
J=\frac{20}{n_{\omega }}\sum _{\omega _{1}}^{\omega _{n_{\omega }}}W_\gamma \left[W_g\left(|\hat{T}_c|-|T|\right)^2+W_p\left(\angle {\hat{T}_c}-\angle T\right)^2\right],
\end{equation}$$
where n ω is the number of frequencies (equal spacing over a log-frequency scale in rad/sec, usually 20 points); ω1 and ω n ω are the starting and ending frequencies of the range considered, as determined from the FFT analysis of the time histories. W g and W p are weighting functions applied to the magnitude and phase squared errors, respectively, and they are equal to 1.0 and 0.01745, respectively, in this analysis. These values are chosen to be in accordance with the USAF MIL-STD-1797B, which equates a 1-dB magnitude error to 7.57° phase error, as recommended by Tischler(Reference Tischler44). A third weighting function, W γ, is determined by the reliableness of the data at each frequency, ω, as determined by the coherence of the data. This weighting function is computed as:
 $$\begin{equation}
W_\gamma (\omega ) = \left[ 1.58(1-e^{-\gamma _{xy}^2})\right]^2.
\end{equation}$$
Using this expression, when the coherence of the data drops to γ2 xy = 0.6, the weighting of the data in the cost function drops to 50%.
Since the goal of this work is not to numerically estimate transfer functions, but to validate CSE simulation data, it is expected that the cost function, J, will have values much larger than those found in its original application. If the process proves to be acceptable and adopted within the CFD community, new values for each metric should be chosen to identify the acceptable performance of the simulation. These cost functions should be viewed as a new quantitative metric of accuracy in addition to the traditional evaluation methods such as plotting with respect to time or rotor azimuth location. Appropriate frequency ranges, ω1 and ω
n
ω
, should be selected to ensure that the methodology focuses on the physical responses in these regions of interest and is not biased in unimportant frequency domains. For example, rotor performance may not be significantly impacted by frequency content about 12/rev – 16/rev, so analysis at these high frequencies would become irrelevant. The individual error assessments of magnitude (
 $|T|-|\hat{T_c}|$
) and phase (
 $\angle {T}-\angle {\hat{T_c}}$
) could also offer insights into the accuracy of the model, by linking these errors to specific physics, such as dynamic stall, transonic dip, and other important features. Certainly, it can be applied to assess the sensitivity of the solver to mesh and time step selections, and to determine if the CFD-based simulation has captured frequency content known to drive the metric of interest (for example, is there sufficient resolution in the CFD simulation to capture the important 4/rev content for the blade root bending moment).
4.2 Quantitative Analysis of CFD/CSD predictions
The efficacy of this proposed quantitative approach is examined by comparing the 7A rotor wind-tunnel test(Reference Crozier45) data with CFD simulations. While a full validation should include all radial station data, as well as all parameters of interest, only a few selected examples are included here.
Consider the 7A rotor analysis for both high-speed and high-thrust cases that bracket modern rotor aeroelastic designs. In this international effort, two organisations, the U.S. Army and ONERA, have each applied their best current practices to analyse model-scale wind-tunnel data in an attempt to advance the state of the art in aeroelastic rotor predictions(Reference Ortun, Potsdam, Yeo and van Truong46). The U.S. Army applied the Helios framework(Reference Wissink, Sitaraman, Jayaraman, Roget, Lakshminarayan, Potsdam, Jain, Leffell, Forsythe and Bauer47) with OVERFLOW as the near-body solver and SAMCart as the off-body Cartesian solver, coupled with the Rotorcraft Comprehensive Analysis System (RCAS) comprehensive code(Reference Saberi, Hasbun, Hong, Yeo and Ormiston48), while ONERA applied elsA(Reference Cambier, Heib and Plot49) as the CFD solver and Helicopter Overall Simulation Tool (HOST)(Reference Benoit, Dequin, Kampa, Grnhagen, Basset and Gimonet50) as the structural dynamics solver.
As part of the validation process, the participants found that the influence of the wind-tunnel test stand was important, and that there was a sensitivity when integrating at the test pressure tap locations rather than all CFD mesh points(Reference Ortun, Potsdam, Yeo and van Truong46). CIFER® is applied to assess the error between the input (wind-tunnel validation data) and the output (loosely coupled CFD/CSD data). Loose coupling involves updating the aeroelastic prediction at each 1/N revolution for level trimmed flight(Reference Potsdam, Yeo and Johnson51). The error between the two data sets are presented as a Bode plot, along with a coherence plot measuring the overall error in the frequency response. The simulations are more accurate as the magnitude and phase differences approach zero decibels and zero degrees, respectively. The level of coherence provides a measure of linearity in the data, where a perfectly linear frequency response is given by unity. The simulation is considered sufficiently linear (50% weighting in the cost function analysis) at a given frequency if the coherence is higher than or equal to 0.6(Reference Tischler44).
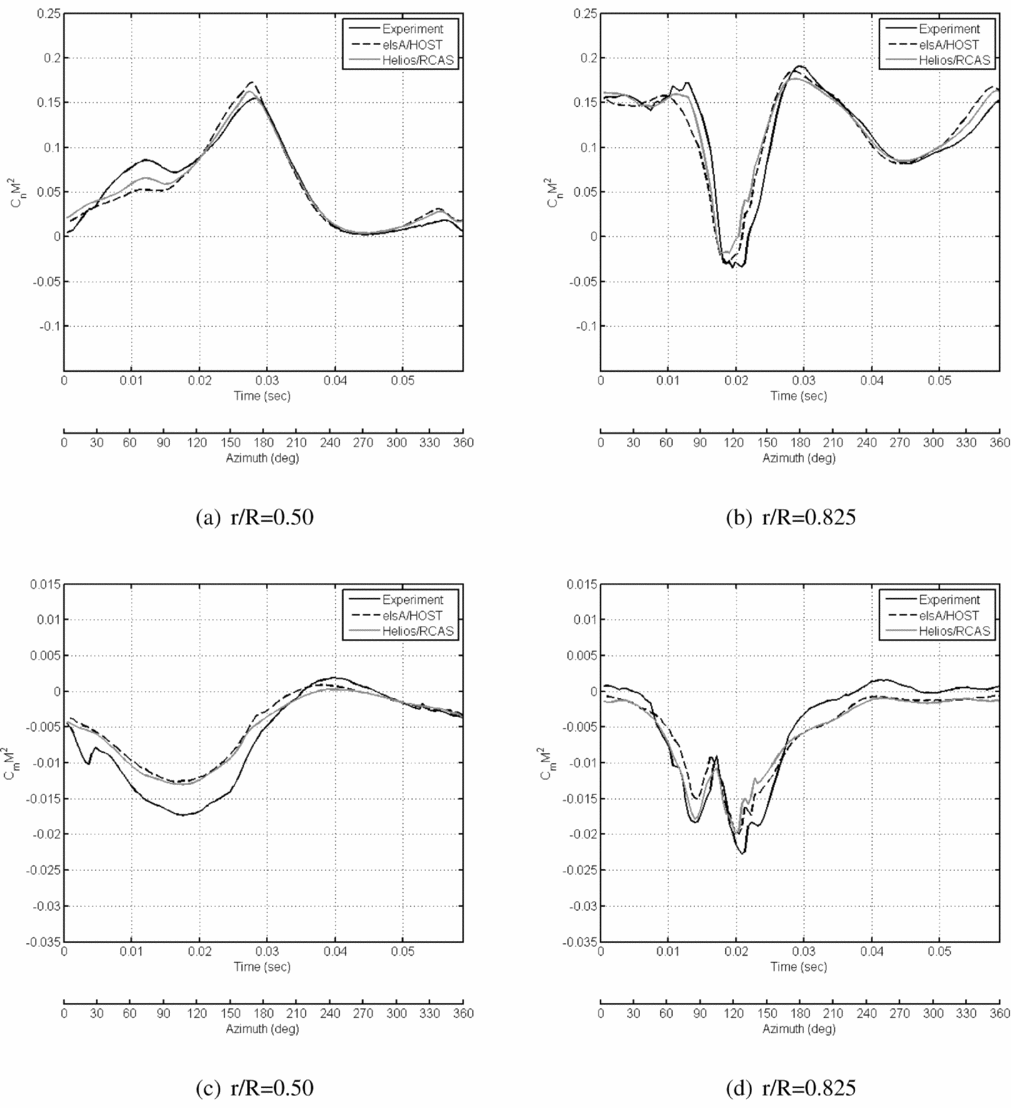
The first point to be considered is the high-speed test point (TP 312) at an advance ratio of 0.401 and free stream Mach number of 0.259. The traditional normal force and pitching moment data are presented in Fig. 7, as originally presented by Ortun et al(Reference Ortun, Potsdam, Yeo and van Truong46). The predictions for this rotor test point are comparable to or better than predictions in the extant literature on aeroelastic rotor predictions using CFD/CSD, capturing the phase and features of the wind-tunnel data very well.
Time history of the 7A rotor normal force (top row, (a)–(b) ) and pitching moment (bottom row, (c)–(d) ) coefficients for the high-speed test point (312).

There are several new constraints when using the proposed quantitative analysis methods, such as CIFER®, to validate the CFD data with wind-tunnel experiment or flight test data. CFD/CSD solutions typically are assessed over one revolution, either the final revolution or an average of a low number (e.g. 2–3) of revolutions. Conversely, physical (experiment, flight test) data are usually averaged over many cycles (for the 7A rotor, over 30 cycles(Reference Ortun, Potsdam, Yeo and van Truong46)). In both cases, the resulting time history data are single-valued quantities at each point in the rotor revolution. Consequently, the frequency of the data over the cycle is also important. If the numerical and physical data are not saved at the same azimuthal locations and/or frequency, then the data must be interpolated to the same time intervals before the analysis can occur. This interpolation can result in some bias of the data at higher frequencies. Thus, correct preplanning must occur before numerical simulations are made to ensure that the data are saved at coincidental times and at sufficient numbers to ensure that higher-frequency content is captured. For example, for this 7A rotor, the elsA/HOST simulation data were saved at twice the frequency of the OVERFLOW/RCAS, which were saved at approximately the same rate as the wind-tunnel data. All of the CFD/CSD data were interpolated to coincide with the wind-tunnel data.
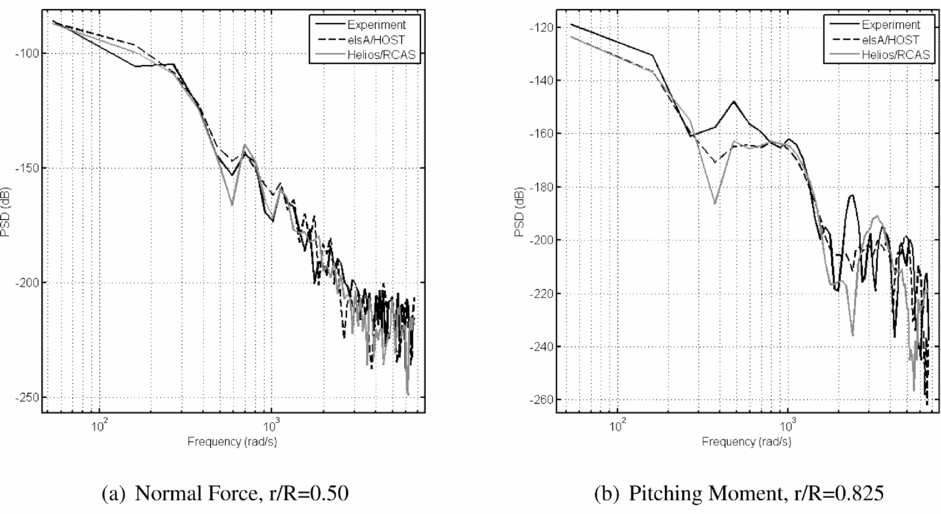
Power spectral density is an indicator of the frequency content of the data. Some frequencies contain a high-power spectral density while others contain a very low one. To assess the best approach for analysing the PSD content, different data windows were evaluated during the frequency analysis performed. These data windows determine how many data points are processed by each application of the FFT. The window size can be specified by a length of time or by a number of time history samples. CIFER® enables the user to condition the data through the use of an algorithm Reference Vassberg40 , where the frequency range of interest is specified by the user. The range of frequencies for these frequencies can be determined with guidance from the PSD analysis.
The M&S best practices call for 20 equally spaced points per window to evaluate the cost function. For the CFD analysis, this selection resulted in a lack of accuracy observed at higher frequencies due to the low data content observed in the PSD analysis for both the experiment and numerical data. This low data content reduced the prediction of the cost function by 5%–20% in the cases that have been evaluated. An evaluation determined that 80 equally spaced points per window were optimal, after which additional data point refinement did not significantly modify the resulting value of the cost function. In this effort for data over a rotor revolution, five windows were generated, analysed, and then stitched together using a composite algorithm in CIFER® to generate the final cost function.
Both the levels and character of the PSD signatures are evaluated for the high-speed test point 312, with examples provided of the most (Fig. 8(a)) and least accurate (Fig. 8(b)) solutions. The normal force coefficient predictions at the 50% blade radial station track very well past the 10/rev harmonic (just above the 103 rad/sec abscissa location), while the pitching moment at the 82.5% blade radial station shows some discrepancies in the 4/rev to 6/rev range (approximately 3 × 10² rad/sec to 6 × 10² rad/sec) and additional differences at 12/rev and higher (about 2 × 10³ rad/sec). Overall, the PSD data indicate that the simulations track well with experimental content to 10/rev and without introducing observable bias from interpolation between the numerical and experimental data. Therefore, the remaining analysis concentrates on the frequency range of 2/rev to 10/rev.
Examples of (a) the most and (b) the least accurate power spectral density analyses for the 7A rotor normal force and pitching moment coefficients for the high-speed test point (312).

Inclusion of high-frequency data where the coherence drops below 0.6 decreases the accuracy of the analysis, so that the PSD signature can be used to identify the appropriate cut-off frequency for the analysis. Beyond validation, the PSD analysis can also be used to aid in quantifying the mesh convergence and/or independence. Some researchers have suggested the evaluation of one or more arbitrary points in the flow to see if the turbulence conforms to the Kolmogorov 5/3 turbulence power law, as a measure of mesh independence(Reference Morton, Kholodar, Billingsley, Forsythe, Wurtzler, Squires, Cummings and Spalart52). However, this measure of turbulence may not be useful for every case, as it may not be necessary to resolve all of the scales of turbulence to achieve convergence of integrated properties. Instead, using a framework such as CIFER® would permit rapid evaluation of specific parameters pertinent to the engineering problem to be resolved. For example, if the chord bending moment is known to have important content up to the 8/rev harmonic, analysis of this parameter using the PSD for different meshes can indicate the quality of the prediction at that frequency.
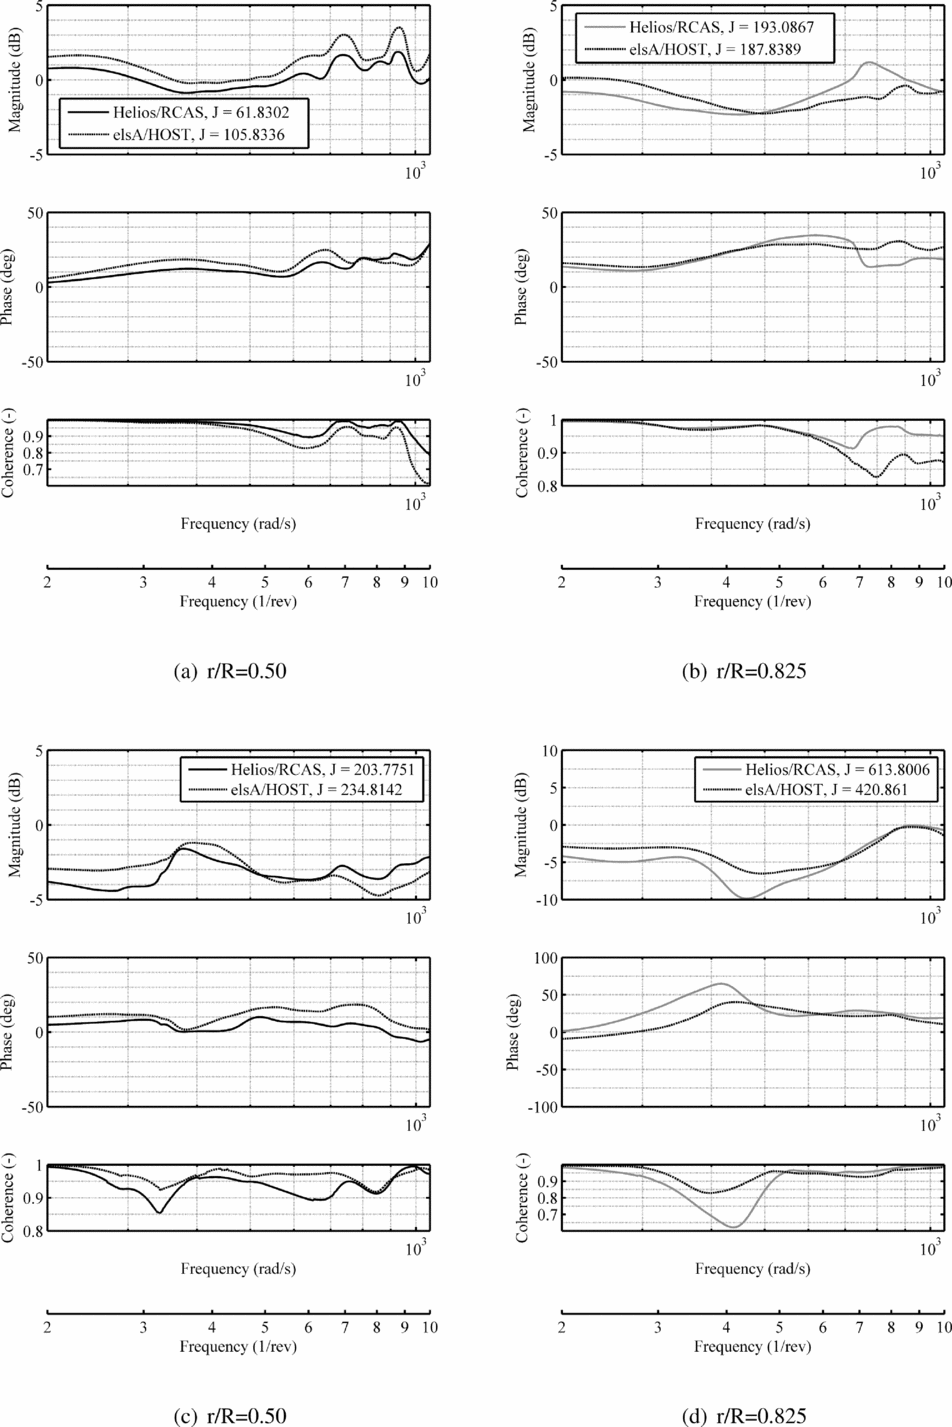
The frequency analysis of the airloads data is synopsised in Fig. 9. Each of the three radial stations analysed for both the normal force and pitching moment is analysed using the magnitude and frequency of the predictions correlated with the baseline wind-tunnel data. A third plot is included for the coherence, which indicates how closely the data match. The cost function associated with each variable are also included in the legend.
Bode plots of the 7A rotor normal force (top row, (a)–(b) ) and pitching moment (bottom row, (c)–(d) ) coefficients for the high-speed test point (312).

Across the analysis, there are some clear trends. Barring two regions of high frequency for both the normal force and the pitching moment, the magnitude error is well within 5dB. The phase error, barring the same two cases where the magnitude error also increased, are within about 30°. The analysis is best at the lower primary harmonics (2/rev to 4/rev) for both phase and magnitude. The coherence shows overall a very good correlation, remaining at 0.8 and above. The larger errors associated at r/R = 0.825 pitching moment are also accompanied by a dip in the coherence below the recommended 0.6 value.
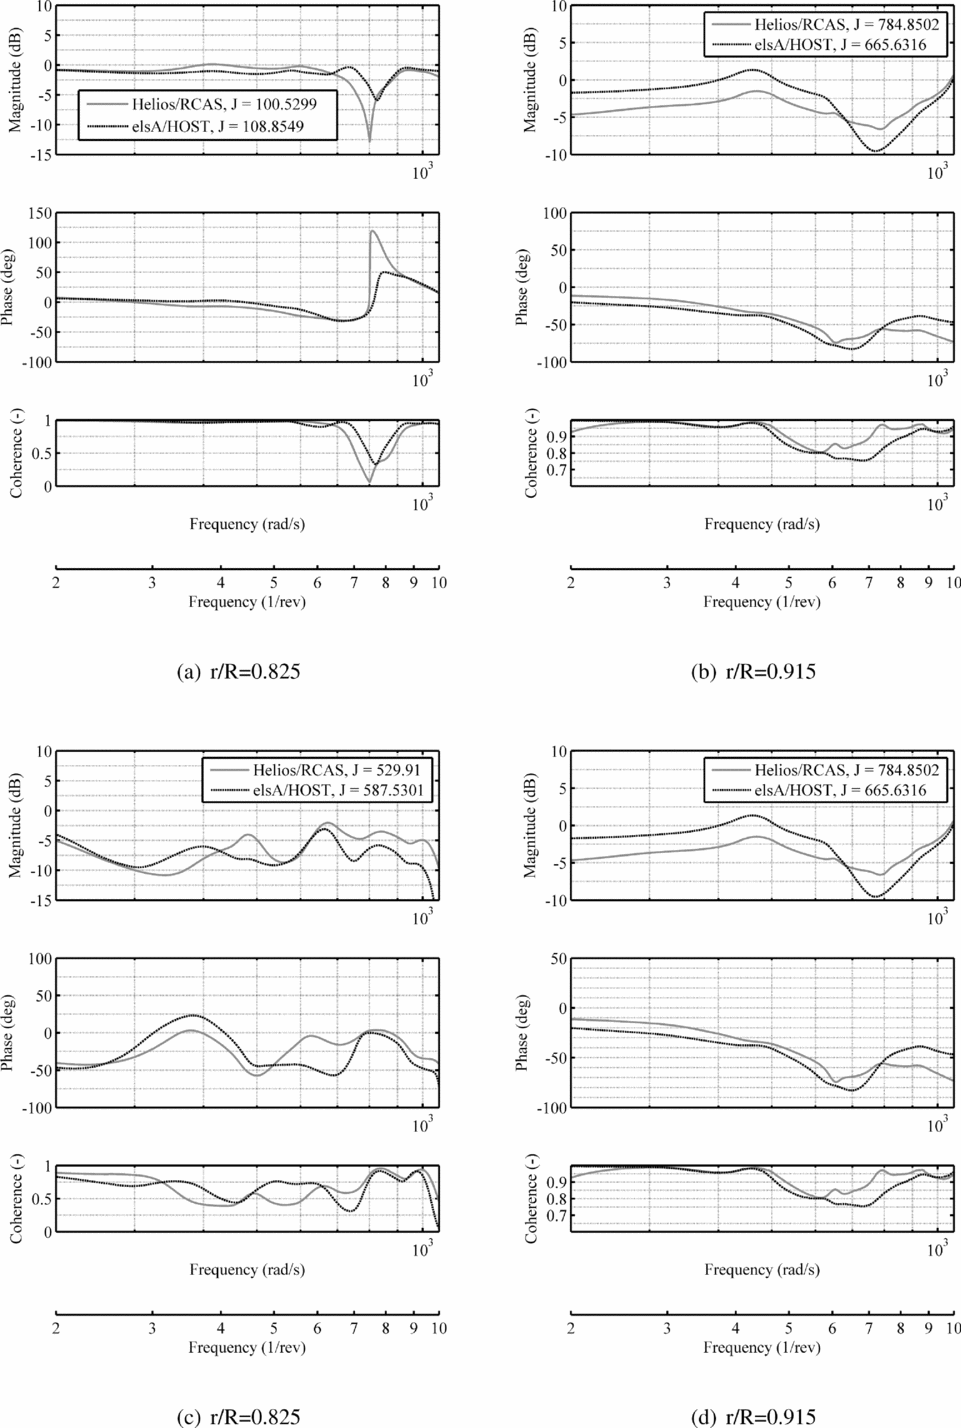
The cost functions vary from 100 or less for the best correlations (force at r/R = 0.5) to 400–600 for the worst correlation (moment at r/R = 0.825). In general, for the four best radial stations, the cost functions average about 200. These numbers could be significantly improved by reducing the upper bound of the frequency, but this has to be done with care as predictions above 4/rev may be important, depending on the parameter.
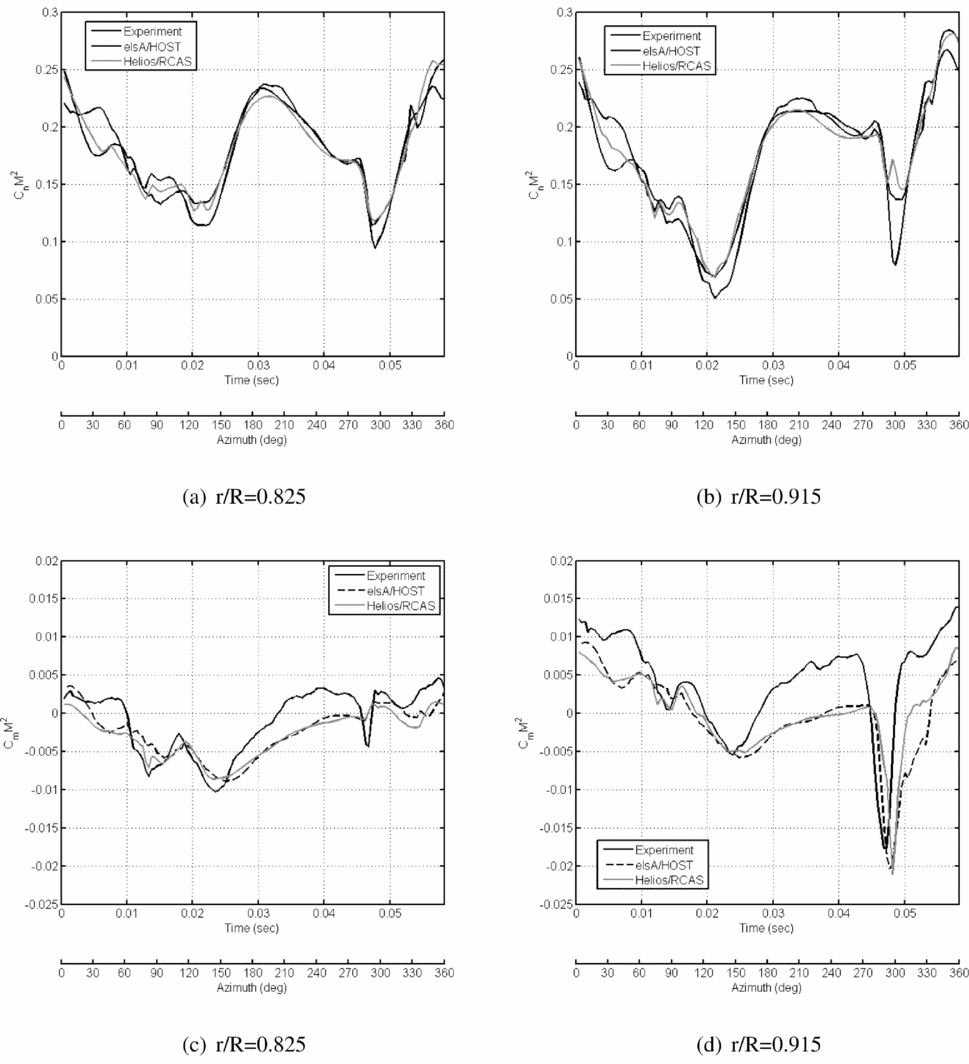
Another critical portion of the flight envelope is the region of high thrust, which can result in the occurrence of dynamic stall. Dynamic stall is still a challenging area of numerical prediction, and the ability of computational methods to capture this physical phenomenon needs to be quantitatively assessed. For the 7A rotor, a test point of high thrust, 293, was evaluated, as depicted in Fig. 10. Three outboard sections where the dynamic stall is apparent in the fourth quadrant were chosen for analysis. Compared to the high-speed test point in Fig. 10, the prediction of the pitching moment for this high-thrust test point is less accurate, which is comparable to the extant literature.
Time history of the 7A rotor normal force (top row, (a)–(b) ) and pitching moment (bottom row, (c)–(d) ) coefficients for the high-thrust test point (293).

The overall character of the PSD plots for this high-thrust case are similar to the characteristics for the high-speed case (Fig. 8), and so examples are not presented here.
The Bode plots for the high-thrust case (Fig. 11) reflect errors that are larger than that of the high-speed case (Fig. 11), which is not unexpected given the complex character of the high-thrust case with dynamic stall. Again, the best correlations occur usually at the lower, primary harmonics, as indicated by the magnitude, phase and coherence plots. These poorer correlations are reflected in the cost functions, which fall, barring the normal force at r/R = 0.825, between 200 and 800. While these are much larger than the high-speed case, they are comparable to some initial evaluations for a different rotor that were presented in the original conference paper(Reference Smith, Jacobson and Afman53).
Bode plots of the 7A rotor normal force (top row, (a)–(b) ) and pitching moment (bottom row, (c)–(d) ) coefficients for the high-thrust test point (293).

Further analysis for multiple revolutions in the case of non-periodic simulations using advanced turbulence models should be evaluated so that the sensitivity to these variations can be assessed. It is important that the cost function not be applied as a single parameter assessment of accuracy, but used in conjunction with the temporal and frequency error plots to develop a full understanding of the prediction.
This demonstration illustrates how a frequency domain analysis, here using the well-documented CIFER® software package, can be used to quantify CFD-based validation. This demonstration is only the first stage of development if a process to certify CSE software tools is adopted. Standards similar to the ADS-33 handling qualities requirements(54), which provide processes and values for simulation fidelity will need to be developed. These standards, which should be developed by the government and industry, will need to consider the following:
-
• What aerodynamic, structural, and aeroelastic parameters should be the reference standards for certification of the CSE methods? Historical perspectives on important parameters that influence later technical problems and cost overruns are important in making this decision.
-
• For a validation case, over what range of the rotor disk should the errors be assessed? Typically, there are data at a few radial stations; so the critical areas needed for design should be identified for current and future experimental and flight testing designed for validation.
-
• What are the acceptable errors in magnitude and phase? Should a cost function be applied? Because of the significant differences in the character of each parameter, it is likely that different standards may be designated for each parameter. These standards may include the frequency band of interest, in particular, an upper bound (i.e. 4/rev or 8/rev).
-
• How many validation cases are necessary and over what portions of the flight envelope should they cover? As the design criteria of future vertical lift changes, these may be more difficult to assign. Current helicopter designs would require at minimum a high-speed and high-thrust case, as evaluated here.
This topic is not a new area, as noted by the discussion of the prior art in the introduction of this work, as well as efforts by organisations, such as the American Institute of Aeronautics and Astronautics(55). Unlike many of the efforts which seek to address the spectrum of CFD applications in vehicles, the discussion and recommendations here are specifically designated for rotating blades, which operate in an unsteady environment. In addition, a process where each simulation’s accuracy can be evaluated and quantified is a key step towards use of these methods for certification.
5.0 CONCLUDING REMARKS
Accurate algorithm development and the availability of extensive computational resources have increased the potential of using high-fidelity CSE tools such as CFD to certify new vertical lift vehicle and component designs, but there are some gaps in current practices and knowledge that should be addressed. In particular:
-
• A verification and validation standard to certify CSE methods for vertical lift must be designed and formally implemented, similar to those for M&S tools. The standards for CSE and M&S tools will not be identical but will have some commonalities. The process by Oberkampf is proposed as a framework for this standard, as it has been adopted by other CSE communities.
-
• CSE software developers should provide formal error assessment as part of their release documentation to ensure stabilisation and accurate accounting of code and solution verification errors.
-
• Standardisation of best practices to ensure quality control in CFD should be implemented to prevent large swings in user variability.
-
• The combination of flow simulations with adjoints can be exploited to develop uncertainty of computed function outputs of CFD that can be used as a measure of “numerical experiment” error.
-
• Adjoint-based mesh adaptation can be applied to reduce the uncertainty due to discretisation by forming an estimated local contribution of each CFD node to the global output error, and to minimise input errors from model uncertainties.
-
• Formal assessments of input and form sensitivities, errors not usually considered in the use of CFD and other CSE tools, must be made. This includes, but is not limited to, uncertainties from manufacturing tolerances and sensitivity to atmospheric turbulence.
-
• Quantification of errors in CFD tools must be improved from the current practice. It is recommended that both time- and frequency-domain assessment be considered. It is proposed that the capabilities of the flight dynamics tool, CIFER® be further assessed and exploited.
-
• Gaps remain in the understanding of some epistemic errors associated with operational parameters, in particular. It is recommended that the vertical lift community identify and assess the importance of these quantities.
ACKNOWLEDGEMENTS
This paper is based on research funded through (a) the U.S. Army/Navy/NASA Vertical Lift Research Center of Excellence at Georgia Tech under the direction of Mahendra Bhagwat of the US Army Aviation Development Directorate (ADD) of the U.S. Army Aviation and Missile Research Development and Engineering Center (AMRDEC), Award Number W911W6-11-2-0010, and (b) the National Aeronautics and Space Administration (NASA), Langley Research Center, Award Number NNX15AU22A, with technical monitor Steven Massey.
The authors would like to thank Yong-Boon Kong, graduate researcher at Georgia Tech, for his help and insights in applying CIFER®, and analysing its results.
In particular, the authors would like to thank the members of the US-France Project Agreement (PA) on Rotary Wing Aeromechanics and Human Factors Integration Research, Task 1, who shared their computational simulation and experimental data so that the quantitative assessments using CIFER® could be made. The task team members include Biel Ortun, Mark Potsdam, Hyeonsoo Yeo, and Khiem van Trunong. The authors would also like to thank Blanche Demaret and Mark Potsdam, the US-French PA technical project officers for permitting this international exchange of data.
The U.S. Government is authorised to reproduce and distribute reprints notwithstanding any copyright notation thereon. The views and conclusions contained in this document are those of the authors and should not be interpreted as representing the official policies, either expressed or implied, of the U.S. Government.