




No CrossRef data available.
Article contents
Togetherness among Plasmodium falciparum gametocytes: interpretation through simulation and consequences for malaria transmission
Published online by Cambridge University Press: 17 October 2003
Abstract
Previous experimental gametocyte infections of Anopheles arabiensis on 3 volunteers naturally infected with Plasmodium falciparum were conducted in Senegal. They showed that gametocyte counts in the mosquitoes are, like macroparasite intakes, heterogeneous (overdispersed). They followed a negative binomial distribution, the overdispersion coefficient seeming constant (k=3·1). To try to explain this heterogeneity, we used an individual-based model (IBM), simulating the behaviour of gametocytes in the human blood circulation and their ingestion by mosquitoes. The hypothesis was that there exists a clustering of the gametocytes in the capillaries. From a series of simulations, in the case of clustering the following results were obtained: (i) the distribution of the gametocytes ingested by the mosquitoes followed a negative binomial, (ii) the k coefficient significantly increased with the density of circulating gametocytes. To validate this model result, 2 more experiments were conducted in Cameroon. Pooled experiments showed a distinct density dependency of the k-values. The simulation results and the experimental results were thus in agreement and suggested that an aggregation process at the microscopic level might produce the density-dependent overdispersion at the macroscopic level. Simulations also suggested that the clustering of gametocytes might facilitate fertilization of gametes.
Keywords
Information
- Type
- Research Article
- Information
- Copyright
- 2003 Cambridge University Press
INTRODUCTION
Schistosomes, like filariae, are classified as macroparasites and usually have observed distributions that reflect togetherness (May, 1977; Pichon, Prod'hon & Rivière, 1980 a,b). Compared to the mean burden, some hosts are hyper-parasitized when others can be under-parasitized or even not parasitized at all. The distributions representing this togetherness, also referred to as aggregation or contagion (Crofton, 1971 a,b; May, 1977; Anderson & May, 1985) are called overdispersed distributions and are defined by a variance greater than the mean (s2>m), and thus differ from the Poisson distribution (s2=m). It has been shown (Pichon, Awono & Robert, 2000) that Plasmodium falciparum, generally considered, at least by its size, as a microparasite, shares this capacity of togetherness. The present study investigates a crucial point of the life-cycle, the parasite's (gametocyte) transmission from man to vector (in which the fertilization will occur), through the feeding by the mosquito via the host's peripheral capillaries (Gordon & Lumsden, 1939; Petit, 1985). The purpose of this study was (i) to explore the parasite flow in the human blood circulation and (ii) to evaluate its impact on the parasite reproduction in the vector.
Pichon et al. (1980 a) have demonstrated that the overdispersion of microfilariae in the vector depends only on parasite behaviour in the capillaries (Fig. 1A). The same aggregation (k=1: geometric distribution) is found in vectors (Aedes polynesiensis) and in non-vectors in Polynesia (Ae. aegypti, C. quinquefasciatus). This geometric distribution was also applied to other microfilaria vectors, in particular, to An. gambiae s.l., and C. quinquefasciatus in Africa (Crans, 1973). In the present study, we make the hypothesis that the phenomenon of gametocyte aggregation observed in the mosquito after ingestion is directly related to the parasite behaviour inside the capillaries. Since gametocytes have a much smaller size, as compared with that of microfilariae, they are not capable of forming queues. Thus, we propose, as was suggested by Pichon et al. (2000), that gametocytes are able to bind with one another inside the capillaries. A computerized simulation model (IBM, Individual Based Model) was then developed in order to generate a large number of virtual experiments as an alternative to a few experiments on volunteers.

Fig. 1. Schemes comparing the CINEFIL model (above) and the GamMa model (below). In the CINEFIL the macroparasites (microfilariae) form a queue in the capillaries but this togetherness is lost as soon as the parasites exit the capillaries. In the GamMa model the togetherness created by the binding of gametocytes remains throughout the circulatory system. This difference of behaviour explains the different evolutions of the k parameter (constant and equal to 1 in the CINEFIL model and increasing in the GamMa model, graphs at the right). The laminar speed profile is shown. The speed varies with the position inside the capillary. The closer a gametocyte is to the side, the more the friction on the endothelial surface slows it down.
The objectives of our work are (i) to explain the overdisperison found by Pichon et al. (2000) and (ii) to test if our hypothesis of binding gametocytes is acceptable.
MATERIALS AND METHODS
Individual Based Model
The working hypothesis is tested by a so-called Individual Based Model (IBM, DeAngelis, Cox & Coutant, 1979). It is a simulation based on the global consequences of local interactions among a large number of members, called individuals or agents (Ferber, 1995), of a population. It usually consists of allocating rules of behaviour to the individuals, which will determine their activity (i.e. reproduction, migration …). These rules depend on the state of the current individual and that of the close neighbours and on the surrounding environment (DeAngelis, Rose & Huston, 1994). In our model, the individuals are represented by the gametocytes, or clusters of gametocytes, and they interact with each other inside an environment, which will be a schematic blood circulatory system. A simpler model, based on the same principle, has been used (Pichon & Mullon, 1991) to simulate and explain frequency distributions of microfilariae ingested by mosquitoes (CINEFIL simulator, Fig. 1A).
Model description
The IBM developed is called GamMa (Gametocytes Malaria), and as CINEFIL it is a model only based on simple and plausible assumptions. It simulates (i) P. falciparum gametocyte movement, and mutual encounters in the blood circulation, more specifically in the laminar circulation of the blood capillaries, (ii) their binding and break-up, with a probability depending on the size of the aggregate, (iii) virtual mosquitoes feeding in the superficial blood capillaries, and (iv) the reproduction of the virtual parasites inside the virtual mosquito's stomach. The latter is simulated using a ‘morula’ model (Pichon, personal communication) in which the virtual mosquito stomach is divided into equal-sized compartments (set to 10). Fertilization occurs only if at least 1 male and 1 female virtual gametocyte are found in the same compartment. This was suggested by the observation that the microgametes of P. falciparum have a rather limited range of displacement in the mosquito's stomach (Antolisei & Angelini, 1890; Garnham, 1966; Gaillard & Boudin, personal communication) and that there is no attractive effect (Sinden, 1983, 1984, 1989) to guide the microgamete towards the macrogamete. A schematic representation of the model is given in Fig. 1B. The principal parameters of the model are described in Table 1.

Preliminary estimations and adjustments
The first simulations were designed with gametocytes aggregating to their close neighbours (mainly in the narrow capillaries) at a given probability. But with this condition alone, due to a snowballing effect, the size of the gametocyte clusters grew at an exponential rate, and soon became clusters of clusters of gametocytes. Thus, we had to assume a break-up phenomenon, happening in perturbation zones, in which one or more gametocytes from the cluster could be freed at a given probability. The value of these parameters in the simulator had to be chosen arbitrarily because biological knowledge of the phenomenon was lacking.
The break-up probability was set to 0·1. Different values of the binding probability were then tested (it represents the probability that 2 gametocytes will adhere to one another when they come in contact). It was tested, varying from 0·15 to 0·95. For every probability chosen, a few simulations with different densities of circulating gametocytes were made. We assumed that the physical aggregates, if they exist, had to be small, otherwise they would be easily detectable. We thus, arbitrarily decided that the maximum size of the simulated clusters would be of the order of 10 gametocytes. It was then established that the probability for clustering gametocytes would be set to 0·3 because it was visually recognized that under the above conditions, the size of the clusters circulating in the blood circuit seldom exceeded 5 gametocytes.
Validation
In order to validate our model, the 3 published experiments obtained with A. arabiensis mosquitoes (Pichon, Awono & Robert, 2000) and conveniently renamed S1, S2 and S3 in increasing order of gametocytaemia (‘S’ for Senegal) were compared with new experiments. With the same protocol as the one of Pichon et al. (2000), one of us (C.B., then in Cameroon, OCEAC, IRD) carried out 2 experiments using An. gambiae s.s. as vectors, one with a medium gametocyte density (C1) and one with a high density (C2).
To check the adequacy between the observed data and the negative binomial model, a χ2 test is used, completed by a T-test which is more sensitive to the differences that may appear in the tail of the distribution (Anscombe, 1950; Bliss & Fisher, 1953). All the k-values were calculated using the maximum likelihood estimation. We used a test of Fisher (in Bliss & Fisher, 1953) to test if different distributions may have the same k-value. These methods are implemented in the freeware ParaDis (Pichon & Mullon, 1998).
RESULTS
Simulation results
Several simulations were made, each with a different number of circulating gametocytes (from 10 to 5000). For each simulation, the values of mg, kg (respectively the average number of gametocytes ingested by the mosquitoes and the corresponding overdispersion parameter of the negative binomial distribution), mz, and kz (respectively the average number of zygotes formed in the mosquito and the overdispersion parameter of the negative binomial distribution) were calculated. Forty-three different simulated distributions were obtained. The value of mg (directly related to the number of circulating gametocytes) varied from 0·34 to 94·88 gametocytes/mosquito.
Each of the simulated distributions was overdispersed and well fitted by a negative binomial distribution. The main result that emerges from the simulations is the variation of the calculated kg value (varying from 0·55 to 3·13), which showed density dependence of the kg value as it increased with the mean intake of gametocytes by the mosquitoes (Fig. 2). The correlation coefficient calculated for the kg values, was highly significant: R=0·78 (P<10−4).

Fig. 2. Relationship between the simulated overdispersion parameter kg and the simulated mean mg gametocyte intakes of Plasmodium falciparum. Every dot represents a simulation experiment involving 100 mosquitoes, its coordinates, the values of k and m of the negative binomial that best fit the simulation data. The regression line of the observed results weighted by the variance of k is also plotted. The small figure represents the regression line of the simulation results in untransformed scale.
We simulated situations where the clusters formed inside the capillaries did not remain bound once leaving their confined space. The gametocytes were thus circulating freely throughout the rest of the blood circulation. The distributions obtained under those conditions, for the gametocyte intakes were well fitted by a Poisson distribution but not by a negative binomial distribution.
Simulations where gametocytes did not bind were also performed. All the obtained distributions for the gametocyte intakes were well fitted by a Poisson distribution but not by a negative binomial distribution.
Experimental results
The two new distributions from Cameroon are also overdispersed (Table 2, Annex 1).
Table 2. Main characteristics of the Cameroon experiments (k*, Maximum likelihood estimate of k (inverse of the overdispersion); D.F., degree of freedom; S.E., standard error.)

In volunteer C1, the data were well fitted by a negative binomial (P=0·53; k±S.E.=1·42±0·32), and there was no significant difference between his k value and the ones of S2 and S3, who had a gametocyte density of the same order. For volunteer C2, the fit of the results by a Poisson was rejected (P[les ]10−4, very highly significant) whereas the fit by a negative binomial is acceptable (P=0·313; k±S.E.=7·3±1·80).
The 5 experimental k values (3 ‘S’, and 2 ‘C’) are plotted versus the 5 m-values (in logarithmic scale) (Fig. 3).

Fig. 3. Experimental results. Representation of the relationship between the observed overdispersion parameter k and the gametocyte density. The area of the circles is proportional to the inverse of the variance of k. The bars represent the 95% confidence interval for every value. Legend of dots; ‘S’: experiments from Senegal; ‘C’: experiments from Cameroon.
A significant positive correlation was observed with a correlation coefficient R=0·91 (P<0·02).
Statistical analysis of the observed density dependence
The Fisher's kc test was used. It allows comparison of the overdispersion of different distributions using the maximum likelihood, and permits the estimation of a common value of k (kc). The 3 samples S1, S2 and S3 of Pichon et al. (2000) were found to be homogenous (χ2=0·29; D.F.=2; P=0·87), with a common kc value kc±S.E. kc=3·105±0·392. If we apply this test globally to the 5 experimental values, it does not allow us to conclude to any significant heterogeneity (χ2=5·84; D.F.=4; P=0·211). Thus, in a first approach, we could conclude that the overdispersion is homogenous, with an estimated value of a common kc±S.E.=2·94±0·319, close to the one found by Pichon et al. (2000).
If the Fisher's test is applied to the 3 ‘central’ values (S2, S3 and C1), no significant heterogeneity appears (χ2=4·71; D.F.=2; P=0·095). For a gametocyte density of the same level, the experiments from Senegal and Cameroon show a similar result. If we include the sample S1 to the previous group a highly significant heterogeneity between the different overdispersions is found (χ2=23·96; D.F.=3; P=0·001).
However, because of the small size and high variance of some experiments, this test does not seem very powerful. Thus, the data were more thoroughly analysed. We studied the regression of the k values obtained by maximum likelihood on the parasite density weighting the values, as usual, by the inverse of the variance of k (Fig. 3). The correlation coefficient becomes very highly significant (R=0·97; P<0·001).
In order to estimate the confidence intervals of the k values as a function of the number of mosquitoes used, we conducted 30000 simulations for every experimentation. Each simulation randomly draws samples of the same size coming from simulated negative binomial distributions with the same mean and overdispersion as the ones calculated. We thus obtained for every one of the 5 values a histogram of the k parameter calculated by maximum likelihood, and the 95% confidence interval of that distribution. The results are illustrated in Fig. 3. As can be seen, the 2 extreme observations significantly differ from the kc=2·945 value, whereas the 3 central values do not significantly differ from this value.
We can thus conclude, with some confidence, the density dependence of k in the observed data. Thus density dependence suspected through modelling is borne out. When the mean of gametocyte intakes is about 1, the overdispersion parameter k is also about 1 (in the results found as well as in the simulated results). In that case, the distribution of parasite loads corresponds to a geometrical distribution, which is also observed in the case of microfilariae and was reproduced by the CINEFIL simulator (Pichon & Mullon, 1991). This proves that the assumed gametocyte mutual adherence is not negligible, even though the microfilariae are about 15 times longer than the gametocytes. At this density, if their loads inside the mosquitoes is considered alone, gametocytes seem to behave like microfilariae: P(0)=0·5; P(1)=0·25; P(2)=0·125 … .
DISCUSSION
Different mosquito species and parasite populations
The 5 experiments (3 in Senegal and 2 in Cameroon), although following the same overall protocol, were done using 2 different species of the An. gambiae complex. The experiments in Senegal used An. arabiensis mosquitoes and the experiments in Cameroon used An. gambiae s.s. However, this difference does not hinder us from comparing the results from the 2 experiments since the content of the midguts only reflects the state of the blood inside the capillaries. The experiment could very well have been conducted, as was done by Pichon, Prod'hon & Rivière (1980 a) for the ingested microfilariae counts, with non-vector mosquito species.
The parasite strains in the 2 sets of experiments were also different (one from savannah and the other from the forest). However, the behaviour seemed to be similar since volunteers C1, S2 and S3 showed results of the same order. This conclusion being based on very few cases, it would be needed to conduct additional experiments to confirm this tendency.
Statistical aggregation and physical aggregation among gametocytes
According to Crofton (1971 a) the majority of parasitic distributions are overdispersed and are fitted by a negative binomial distribution. This is found in the simulated results, as well as in the experimental results: they are overdispersed and satisfactorily fitted by a negative binomial distribution. Thus, in spite of their small size, P. falciparum gametocytes do not seem to circulate in a homogenous pattern. A simple hypothesis to explain the observed statistical aggregation at the global level is that a clustering process, i.e. physical aggregation, intervenes between gametocytes at the microscopic level. In other words, the gametocytes would interact and bind to one another inside the confined capillary space. The simulations show us that they remain bound in the bigger blood vessels.
This hypothesis is plausible because physical aggregation i.e. cytoadherence, seems to be a common phenomenon at different stages of P. falciparum's life-cycle. The schizogonial forms are capable of adhering to the endothelial surface of the capillaries (McPherson et al. 1985; Aikawa, 1988; Turner et al. 1994). Also, schizogonial forms can bind to one or more non-infected red blood cells and form a rosette (Ringwald et al. 1992; Treutiger et al. 1992; Wahlgren et al. 1994). The formation of rosettes in capillaries is common in patients with severe and complicated malaria (McPherson et al. 1985; Aikawa, 1988; Carlson et al. 1990; Pongponratn et al. 1991; Rowe et al. 1995).
Cytoadherence also occurs with non-mature gametocytes. During the gametocytogenesis, occurring inside the bone-marrow, the young gametocytes formed adhere to the endothelial surface of a capillary during the gametocyte maturation (Diebner et al. 2000) and therefore are not found in blood circulation.
Last but not least, even in the mosquito's stomach, during exflagellation, ‘microgametes avidly adhere to neighbouring infected and uninfected erythrocytes’ (Templeton et al. 1998).
Sociology and gametocytes
There exists a vast body of literature describing the dynamics of grouping by stochastic models (Okubo, 1986), the most relevant for us being the sociological model of J. E. Cohen (1971). He assumes that, in casual groups of monkeys and men, considering a very short time-interval, the probabilities of arrival and departure of an individual to or from a group of size z (z>0) is linearly dependent on z. He also demonstrates that the equilibrium frequency distribution is a truncated (without zeros) negative binomial distribution.
GamMa model assumes also that the probability of incrementation or decrementation of a group is also dependent on its size, but in a non-linear way, to avoid probability exceeding 1. The zero-group situation is included, as vectors may have a non-infective bloodmeal.
Parasitic yield and aggregation advantage
Pichon et al. (2000) defined the aggregation advantage by the ratio of the zygote production (or of the yield) in case of gametocyte binding and the zygote production in case of freedom. It represents the multiplying factor for zygote production at a given mean number of circulating gametocytes if the distribution is overdispersed compared to a Poisson distribution.
The parasitic yield (mz/mg) is different when gametocytes are adhering to one another (varies from 0·11 to 0·56) than when they circulate freely (varies from 0·01 to 0·50) (Fig. 4). This difference is the most important at medium or low gametocytaemia, and disappears at high densities of gametocytes. The theoretical aggregation advantage of gametocytes clustering is 2 for a medium density of 10 gametocytes/vector, 6 for 1 gametocytes/vector, and 15 for 0·1 gametocytes/vector (Fig. 5) (the densities are expressed as the mean number of gametocytes ingested by the mosquitoes). Thus the aggregating phenomenon may be an adaptation to low gametocytaemia. At high gametocytaemia the difference is reduced because the many circulating gametocytes in the blood flow have more chances of finding themselves close to another gametocyte. In Pichon et al. (2000) the advantage found (with constant k=3·1) compared to the Poisson distribution never exceeded 1·4.

Fig. 4. Parasitic yields (zygotes/gametocytes ratio) obtained with the gametocytes circulating freely ([squf ]) and when the gametocytes are adherent (□). Every dot represents a simulation (100 mosquito bites on an infected person).

Fig. 5. Theoretical parasitic aggregation advantage=ratio of produced zygotes in case of clustering on produced zygotes in case of freedom.
Sex ratio
A lot of attention has been paid recently to the idea that low gametocyte densities can lead to problems for male gametes fertilizing the female gametes, and that as a consequence, a less female biased sex ratio is favoured as a form of fertility insurance (West, Reece & Read, 2001; West et al. 2002). Our model simulates fertilization with an arbitrary constant female biased sex ratio (30% male gametocytes, Robert et al. 1996). Moreover, it was found that the mean number of calculated zygotes per mosquito was greater, at low gametocytaemia, in the case of aggregating gametocytes (varying from 0·06 to 50·4 zygotes/mosquito) than in the case of freely circulating gametocytes (varying from 0·17 to 2·47 zygotes/mosquito). The fertility is maintained, even at low gametocyte density when they are aggregating. It could be imagined that this aggregating phenomenon allows the parasite to bypass the need of selecting variants with a less female biased sex ratio (West et al. 2001, 2002). It would, however, be interesting to explore a combination of both phenomena (varying sex ratio and clustering).
Considering the relative volumes of a macrogamete (diameter 10 μm) and of a mosquito stomach (volume: V±S.E., V=2·7 mm3±0·5; Vaughan, Noden & Beier, 1991), the probability that a microgamete ‘hits’ a macrogamete target in a spherical space without any attraction (Sinden, 1983, 1984, 1989) would be 1/(5 million) (Pichon, unpublished observations). A simulated 3D random walk gives a 200 to 500 m covered distance by the microgamete before mating (Pichon, unpublished observations). Thus a phenomenon bringing the parasites closer to one another seems to be a good evolutionary break through, compensating the lack of attraction.
The parsimonious working hypothesis proposed does not invalidate the fact that gametocyte overdispersion can be caused by other mechanisms. If the hypothesis is made more complex by the interaction of cytoadhering asexual parasites with the capillary endothelial surfaces, the plugs formed might even more favour the formation of gametocyte clusters. One could also imagine that there is a sex preference in the clustering: the gametocytes binding preferentially to gametocytes of the opposite sex.
The formation of gametocyte clusters is a process allowing the optimization of the parasitic reproduction and can thus almost be considered as a ‘pre-fertilization’. The lower the gametocyte density in the human blood circulation is, the closer the gametocytes tend to get: thus, they concentrate in a small number of vectors, and in these vectors, they stay close to one another (‘together’) to make their mating easier.
One can conjecture that for P. vivax, the microgametes of which are known to be more active and ‘efficient’ (Garnham, 1966), cytoadherence would play a lesser role than for P. falciparum.
Parasite population dynamics
May (1977) showed that, for macroparasites, overdispersion facilitates the encounter between both sexes. If the parasite population density is lowered, the presence of many individuals in the same host (aggregation) will allow the population to survive, even if the overdispersion parameter remains constant.
The same is true with P. falciparum. If the gametocyte population diminishes, the fact that overdispersion will increase will reinforce the clustering. Presence of gametocytes in a human population is a seasonal process. Even when they appear to have disappeared from the blood, the density dependence of k could explain that some transmission is still occurring. Thus density-dependent overdispersion is a powerful stabilizing strategy.
Vincent Robert was funded in part by the Grand Programme Horizontal of the Institut Pasteur. This research was supported by IRD.
References
REFERENCES
AIKAWA, M.
(1988).
Human cerebral malaria.
American Journal of Tropical Medicine and Hygiene 39, 3–10.CrossRefGoogle Scholar
ANDERSON, R. M. &
MAY, R. M.
(1985).
Helminth infections of humans: mathematical models, population dynamics, and control. Advances in Parasitology 24, 1–101.CrossRefGoogle Scholar
ANSCOMBE, F. J.
(1950).
Sampling theory of the negative binomial and logarithmic series distributions. Biometrika 37, 358.CrossRefGoogle Scholar
ANTOLISEI, E. &
ANGELINI, A.
(1890).
Osservazioni sopra alcuni casi d'infezione malarica con forme semilunari.
Rivista Clinica – Archivio italiano di Clinica Medica 29, 1–23.Google Scholar
BLISS, C. I. &
FISHER, R. A.
(1953).
Fitting the negative binomial distribution to biological data, with a note on the efficient fitting.
Biometrics 9, 176–200.CrossRefGoogle Scholar
CARLSON, J.,
HELMBY, H.,
HILL, A. V. S.,
BREWSTER, D.,
GREENWOOD, B. M. &
WAHLGREN, M.
(1990).
Human cerebral malaria: association with erythrocyte rosetting and lack of anti-rosetting antibodies.
Lancet 336, 1457–1460.CrossRefGoogle Scholar
COHEN, J. E.
(1971).
Casual Groups of Monkeys and Men: Stochastic Models of Elemental Social Systems.
Harvard University Press,
Cambridge, Mass.CrossRef
CRANS, W. J.
(1973).
Experimental infection of Anopheles gambiae and Culex pipiens fatigans with Wuchereria bancrofti in coastal East Africa.
Journal of Medical Entomology 10, 189–193.CrossRefGoogle Scholar
CROFTON, H. D.
(1971 a).
A quantitative approach to parasitism.
Parasitology 63, 343–364.Google Scholar
CROFTON, H. D.
(1971 b).
A model of host–parasite relationships.
Parasitology 63, 365–371.Google Scholar
DeANGELIS, D. L.,
COX, D. C. &
COUTANT, C. C.
(1979).
Cannibalism and size dispersal in young-of-the-year largemouth bass: experiments and model.
Ecological Modelling 8, 133–148.Google Scholar
DeANGELIS, D. L.,
ROSE, K. A. &
HUSTON, M. A.
(1994).
Individual-oriented approaches to modelling ecological populations and communities. In
Frontiers in Mathematical Biology (ed. Levin, S. A.), pp. 390–410. Lecture Notes in Biomathematics 100, Springer Verlag, Berlin.
DIEBNER, H. H.,
EICHNER, M.,
MOLINEAUX, L.,
COLLINS, W. E.,
JEFFREY, G. M. &
DIETZ, K.
(2000).
Modelling the transition of asexual blood stages of Plasmodium falciparum to gametocytes.
Journal of Theoretical Biology 202, 113–127.CrossRefGoogle Scholar
FERBER, J.
(1995).
Les Systèmes Multi-agents. Vers une Intelligence Collective.
Inter-Editions,
Paris.
GARNHAM, P. C. C.
(1966).
Malaria Parasites and other Haemosporidia.
Blackwell Scientific Publications,
Oxford.
GORDON, R. M. &
LUMSDEN, W. H. R. (1939).
A study of the behaviour of the mouth-parts of mosquitoes when taking up blood from living tissue; together with some observations on the ingestion of microfilariae.
Annals of Tropical Medicine and Parasitology 46,
311–319.CrossRefGoogle Scholar
MAY, R. M.
(1977).
Togetherness among schistosomes: its effect on the dynamics on the infection.
Mathematical Bioscience 35, 301–343.CrossRefGoogle Scholar
McPHERSON, G. G.,
WARRELL, M. J.,
WHITE, N. J.,
LOOAREESUWAN, S. &
WARELL, D. A.
(1985).
Human cerebral malaria. A quantitative ultrastructural analysis of parasitized erythrocyte sequestration.
American Journal of Pathology 119, 385–401.Google Scholar
OKUBO, A.
(1986).
Dynamical aspects of animal grouping: swarms, schools, flocks, and herds.
Advances in Biophysics 22, 1–94.CrossRefGoogle Scholar
PETIT, G.
(1985).
Ingestion des hématozoaires par le vecteur. Analyse de quatre filaires parasites d'un Saïmiri.
Annales de Parasitologie Humaine et Comparée 60, 247–297, 455–497.CrossRefGoogle Scholar
PICHON, G.,
AWONO, P. &
ROBERT, V.
(2000).
High heterogeneity in the number of Plasmodium falciparum gametocytes in the bloodmeal of mosquitoes fed on the same host.
Parasitology 121, 115–120.CrossRefGoogle Scholar
PICHON, G. &
MULLON, C.
(1991).
Les distributions rencontrées en parasitologie; Introduction: la Filariose de Bancroft, prototype des relations hôte-parasites. In
SEMINFOR 5 Statistique Impliquée
(ed. ORSTOMed, Paris), pp. 289–301.
PICHON, G. &
MULLON, C.
(1998).
ParaDis version 2.1, software for statistical analysis of parasitic distributions. IRD-GEODES Downloadable Freeware:http://www.bondy.ird.fr/~pichon/paradis
PICHON, G.,
PROD'HON, J. &
RIVIÈRE, F.
(1980 a).
Hétérogénéité de l'ingestion des parasites sanguicoles par leurs vecteurs: description quantitative et interprétation.
Comptes Rendus de l'Académie des Sciences, Paris, série Biologie 18, 1011–1013.Google Scholar
PICHON, G.,
PROD'HON, J. &
RIVIÈRE, F.
(1980 b).
Filarioses: surdispersion parasitaire et surinfection de l'hôte invertébré.
Cahiers ORSTOM, Série Entomologie Médicale et Parasitologie 18, 27–48.Google Scholar
PONGPONRATN, E.,
RIGANTI, M.,
PUNPOOWONG, B. &
AIKAWA, M.
(1991).
Microvascular sequestration of parasitized erythrocytes in human falciparum malaria: a pathological study.
American Journal of Tropical Medicine and Hygiene 44, 168–175.CrossRefGoogle Scholar
READ, A. F.,
NARARA, A.,
NEE, S.,
KEYMER, A. E. &
DAY, K. P.
(1992).
Gametocyte sex ratios as indirect measures of outcrossing rates in malaria.
Parasitology 104, 387–395.CrossRefGoogle Scholar
RINGWALD, P.,
LEPERS, J. P.,
LE BRAS, J.,
RAKOTOMALALA, C.,
RABONIRINA, M.,
VUILLEZ, J. P.,
RAZANAMPARANY, M.,
PEYRON, F. &
ROUX, J.
(1992).
Parasite virulence factors during falciparum malaria: Rosetting, cytoadherence, and modulation of cytoadherence by cytokines.
Infection and Immunity 61, 5198–5204.Google Scholar
ROBERT, V.,
READ, A.,
ESSONG, F.,
TCHUINKAM, T.,
MULDER, B.,
VERHAVE, J. P. &
CARNEVALE, P.
(1996).
Effect of gametocytes sex ratio on infectivity of Plasmodium falciparum to Anopheles gambiae.
Transactions of the Royal Society of Tropical Medicine and Hygiene 90, 621–624.CrossRefGoogle Scholar
ROWE, A.,
OBEIRO, J.,
NEWBOLD, C. I. &
MARSH, K.
(1995).
Plasmodium falciparum rosetting is associated with malaria severity in Kenya.
Infection and Immunity 63, 2323–2326.Google Scholar
SINDEN, R. E.
(1983).
The cell biology of sexual development in Plasmodium.
Parasitology 86, 7–28.CrossRefGoogle Scholar
SINDEN, R. E.
(1984).
The biology of Plasmodium in the mosquito.
Experimentia 40, 1330–1343.CrossRefGoogle Scholar
SINDEN, R. E.
(1989).
Recent advances in the parasitology of malaria.
Transactions of the Royal Society of Tropical Medicine and Hygiene 83 (Suppl.), 3–9.CrossRefGoogle Scholar
TEMPLETON, J. T.,
KEISTER, D. B.,
MURATOVA, O.,
PROCTER, J. L. &
KASLOW, D. C.
(1998).
Adherence of erythrocytes during exflagellation of Plasmodium falciparum microgametes is dependent on erythrocyte surface sialic acid and glycophorins.
Journal of Experimental Medicine 187, 1599–1609.CrossRefGoogle Scholar
TREUTIGER, C. J.,
HEDLUND, I.,
HELMBY, H.,
CARLSON, J.,
JEPSON, A.,
TWUMASI, P.,
KWIATKOWSKI, D.,
GREENWOOD, B. M. &
WAHLGREN, M.
(1992).
Rosette formation in Plasmodium falciparum isolates and anti-rosette activity of sera from Gambians with cerebral or uncomplicated malaria. American Journal of Tropical Medicine and Hygiene 46, 503–510.CrossRefGoogle Scholar
TURNER, G. D. H.,
MORRISON, H.,
JONES, M.,
DAVIS, T. M. E.,
LOOAREESUWAN, S.,
BULEY, I. D.,
GATTER, K. C.,
NEWBOLD, C. I.,
PUKRITAYAKAMEE, S.,
NAGACHINTA, B.,
WHITE, N. J. &
BERENDT, A. R.
(1994).
An immunohistochemical study of the pathology of fatal malaria.
American Journal of Pathology 145, 1057–1069.Google Scholar
VAUGHAN, J. A.,
NODEN, B. H. &
BEIER, J. C.
(1991).
Concentration of human erythrocytes by anopheline mosquitoes (Diptera: Culcidae) during feeding.
Journal of Medical Entomology 28, 780–786.CrossRefGoogle Scholar
WAHLGREN, M.,
FERNANDEZ, V.,
SCHOLANDER, C. &
CARLSON, J.
(1994).
Rosetting.
Parasitology Today 2, 73–79.CrossRefGoogle Scholar
WEST, S. A.,
REECE, S. E. &
READ, A. F.
(2001).
Evolution of gametocyte sex ratios in malaria and related apicomplexan (protozoan) parasites.
Trends in Parasitology 17, 525–531.CrossRefGoogle Scholar
WEST, S. A.,
SMITH, T. G.,
NEE, S. &
READ, A. F.
(2002).
Fertility insurance and the sex ratios of malaria and related haemosporin blood parasites.
Journal of Parasitology 88, 258–263.CrossRefGoogle Scholar
WILLIAMS, C. B.
(1964).
Patterns in the Balance of Nature and Related Problems in Quantitative Ecology.
Academic Press,
London.
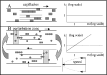
Fig. 1. Schemes comparing the CINEFIL model (above) and the GamMa model (below). In the CINEFIL the macroparasites (microfilariae) form a queue in the capillaries but this togetherness is lost as soon as the parasites exit the capillaries. In the GamMa model the togetherness created by the binding of gametocytes remains throughout the circulatory system. This difference of behaviour explains the different evolutions of the k parameter (constant and equal to 1 in the CINEFIL model and increasing in the GamMa model, graphs at the right). The laminar speed profile is shown. The speed varies with the position inside the capillary. The closer a gametocyte is to the side, the more the friction on the endothelial surface slows it down.

Table 1. Principal parameters of the GamMa model
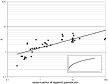
Fig. 2. Relationship between the simulated overdispersion parameter kg and the simulated mean mg gametocyte intakes of Plasmodium falciparum. Every dot represents a simulation experiment involving 100 mosquitoes, its coordinates, the values of k and m of the negative binomial that best fit the simulation data. The regression line of the observed results weighted by the variance of k is also plotted. The small figure represents the regression line of the simulation results in untransformed scale.

Table 2. Main characteristics of the Cameroon experiments
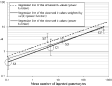
Fig. 3. Experimental results. Representation of the relationship between the observed overdispersion parameter k and the gametocyte density. The area of the circles is proportional to the inverse of the variance of k. The bars represent the 95% confidence interval for every value. Legend of dots; ‘S’: experiments from Senegal; ‘C’: experiments from Cameroon.
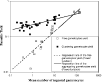
Fig. 4. Parasitic yields (zygotes/gametocytes ratio) obtained with the gametocytes circulating freely ([squf ]) and when the gametocytes are adherent (□). Every dot represents a simulation (100 mosquito bites on an infected person).
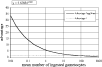
Fig. 5. Theoretical parasitic aggregation advantage=ratio of produced zygotes in case of clustering on produced zygotes in case of freedom.
 You have
Access
- 20
- Cited by