Mutation in the lysosome-associated membrane protein 2 gene is a rare X-linked dominant lysosomal disorder also known as Danon disease. Affected myocytes and skeletal muscles accumulate intracytoplasmic autophagic vacuoles, leading to severe and frequently fatal cardiac hypertrophy in children and young adults.Reference Maron, Roberts and Arad1 Early recognition of Danon cardiomyopathy is important for timing clinical interventions that may include defibrillator placement and heart transplantation. To our knowledge, cardiac magnetic resonance imaging in Danon cardiomyopathy has been reported by only one group of investigators, in two male patients.Reference Piotrowska-Kownacka, Kownacki and Kuch2 We performed cardiac magnetic resonance imaging in a male and a female patient with Danon cardiomyopathy and describe an unusual pattern of late gadolinium enhancement, which differs from that seen in patients with idiopathic hypertrophic cardiomyopathy.
Patient 1
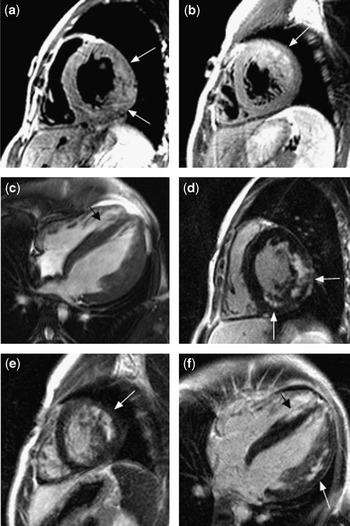
We chose a 16-year-old male patient who was identified as having cardiac hypertrophy with Wolff–Parkinson–White syndrome, which was successfully ablated at 6 years of age. At 14 years of age, he developed proximal muscle weakness and a cognitive deficit. A skeletal muscle biopsy was consistent with Danon disease, which was subsequently confirmed by genetic testing showing a nonsense mutation in the lysosome-associated membrane protein 2 gene (Arg293Ter). Cardiac magnetic resonance imaging was performed to quantitate ventricular hypertrophy, cardiac function, and late gadolinium enhancement as a potential indicator of arrhythmogenic foci (Fig 1).Reference Adabag, Maron and Appelbaum3 Scanning was performed on a Siemens Sonata 1.5T system (Siemens Medical Solutions, Malvern, Pennsylvania, United States of America). Post-contrast images were obtained after 0.2 millimole per kilogram Multihance intravenous injection (Bracco Diagnostics, Princeton, New Jersey, United States of America). The patient later had an automatic implantable cardioverter-defibrillator placed subsequent to episodes of ventricular tachycardia.
A 16-year-old male with LAMP2 hypertrophic cardiomyopathy. (a, b) Two mid-ventricular short-axis views obtained with T2 weighting show subtle lateral wall hyperintensity (a) and pronounced anterolateral wall hyperintensity (b) (arrows). (c) Four-chamber image from pre-contrast cine acquisition demonstrates hypertrophy with relatively spared apical septum (black arrow). LV mass measured 289 grams (177 grams per metre square). (d, e) Mid-ventricular short-axis views in the same positions as (a) and (b), obtained after contrast injection. Patchy LGE is demonstrated in the inferior RV insertion point and posterolateral wall (d) and anterolateral wall (e), similar to the distribution of signal on the T2-weighted images. The septum between the RV insertion points does not demonstrate LGE. (f) Four-chamber image in the same position as (c) obtained after contrast injection. Patchy lateral wall LGE is present (white arrow), but the septum does not demonstrate LGE. The relatively higher signal intensity from the apical septum (black arrow) corresponds to blood pool, as seen in (c).

Patient 2
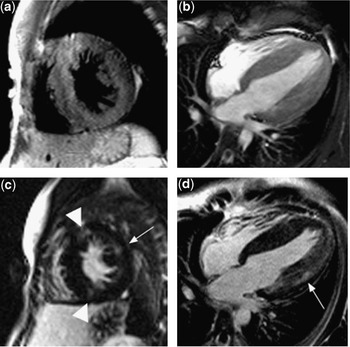
We chose a 14-year-old female patient who presented at 12 years of age with a near-syncopal episode and a history of intermittent palpitations and shortness of breath. Her electrocardiogram showed Wolff–Parkinson–White syndrome and severe biventricular hypertrophy. Cardiac magnetic resonance imaging evaluation was performed as described above (Fig 2). An automatic implantable cardioverter-defibrillator was placed due to persistent ventricular tachycardia. Genetic testing showed a missense mutation in the lysosome-associated membrane protein 2 gene (Thr194fr).
A 14-year-old female with LAMP2 hypertrophic cardiomyopathy. (a) Mid-ventricular short-axis view obtained with T2 weighting does not demonstrate appreciably increased signal intensity. (b) Four-chamber image from pre-contrast cine acquisition demonstrates symmetric hypertrophy. LV mass measured 216 grams (152 grams per square metre). (c) Mid-ventricular short-axis view in the same position as (a) demonstrates mild LGE in the lateral wall (arrow) and superior and inferior RV insertion points (arrowheads), but not in the septum. (d) Four-chamber image in the same position as (b) obtained after contrast injection. Patchy lateral wall LGE is present. RV = right ventricular; LV = left ventricular; LGE = late gadolinium enhancement.

Discussion
Hypertrophic cardiomyopathy is a genetically diverse disorder affecting the hearts of both children and adults. In children, hypertrophic cardiomyopathy is classified according to the aetiology as primary – familial or idiopathic – or secondary – associated with inborn error of metabolism, neuro-muscular disorder, or malformation syndrome. Inappropriate ventricular hypertrophy is the key phenotypic feature of the disease. Danon cardiomyopathy mimics idiopathic hypertrophic cardiomyopathy and is commonly associated with the Wolff–Parkinson–White syndrome. Unlike idiopathic hypertrophic cardiomyopathy that is rarely fatal in children over 1 year of age, Danon cardiomyopathy has an early mortality related to sudden death or cardiac failure, which may occur as early as in the second decade of life.Reference Maron, Roberts and Arad1
Cardiac magnetic resonance is increasingly utilised to characterise cardiomyopathy of both ischaemic and non-ischaemic aetiology. In patients with hypertrophic cardiomyopathy, late gadolinium enhancement affects the most hypertrophied regions of the myocardium, as a patchy midwall enhancement particularly in the septum and near the attachments of the right ventricle.Reference Choudhury, Mahrholdt and Wagner4 Enhancement is presumed to occur due to the cardiac fibrosis present in this condition. The degree of late gadolinium enhancement in hypertrophic cardiomyopathy may correspond to the risk of arrhythmias.Reference Adabag, Maron and Appelbaum3 In our two patients and in the two published cases of Danon disease, late gadolinium enhancement was present in the anterior, lateral, and/or posterior walls, and one or both right ventricular junctional points.Reference Piotrowska-Kownacka, Kownacki and Kuch2 In all four cases, the septum between the right ventricular insertion points was free of enhancement, unlike most cases of hypertrophic cardiomyopathy.Reference Choudhury, Mahrholdt and Wagner4 The intensity of late gadolinium enhancement was greater for the first patient than the second patient we describe. In addition, the presence of high T2 signal in our first patient suggests oedema or inflammation, and an active rather than healed process. The milder imaging features in our second patient may reflect a more attenuated expression or later onset of the disease in this female patient; we were unable to find any cardiac magnetic resonance images in a female patient with Danon cardiomyopathy.
In patients with Danon cardiomyopathy, hypertrophy is relatively concentric; however, late gadolinium enhancement does not distribute uniformly. The pattern of enhancement in Danon cardiomyopathy is also unlike that of other non-ischaemic cardiac diseases such as amyloidosis, sarcoidosis, and myocarditis. The mechanisms causing late gadolinium enhancement in Danon cardiomyopathy and the predictive value of late gadolinium enhancement in Danon cardiomyopathy for arrhythmias are unknown. We propose that patients with hypertrophic cardiomyopathy and cardiac magnetic resonance imaging showing patchy late gadolinium enhancement in the left ventricle with septal sparing should undergo genetic testing for lysosome-associated membrane protein 2 gene mutations.