Implications
Genomic estimated breeding values (GEBV) were derived on the basis of selected subsets of markers from the Illumina BovineSNP50 BeadChip. Single nucleotide polymorphisms (SNPs) were selected based on the effects of each marker on the bulls’ genetic evaluations in 2012 and 2008, respectively. The difference between the correlation of GEBV and current EBV and the correlation of the parent average and current EBV was >0.25 for all traits if SNPs were selected based on the 2012 evaluations, but not if SNPs were selected based on 2008 evaluations. Other methods of selection of SNPs may significantly improve genetic evaluations for moderately sized populations.
Introduction
In all of the large commercial dairy cattle populations, thousands of bulls with genetic evaluations based on progeny tests have already been genotyped for the Illumina BovineSNP50 BeadChip. More than 70 000 US Holstein bulls have been genotyped to date (https://www.cdcb.us/Genotype/cur_freq.html). Beginning in 2008, a large number of studies have proposed methods for genomic evaluations in dairy cattle. Most studies have used variations of the method of VanRaden (Reference VanRaden2008) in which the dependent variable is either the bulls’ daughter–yield deviations or deregressed estimated breeding values (EBV), and the independent variables are the genotypes of all valid single nucleotide polymorphisms (SNPs). Genomic estimated breeding values (GEBV) are then derived as an index of the sum of SNP effects, the parent average (PA) EBV and other factors. In nearly all cases, GEBV were evaluated by assigning the population of sires with genotypes and EBV based on progeny tests into a ‘training set’, consisting generally of older bulls, and a ‘validation set’ of younger bulls. The effects of the SNP and the regression coefficients for the final index are derived from the training set, and these values are then used to derive GEBV for the validation set, based on PA and genotypes. The GEBV of the validation bulls are then compared with their current deregressed EBV.
Coefficients of determination for the GEBV in the training set are nearly always much higher than coefficients of determination for current EBV in the validation set, especially if bulls are assigned to the two groups on the basis of birth dates. This may be partially because of the higher mean reliabilities of the EBV in the training set. An additional explanation is that linkage relationships and the segregating quantitative trait loci change over time (Moser et al., Reference Moser, Tier, Crump, Khatkar and Raadsma2009; Weller et al., Reference Weller, Ron, Glick, Shirak, Zeron, Misztal and Ezra2011). Thus, marker effects derived from the analysis of older bulls may not accurately reflect the marker effects of younger bulls. Glick et al. (Reference Glick, Shirak, Uliel, Zeron, Ezra, Seroussi, Ron and Weller2012) found that of the15 485 haplotypes with population frequencies between 5% and 95% in the population of Israeli Holstein bulls born since 1984, 930 haplotypes (6%) underwent significant changes in allelic frequencies, resulting in frequencies of either <10% or >90% for the bulls born between 2004 and 2008.
Various studies have proposed computation of GEBV based on subsets of SNPs. Four basic strategies have been proposed to select SNPs: random selection (Vazquez et al., Reference Vazquez, Rosa, Weigel, de los Campos, Gianola and Allison2010); equally spaced SNPs throughout the genome (Habier et al., Reference Habier, Fernando and Dekkers2009; VanRaden et al., Reference VanRaden, Van Tassell, Wiggans, Sonstegard, Schnabel, Taylor and Schenkel2009; Weigel et al., Reference Weigel, de los Campos, Gonzalez-Recio, Naya, Wu, Long, Rosa and Gianola2009; Moser et al., Reference Moser, Khatkar, Hayes and Raadsma2010; Vazquez et al., Reference Vazquez, Rosa, Weigel, de los Campos, Gianola and Allison2010; Zhang et al., Reference Zhang, Ding, Liu, Zhang and de Koning2011); selection of SNPs with the greatest effects on the trait analyzed, as estimated from the analysis of all markers in the training set (Weigel et al., 2009; Moser et al., Reference Moser, Khatkar, Hayes and Raadsma2010; Vazquez et al., Reference Vazquez, Rosa, Weigel, de los Campos, Gianola and Allison2010; Zhang et al., Reference Zhang, Ding, Liu, Zhang and de Koning2011) and selection of markers based on principal component analysis (Pintus et al., Reference Pintus, Gaspa, Nicolazzi, Vicario, Rossoni, Ajmone-Marsan, Nardone, Dimauro and Macciotta2012). Although accuracies nearly equal to analysis with all markers were obtained with subsets of markers, the accuracy of GEBV computed from subsets of markers was never significantly more than the accuracy of GEBV computed from the analysis of all markers. Daetwyler et al. (Reference Daetwyler, Villanueva and Woolliams2008) derived an equation for the expected accuracy of the prediction of the additive genetic value of an individual that can be achieved based on the number of phenotypes recorded and the number of loci affecting the trait of interest.
Unlike the effect of increasing the number of markers, which reaches a plateau for several thousand (VanRaden et al., Reference VanRaden, Van Tassell, Wiggans, Sonstegard, Schnabel, Taylor and Schenkel2009), increasing the number of bulls analyzed results in more accurate GEBV over the entire range tested to date (VanRaden et al., Reference VanRaden, Van Tassell, Wiggans, Sonstegard, Schnabel, Taylor and Schenkel2009; Calus, Reference Calus2010). Thus, the major European countries have formed a consortium that uses training bulls from all participating countries to calculate separate within-country evaluations. Similarly, a North American consortium has been established including the United States, Canada and other countries (Wiggans et al., Reference Wiggans, VanRaden and Cooper2011). Accuracies of GEBV in populations of <1000 genotyped bulls are generally as low as PA derived from traditional evaluations based only on pedigrees and trait phenotypes (VanRaden et al., Reference VanRaden, Van Tassell, Wiggans, Sonstegard, Schnabel, Taylor and Schenkel2009; Van Grevenhof et al., Reference Van Grevenhof, Van Arendonk and Bijma2012). Bayesian ‘shrinkage’ of marker effects improves accuracy of GEBV at best marginally. This is also the case for ‘Bayes-B’ methodologies, which assume that the majority of markers have no effect on the trait analyzed.
In the current study, we report on four new methods for the selection of markers for inclusion in analysis, and demonstrate that the accuracy of GEBV based on selected sets of markers can be significantly greater than GEBV based on all valid markers. Furthermore, nearly unbiased GEBV can be derived. We also demonstrate that GEBV with higher accuracy than PA can be derived, even though the training set includes <1000 bulls.
Material and methods
The data set and traits analyzed
All valid records from the Israeli Holstein population from January 1985 through May 2012 were included in the analysis to compute EBV. The complete data set was divided into: a ‘training set’, records generated before June 2008; and the ‘validation set’, records generated from June 2008. The difference of 4 years between validation set and the complete data set was chosen to mimic the actual dairy situation in that young bulls reach sexual maturity at the age of 1 year, and obtain their first EBV based on daughter records at ~5 years.
Eight traits were analyzed: milk fat, protein production, somatic cell score (SCS), female fertility, persistency of milk production, herd life and PD11, the current Israeli breeding index. EBV were computed for the complete data set, EBV12, and the truncated data set including only records generated before June 2008, EBV08. EBV were derived from multi-trait animal models for milk, fat, protein, SCS, female fertility and persistency, with each parity considered a separate trait, as described by Weller and Ezra (Reference Weller and Ezra2004) and Weller et al. (Reference Weller, Ezra and Leitner2006). Parities 1 to 5 were included in the analyses. Female fertility was computed as the inverse of the number of inseminations to conception (Weller and Ezra, Reference Weller and Ezra1997). Single-trait animal-model EBV were computed for herd life as described (Settar and Weller, Reference Settar and Weller1999).
Modified daughter-yield-deviations (MDYD), weighted means of daughter records corrected for herd-year-season and parity effects were computed for the bulls of the training set using records generated before June 2008 (MDYD08), and for the validation bulls using all records generated up to May 2012 (MDYD12). MDYDs were computed according to the following equation:
 $$MDYD_{i} =\mathop{\sum}\limits_1^J {\left( {{{\mathop{\sum}\limits_1^K {\left( {y_{{ijkl}} \,{\minus}\,HYS_{l} {\minus}P_{k} } \right)} } \over {K_{j} {\plus}\lambda }}} \right)} {\rm /}\mathop{\sum}\limits_1^J {\left( {K_{j} {\plus}\lambda } \right)} $$
where MDYD i is the MDYD for bull i, y ijkl is the record of daughter j of bull i in parity k generated in herd-year-season l, HYS l is the effect of herd-year-season l, P k is the effect of parity k, K j is the number of records (parities) for cow j and λ is the ratio of residual variance to within cow variance. (All variances not included in the cow effects are considered residual variances.) Unlike daughter-yield-deviations computed by VanRaden and Wiggans (Reference VanRaden and Wiggans1991), MDYDs were not corrected for the genetic effects of the cows’ dams. This is because for a large fraction of cows the dam records were not included in the database. Inclusion of dam evaluations with some based on records and some based only on relatives’ EBV (including their daughters) could be a potential source of bias.
For milk production traits λ=1. For SCS and persistency λ=4, and for fertility λ=10. Values for λ were derived by the MTC REML program of I. Misztal. The Israeli Holstein population was analyzed for each trait by a repeatability model (e.g. Weller and Ezra, Reference Weller and Ezra2004). For herd life, there was only a single record per cow, and therefore no parity effect. K j +λ was replaced with unity. Herd-year-season and parity effects were derived from the standard multi-trait animal model analyses for all traits with multiple parities, and HYS effects for herd life were derived from the standard analysis of this trait.
MDYD for production traits were computed only for bulls with at least 20 effective daughters. For secondary traits, the minimum number of effective daughters was five for SCS and persistency, two for fertility and one valid daughter for herd life. Criteria for acceptance were less restrictive for the secondary traits, because these traits had fewer records for the older bulls.
Animals genotyped and validation of SNPs
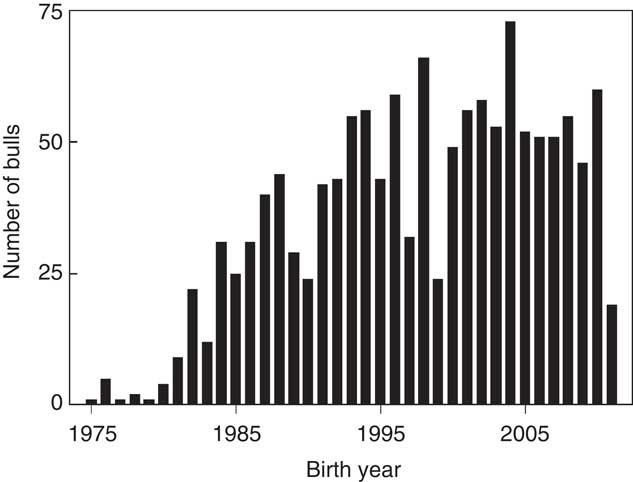
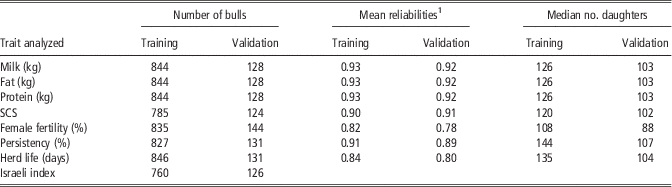
A total of 1359 bulls and calves were genotyped: 912 bulls for the 54 001 SNP BeadChip, and 447 for the 54 609 SNP BovineSNP50 v2 BeadChip. The numbers of bulls genotyped by birth year are given in Figure 1. Birth years ranged from 1975 through 2011. The numbers of bulls with genotypes and MDYD in the training and validation data sets and the mean reliabilities of the EBV and median number of daughters by trait are given in Table 1. Reliabilities were estimated by the algorithm of Misztal and Wiggans (Reference Misztal and Wiggans1988), as corrected by Misztal et al. (Reference Misztal, Lawlor, Short and Wiggans1991). Reliabilities for the training bulls are given for the June 2008 evaluation, and for the validation bulls for the May 2012 evaluation. As expected, mean reliabilities were highest for the production traits and lowest for fertility. Mean reliabilities of the validation and training bulls were very similar, but refer to a difference of 4 years. Median numbers of daughters are given instead of mean number of daughters, because some bulls that were returned to general service had thousands of daughters. Of the 128 bulls in the validation set, 31 were half-brothers of sires in the training set. In addition, 110 of the validation bulls were sons of the training bulls.
Numbers of bulls with genotypes by birth year.

The number of bulls with genotypes and MDYD in the training and validation data sets, and their mean reliabilities and median number of daughters by trait

MDYD=modified daughter-yield-deviations; SCS=somatic cell score.
1 Reliabilities and numbers of daughters for the training bulls are given for the June 2008 evaluation, and for the validation bulls for the May 2012 evaluation.
SNPs were deleted from the analysis if: they did not appear on the original Beadchip, the frequency of the less frequent allele <0.05, there were valid genotypes for less than half of the animals genotyped or if the genotypes of consecutive SNPs were identical for more than 95% of the animals with valid genotypes. For several identical SNPs all were deleted, except for the first. After edits there were 39 302 valid SNPs.
Calculations of genomic evaluations and selection of SNPs
The method of VanRaden (Reference VanRaden2008) was used to compute genomic effects on the MDYD from the training set for each trait. The model used was as follows:
 $${\bf y}=\mu {\plus}{\bf Za}{\plus}{\bf e}$$
where y is the vector of MDYD08, μ is the mean, Z is the incidence matrix that relates y with the genomic effects in the vector a and e is the random residual term. The relationship matrix based on marker information, G, was constructed as in VanRaden (Reference VanRaden2008):
 $${\bf G}={{({\bf M}\,{\minus}\,{\bf P})({\bf M}\,{\minus}\,{\bf P})^{{\rm '}} } \over {{\rm 2}\sum_{j\,=\,{\rm 1}}^n p_{j} ({\rm 1}\,{\minus}\,p_{j} )}}$$
where M is a matrix of SNP genotypes for each animal, and P is a matrix of two times the difference between the frequency of the second allele p at locus j and 0.5. Dimensions of M and P are the number of individuals by the number of markers. Elements of M are set to −1, 0 and 1 for the homozygote, heterozygote and other homozygote. For missing genotypes the element of M was assumed to be equal to the corresponding element of P. As in VanRaden (Reference VanRaden2008), allelic frequencies for each SNP were computed from the sample of ‘founder’ bulls in the training population. That is, bulls without genotyped ancestors. The diagonals of G were augmented by
 ${\rm 2}\mathop{\sum}{p_{i} \left( {{\rm 1}{\minus}p_{i} } \right)} $
, under the prior assumptions that all markers included in the analysis account for all the variances among MDYD, and the effects of all markers are equal. Direct genomic evaluations (DGE) were then computed as:
 $${\bf Z{ \; \,\vskip -2.5pt\hat \hskip -4.4pt}{a}}$$
, where
 ${\bf { \; \,\vskip -2.3pt\hat \hskip -4.5pt}{a}}$
is the vector of solutions for a.
Similar to VanRaden et al. (Reference VanRaden, Van Tassell, Wiggans, Sonstegard, Schnabel, Taylor and Schenkel2009), final GEBV were computed from an index including the direct genomic effects and PA. The regression coefficients for the index were derived from the training data set, using the following equation:
 $${\rm EBV}_{{{\rm 12}}} ={\rm int}{\plus}a{\times}{\rm DGE}{\plus}b{\times}{\rm PA}{\plus}e$$
where int is the y-intercept, a and b are regression constants, and the other terms are as defined previously. DGE and PA were computed from the truncated data set including only records generated before June 2008. PA were computed as the means of the parent EBV derived from the standard multi-trait analysis of the population. All bulls in the training set with genotypes, MDYD08 and EBV08, for dams based on at least one lactation record were included in the analysis.
The regression coefficients derived from the training set were then used to compute GEBV for the validation bulls by the same equation, with PA for the validation bulls also computed based only on records generated before June 2008. The GEBV of the validation bulls and their genetic merit estimates based on the PA were compared with their EBV12 and MDYD12. Correlations of the GEBV of the validation bulls with their EBV12 were compared with the correlations of their PA with their EBV12. As the PA has a major effect on EBV of low heritability traits, even with more than 50 daughters, correlations of GEBV and PA with MDYD12 were also computed. In addition, to estimate the bias of PA and GEBV, relative to the EBV12, regressions of PA and GEBV on EBV12 were computed, and means and standard deviations of PA, GEBV and EBV12 were compared.
Four methods were used to select subsets of SNPs for analysis. These methods were applied to all eight traits listed in Table 1. In the first method, ‘EFF12’, SNPs were selected for each trait based on the fixed additive effect of each marker on the bulls’ EBV12 for each trait, as derived by the analysis of all valid SNPs by the ‘EMMAX’ algorithm (Kang et al., Reference Kang, Sul, Service, Zaitlen, Kong, Freimer, Sabatti and Eskin2010). The additive effect was computed as the regression of the bulls’ EBV12 on the number of ‘+’ alleles of the SNP. Determination of the ‘+’ allele was arbitrary. This algorithm corrects for relationships among animals by calculating an empirical relationship matrix based on SNP genotypes. The SNPs with the greatest absolute effects were retained for the computation of GEBV. It should be noted that this method uses information available only after May 2008 to select the SNPs included for analysis. However, once the sample of SNPs is selected, GEBV are computed as described above based only on records generated before June 2008. The second method, ‘EFF08’, was the same as EFF12, except that the dependent variables in the ‘EMMAX’ analysis were the bulls’ EBV08. Thus, only records available in May 2008 were used to select the SNPs and to compute GEBV.
In the third method, ‘DIFmax’, SNPs were selected in two stages. In the first stage, SNPs with minor allele frequencies >0.05 and at least 200 valid genotypes among the training bulls population were retained. Of the 39 302 valid SNPs, 30 288 met these additional criteria. In the second stage, these SNPs were ranked by the absolute difference in allelic frequencies between the training and validation bulls from largest to smallest. In the preliminary analysis, the 1000 SNPs with the greatest absolute differences were selected for inclusion. The number of SNPs included was then increased by increments of 500 up to 2000, or until a decrease of >2% in the correlation of the GEBV of the validation bulls with their EBV12 was obtained. In each additional run, the 500 SNPs with the next greatest allelic differences were added to the previous sample of SNPs. If a decrease of 2% in the correlation was not obtained with 2000 SNPs, then the number of SNPs included was increased by increments of 1000 up to 6000. If a 2% reduction in the correlation was obtained with 1500 SNPs, relative to 1000 SNPs, then the number of SNPs included was decreased by increments of 100 until a 2% decrease in the correlation was obtained. Again, the SNPs with the greatest allelic differences among those included in the previous run were retained.
As a negative control, DGE and GEBV were also computed with the SNPs with the smallest absolute difference in allelic frequencies between the training and validation bulls among the SNPs with minor allele frequencies >0.05 and at least 200 valid genotypes among the training bulls. This method was denoted ‘DIFmin’. For each trait, the number of SNPs included in DIFmin was the number that resulted in the highest correlation between the GEBV of the validation bulls with their EBV12 for DIFmax.
In comparison with these four methods, GEBV were also computed for all traits using all 39 816 valid markers and using each 20th valid SNP (1991 SNPs).
Results and discussion
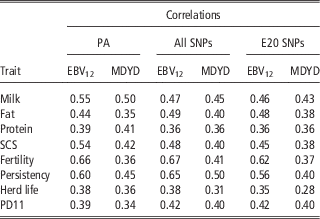
Correlations of GEBV and PA for the validation bulls with EBV12 and MDYD12 from the analysis of all SNPs and equally spaced SNPs are given in Table 2. With all valid SNPs, correlations of GEBV with EBV12 and MDYD12 were slightly higher than PA for fat, fertility, persistency and PD11, but lower for the other traits. Differences between GEBV computed with all SNPs and each 20th SNP were minimal, except for fertility and persistency, for which analysis with all SNPs was superior.
Correlations of GEBV and PA with June 2012 EBV12 and MDYD from the analysis of all SNPs (All) and each 20th SNP (E20) for the validation bulls

GEBV=genomic estimated breeding values; PA=parent averages; EBV=estimated breeding values; MDYD=modified daughter-yield-deviations; SNP=single nucleotide polymorphism; SCS=somatic cell score.
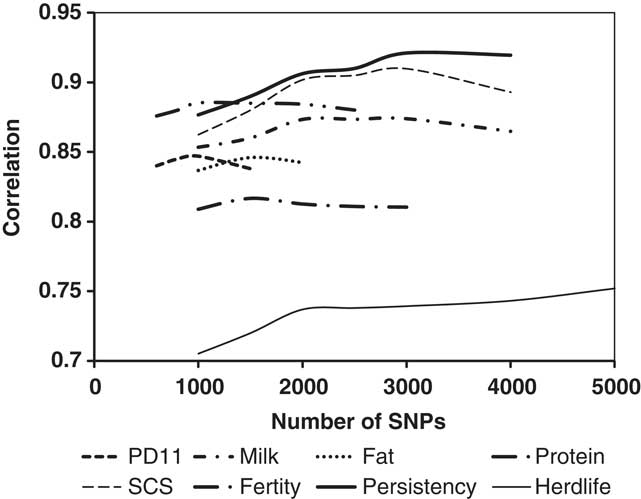
The correlations between the GEBV-based EFF12 and EBV12 as a function of the number of SNPs included in the analysis for the validation bulls are plotted in Figure 2. There was a clear optimum for all the traits, except for herd life. The optimum number of markers was between 600 and 6000 for all of the traits analyzed.
Correlations between genomic estimated breeding values derived by EFF12 and June 2012 estimated breeding values for the validation bulls as a function of the numbers of SNPs included in the analysis.

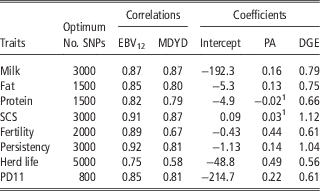
Correlations of EFF12 GEBV and PA with EBV12 and MDYD12 with optimum number of SNPs, and coefficients applied to derive GEBV from PA and DGE, are given in Table 3. The intercepts were negative for all traits, except for SCS. Coefficients for DGE were greater than coefficients for PA for all traits, but coefficients for PA were still significant (P<0.05) for all traits, except for protein and SCS. The correlations of GEBV with EBV12 and MDYD12 were higher than the correlations of PA with EBV and MDYD12 for all traits, and ranged from 0.75 for herd life to 0.92 for persistency. Correlations of this magnitude are generally obtained only for much larger populations (e.g. VanRaden et al., Reference VanRaden, Van Tassell, Wiggans, Sonstegard, Schnabel, Taylor and Schenkel2009). The mean difference in the correlations between GEBV and PA was 0.36. Differences in correlations between PA and GEBV with EBV12 and MDYD12 were similar for all traits. The greatest differences in correlations were obtained for PD11 for both EBV12 and MDYD12, close to 0.45.
Correlations of GEBV derived by EFF12 and MDYD with optimum number of SNPs for the validation bulls, and coefficients applied to derive GEBV from PA and DGE

GEBV=genomic estimated breeding value; MDYD=modified daughter-yield-deviation; SNP=single nucleotide polymorphism; PA=parent averages; DGE=direct genomic evaluations; EBV=estimated breeding value; SCS=somatic cell score.
1 Not significant at P<0.05. All other coefficients were significant.
According to quantitative genetic theory, the PA should explain no more than 50% of the genetic variance in the progeny, for a maximum correlation of 0.71 (Lynch and Walsh, Reference Lynch and Walsh1998). However, the EBV12 for the validation bulls are based on relatively low numbers of records. In this case, the parent contribution to the EBV is significant, especially for low heritability traits. Therefore, correlations between GEBV and EBV12 were higher for fertility and persistency, which have low heritability, whereas correlations of GEBV and PA with MDYD12 were lower. All correlations were lower for herd life, which has only one record per cow. For protein, the correlations of EBV12 with GEBV and PA were 0.82 and 0.42. Although selection of SNPs was based on information not available in May 2008, the effects derived from these subsets of SNPs were based entirely on information available in 2008.
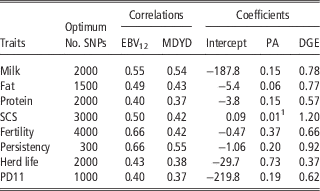
In EFF12, the SNPs were selected based on their 2012 EBV. In EFF08 SNPs were selected by the same procedure, but the dependent variables were the 2008 EBV. Thus, this method only used information available in May 2008. Correlations of the GEBV-based EFF08 with EBV12 and MDYD12, and coefficients applied to derive GEBV from PA and DGE, are given in Table 4. Similar to EFF12, the intercepts were negative for all traits, except for SCS, and coefficients for DGE were greater than coefficients for PA for all traits, except for herd life. Coefficients for PA were significant (P<0.05) for all traits, except for SCS. The EFF08 correlations were significantly lower than the EFF12 correlations for all traits for both EBV12 and MDYD12. Correlations of EFF08 GEBV with EBV12 were similar to the PA correlations for all traits. Correlations of GEBV with MDYD12 were higher or equal to the correlations of PA with MDYD12 for all traits, but by relatively small margins. In the analysis of the validation set, the PA values were highly correlated with the sum of the SNP effects. Thus, both the genetic marker effects and PA were largely determined by the same QTL segregating in the population of training bulls. However, as noted previously (Glick et al., Reference Glick, Shirak, Uliel, Zeron, Ezra, Seroussi, Ron and Weller2012), the QTL segregating at intermediate frequencies in the validation bulls are not the same as those segregating in the training population. Thus, we conclude that to improve GEBV, it is necessary to include markers linked to QTL that are not segregating at intermediate frequencies in the training set.
Correlations of GEBV derived by EFF08 with June 2012 EBV12 and MDYD with optimum number of SNPs for the validation bulls, and coefficients applied to derive GEBV from PA and DGE

GEBV=genomic estimated breeding value; EBV=estimated breeding value; MDYD=modified daughter-yield-deviation; SNP=single nucleotide polymorphism; PA=parent averages; DGE=direct genomic evaluations; SCS=somatic cell score.
1 Not significant at P<0.05. All other coefficients were significant.
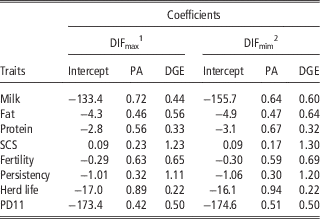
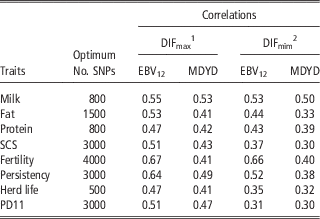
The mean difference in the SNP allelic frequencies was 0.043, and the maximum difference was 0.27. Five percent of the SNPs (1514) had differences >0.11. Coefficients for factors included in the models used to compute GEBV for DIFmax and DIFmin are given in Table 5, and correlations of GEBV computed by DIFmax and DIFmin with EBV12 and MDYD12 with optimum number of SNPs for DIFmax are given in Table 6. Generally, the coefficients were similar for DIFmax and DIFmin. Intercepts were similar to those for EFF12 and EFF08, but coefficients for PA were generally larger than the corresponding coefficients for EFF12 and EFF08, and larger than the DIFmax and DIFmin coefficients for DGE for milk, protein and herd life.
Coefficients applied to derive GEBV from PA and DGE for DIFmax and DIFmin

GEBV=genomic estimated breeding value; PA=parent averages; DGE=direct genomic evaluations; SCS=somatic cell score.
1 Single nucleotide polymorphisms (SNPs) selected by maximum difference in allelic frequencies between training and validation bulls.
2 SNPs selected by minimum difference in allelic frequencies between training and validation bulls.
Correlations of GEBV derived by DIFmax and DIFmin with June 2012 EBV12 and MDYD with optimum number of SNPs for the validation bulls

GEBV=genomic estimated breeding value; EBV=estimated breeding value; MDYD=modified daughter-yield-deviation; SNP=single nucleotide polymorphism; SCS=somatic cell score.
1 SNPs selected by maximum difference in allelic frequencies between training and validation bulls.
2 SNPs selected by minimum difference in allelic frequencies between training and validation bulls.
The correlations of the GEBV with EBV12 were higher with DIFmax than with the analysis of all SNPs for all traits, except for fertility and persistency. Furthermore, the correlations of the GEBV with EBV12 were higher with DIFmax than EFF08 for all traits, except for milk production and persistency. Correlations for both GEBV and MDYD12 for PD11 were ~0.1 greater for DIFmax, as compared with EFF08. Correlations for DIFmax were greater than correlations for DIFmin for all traits, although differences were minimal for milk and fertility. DIFmax is expected to be more effective for traits that underwent strong recent selection, such as the breeding index and protein production. Milk is not included in PD11, and genetic trend for fertility in Israel over the last decade has been minimal (Glick et al., Reference Glick, Shirak, Uliel, Zeron, Ezra, Seroussi, Ron and Weller2012). Both DIFmax and DIFmin used only information available in June 2008. Of course, differences in allelic frequencies are not necessarily the result of selection, and may be caused by random drift, the ‘hitchhiker effect’ or other factors.
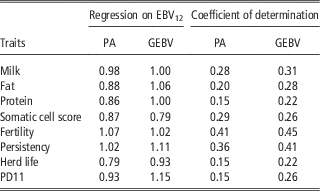
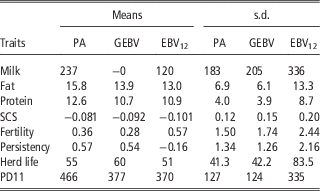
Genetic evaluations are unbiased if the means are equal to the means of the true genetic values and the regressions of EBV on true genetic values are equal to unity. As true genetic values are unknown, GEBV and PA were compared with EBV12. Regressions and coefficients of determination of PA and DIFmax GEBV on EBV12 are presented in Table 7, and means and standard deviations of PA, DIFmax GEBV and EBV12 are given in Table 8. Standard errors of the regressions were ~0.1. GEBV regressions were generally higher than the PA regressions. Exceptions were SCS and fertility, but the regressions for fertility were very close to unity for both methods. GEBV regressions were close to unity for all traits, except for SCS. Thus, by this criterion, the GEBV can be considered virtually unbiased for all traits, except for SCS. With respect to means, GEBV were less biased than PA for all traits, except for fertility and herd life. Coefficients of determination for GEBV were higher than for PA for all traits, except for SCS.
Regressions and coefficients of the determination of PA and GEBV derived by DIFmax on June 2012 EBV12 for the validation bulls

PA=parent averages; GEBV=genomic estimated breeding value; EBV=estimated breeding value.
Means and standard deviations of PA, GEBV derived by DIFmax and June 2012 EBV12 for the validation bulls

PA=parent averages; GEBV=genomic estimated breeding value; EBV=estimated breeding value; SCS=somatic cell score.
Although numerous studies have computed GEBV derived from the subsets of markers (Habier et al., Reference Habier, Fernando and Dekkers2009; VanRaden et al., Reference VanRaden, Van Tassell, Wiggans, Sonstegard, Schnabel, Taylor and Schenkel2009; Weigel et al., Reference Weigel, de los Campos, Gonzalez-Recio, Naya, Wu, Long, Rosa and Gianola2009; Moser et al., Reference Moser, Khatkar, Hayes and Raadsma2010; Vazquez et al., Reference Vazquez, Rosa, Weigel, de los Campos, Gianola and Allison2010; Zhang et al., Reference Zhang, Ding, Liu, Zhang and de Koning2011), this is the first study to show that more accurate GEBV can be derived from the analysis of subsets of markers, as compared with the analysis of all valid markers. This is not too surprising considering that the methodologies used to select markers in this study differed from all previous studies. In the previous studies that selected markers based on their effects, the effects were derived from the genomic analysis of all markers, with marker effects regressed in proportion to the fraction of genetic variance assumed to be associated with each marker. This results in strongly underestimated effects relative to the actual QTL effects.
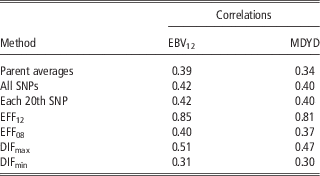
The correlations of GEBV derived by all methods with EBV12 and MDYD for PD11 are summarized in Table 9. Although EFF12 is clearly superior to all other methods, DIFmax, which includes only information available in 2008, is clearly the next best. As noted first by Moser et al. (Reference Moser, Tier, Crump, Khatkar and Raadsma2009), a major weakness in the application of genomic evaluation is that different genes are likely to be segregating in old and young bulls. The four methods applied in this study shed additional light on this problem. EFF12, which selects markers based on their effects in both young and old bulls, clearly gives the best results, but in this method markers are selected on the basis of data not available in real time. EFF08, which selects markers based on their effects in the training bulls, is at best only marginally better than PA. This indicates that the QTL segregating in the older bulls are generally no longer segregating in the younger bulls. The rational for DIFmax, selection of a subset of SNPs based on difference in allelic frequencies between old and young bulls, originated from the finding of Glick et al. (Reference Glick, Shirak, Uliel, Zeron, Ezra, Seroussi, Ron and Weller2012) that allelic frequencies of markers in linkage disequilibrium to QTL under selection can change significantly over a single generation. This is also true for the causative mutation in ABCG2 underlying the QTL for production on BTA6 that showed a difference in the favorable allele frequency of 0.2 over two generations of selection (Cohen-Zinder et al., Reference Cohen-Zinder, Seroussi, Larkin, Loor, Everts-van der Wind, Lee, Drackley, Band, Hernandez, Shani, Lewin, Weller and Ron2005). Thus, these markers can be considered prime candidates for inclusion in genomic evaluation. Although EFF12 cannot be directly applied to actual data, the results of this method raise the possibility that other methods of selection of SNPs could significantly improve GEBV derived for moderately sized populations.
Comparison of correlations of GEBV derived by all methods with June 2012 EBV12 and MDYD for PD11

GEBV=genomic estimated breeding value; EBV=estimated breeding value; MDYD=modified daughter-yield-deviation; SNP=single nucleotide polymorphism.
One of the main reasons that GEBV are inaccurate for small populations is that most markers have no actual effects on the trait analyzed. However, the estimated effects, which consist nearly entirely of random error, overwhelm the effects associated with segregating QTL. This problem decreases as sample sizes increase, and prediction error variances decrease. Therefore, it is not too surprising that relatively high-accuracy GEBV can be derived for a population of the size of the Israeli Holsteins, if only markers with real effects are included in the analysis.
Daetwyler et al. (Reference Daetwyler, Villanueva and Woolliams2008) derived the following equation for the expected accuracy of the prediction of the additive genetic value (
 $r_{{\hat {g g}}}}$
) of an individual that can be achieved based on the measurement of n
P phenotypes, assuming that n
G potential loci affect the trait of interest:
 $$r_{{\hat {g g}}}} =\sqrt {{{\lambda h^{{\rm 2}} } \over {\lambda h^{{\rm 2}} {\plus}{\rm 1}}}} $$
where h 2 is the observed heritability and λ=n P/n G. In the current study, as the ‘phenotypes’ were genetic evaluations, the heritability is the mean reliability of the evaluations, which is close to 0.9. The actual number of loci effecting the trait is of course unknown, but for the accuracy of prediction to equal 0.75, requires λ=n P/n G=1.43. That is, the number of phenotypes should be approximately equal to 1.4 times the number of loci affecting the trait. As only about 800 individuals were included in the training population, n G should be approximately equal to 560. This number is lower than the optimal number of SNPs for most of the traits analyzed, but it is likely that in all cases SNPs were included that did not have effects on the traits analyzed.
Conclusions
GEBV derived from selected sets of markers can outperform GEBV derived from the analysis of all markers. GEBV derived from selected sets of markers can outperform PA, even if the training population includes <1000 bulls. Using the strategy that resulted in the greatest accuracy of evaluation, correlations of GEBV with EBV12 were 0.35 higher than correlations of PA with EBV12. However, this method uses information that is not available in real time. Even if the selection of markers is based only on information available at the time the training set is generated, it is still possible to select sets of markers that yield higher correlations between GEBV and EBV12 than correlations of PA with EBV12. Furthermore, GEBV were less biased than PA. This study raises the possibility that other methods of selection of SNPs could significantly improve GEBV derived for moderately sized populations.
Acknowledgments
This research was supported by grants from the Israel Dairy Board, the Chief Scientist of the Israeli Ministry of Agriculture and Rural Development and Binational Agricultural Research and Development Fund (BARD) Research Project IS-4394-11R. Genotyping was performed by A. Schein and N. Avidan, Pharmacogenetics and Translation Medicine Center, The Rappaport Institute for Research in the Medical Sciences, Technion, Haifa, Israel, and GeneSeek, Lincoln, NE, USA. The authors thank the reviewers for their suggestions, and I. Misztal for use of the MTC program.