Introduction
The Mediterranean corn borer, Sesamia nonagrioides (Lefèbvre) (Lepidoptera: Noctuidae), is an oligophagous insect on a narrow range of Graminae, and it is considered a major insect pest of maize Zea mays L. (Poaceae) in several countries of the Mediterranean basin. The distribution area of the species falls between the 45°N parallel and North-West Africa (Nucifora, Reference Nucifora1966; Stavrakis, Reference Stavrakis1967; Melamed-Madjar & Tam, Reference Melamed-Madjar and Tam1980; Galichet, Reference Galichet1982). It is a multivoltine species completing a variable number of generations per year, from two in southern France to up to four in Greece and Morocco (Anglade, Reference Anglade and Balachowsky1972; Tsitsipis, Reference Tsitsipis, Cavalloro and Sunderland1988). It overwinters as full grown diapausing larva and adults emerge from late March to May. Mated females lay egg masses between the leaf sheath and the stem and soon after hatching the larvae enter the stem and live as borers. They complete their development and pupate at the beginning of their tunnels. Later generations attack the ears feeding on corn grains or inside the spadix.
An important aspect of insect biology that should be taken into account in management programmes is the dispersal capacity. From a population dynamics point of view dispersal of females is the decisive factor because it is the females that lay the eggs. In ecological studies, two different methods measuring insect dispersal have been applied. The first relies on mark-and-recapture techniques (‘direct’ methods), which can provide information on the contemporary pattern of migration, but they have many practical difficulties and limitations. Also, ‘direct’ methods cannot estimate the contribution of emigrants to the local populations because migration is not always translated into successful colonization. ‘Indirect methods’ rely on allele frequencies, DNA sequences or restriction fragments length polymorphism and have been used extensively for the assessment of gene flow among populations of phytophagous insects (Peterson & Denno, Reference Peterson, Denno, Mopper and Strauss1998). The genetic markers can provide long-term indirect estimates, and this information can assist in understanding the dynamics of pest expansion (Roderick, Reference Roderick1996; Peterson & Denno, Reference Peterson, Denno, Mopper and Strauss1998).
The dispersal capacity of S. nonagrioides has not been well studied. Only studies based on ‘direct’ methods have dealt with this issue. Generally, S. nonagrioides is considered as a sedentary insect species and dispersal distances 100–400 m of adults emerged from maize fields have been recorded (Albajes et al., Reference Albajes, Eras, Lopez, Ferran, Vigata and Eizaguire2004; Eizaguirre et al., Reference Eizaguirre, Lopez and Albajes2004). Distant movements to colonize maize fields early in the season have been reported among adults emerging from overwintering individuals (Larue, Reference Larue1984). From a fundamental point of view, knowledge of the genetic diversity of insect pests may help in assessing their dispersal properties, fitness and persistence. Also, such information improves the monitoring of the pests and the success of future control programmes (Armstrong & Wratten, Reference Armstrong, Wratten, Symondson and Liddell1996). Until now, our knowledge on genetic variation at both inter- and intra-population levels in S. nonagrioides is limited. Buès et al. (Reference Buès, Eizaguirre, Toubon and Albages1996) based on allozyme analysis in western Mediterranean populations, reported heterogeneity among populations correlated with ecophysiological differences. Leniaud et al. (Reference Leniaud, Audiot, Bourguet, Frérot, Genestier, Fai Lee, Malausa, Le Pallec, Souqual and Ponsard2006) using the same method, detected a significant host-plant effect on the genetic structure of populations from France and Spain. Kourti (Reference Kourti2007) has also compared recently three populations from Greece and one from Spain, using DNA sequences of the mtDNA cytochrome oxidase I and II genes. Her study revealed two different haplotypes, and the analysis showed genetic differentiation between samples. Molecular markers have been applied extensively in other lepidopteran pest species to reveal information about hostplant adaptation, gene flow, population expansion and phylogeographic structuring (e.g. Nibouche et al., Reference Nibouche, Buès, Toubon and Poitout1998; Zhou et al., Reference Zhou, Faktor, Applebaum and Moshe2000; Salvato et al., Reference Salvato, Battisti, Concato, Masutti, Patarnello and Lorenzo2002; Martel et al., Reference Martel, Réjasse, Rousset, Bethenod and Bourguet2003; Scott et al., Reference Scott, Wilkinson, Merritt, Scott, Lange, Schutze, Kent, Merritt, Grundy and Gracham2003; Sezonlin et al., Reference Sezonlin, Dupas, Le Ru, Le Gall, Moyal, Calatayud, Giffard, Faure and Silvain2006).
The properties of mitochondrial DNA (mtDNA) compared to nuclear DNA, such as higher mutation rates, haploid mode (maternal) of inheritance and no recombination, make it a valuable tool for reconstructing the recent evolutionary history of populations and performing intraspecific phylogeographic analysis (Avise, Reference Avise1994, Reference Avise2000). Because of its mode of inheritance, mtDNA is sensitive to bottlenecks and to consequences of population subdivision (Wilson et al., Reference Wilson, Can, Carr, George, Gyllensten, Helm-Bychowski, Higuchi, Palumbi, Prager, Sage and Stoneking1985). Analysis of mtDNA has been used extensively in several studies inferring intraspecific genetic relationships and population structure in various insect species of different orders (e.g. Gasparich et al., Reference Gasparich, Silva, Han, McPheron, Steck and Sheppard1997; Taylor et al., Reference Taylor, Peterson, Szalanki and Petersen1997; Downie, Reference Downie2002; Salvato et al., Reference Salvato, Battisti, Concato, Masutti, Patarnello and Lorenzo2002; Perdikis et al., Reference Perdikis, Margaritopoulos, Stamatis, Mamuris, Lykouressis, Tsitsipis and Pekas2003; Snäll et al., Reference Snäll, Huoponen, Saloniemi, Savontaus and Ruohomäki2004; Vandewoestijne et al., Reference Vandewoestijne, Baguette, Brakefield and Saccherib2004; Sezonlin et al., Reference Sezonlin, Dupas, Le Ru, Le Gall, Moyal, Calatayud, Giffard, Faure and Silvain2006). In the present study, we examined variation in the 16S rRNA and partially COI genes of mtDNA among S. nonagrioides populations, using restriction fragment length polymorphism (RFLP) analysis. Briefly, RFLP-mtDNA markers are of low cost and can easily be applied in most laboratories. They are also single locus co-dominant markers and overcome the technical and analytical drawbacks of multilocus markers (AFLP, RAPDs) due to their dominant inheritance. RFLP-mtDNA analysis can reveal a greater amount of genetic polymorphism than allozymes, but they are less informative compared to sequence analysis and especially to mini- and microsatellite single locus markers (for reviews on the pros and cons of various markers available for molecular ecology see Loxdale & Lushai, Reference Loxdale and Lushai1998 and Sunnucks, Reference Sunnucks2000). In invertebrates the COI gene is the most slowly evolving gene of the protein encoding mitochondrial genes. The rRNA genes of mtDNA are considered more conservative than protein coding mitochondrial genes (Simon et al., Reference Simon, Frati, Beckenbach, Crespi, Liu and Flook1994). Furthermore, they have been shown to be useful for determining relationships at different taxonomic levels (Arnason et al., Reference Arnason, Gullberg and Widegren1991). Our particular aims were to explore the phylogenetic history of S. nonagrioides populations derived from the European part of the Mediterranean basin, including those from the northern limit of the distribution area of the species, and to obtain information about (i) the present level of genetic diversity within and between populations, and (ii) the level of gene flow among populations.
Materials and methods
Insect sampling and DNA isolation
Full grown larvae were collected from maize fields from various localities in Greece, Italy, France and Spain during the autumn of 2004. Particularly, nine populations were sampled; four from southern (37.3°N–39.2°N) and five from northern latitudes (40.6°N–43.4°N) (fig. 1). The larvae were preserved in absolute ethanol until DNA extraction. DNA was extracted form the head of each larva following the protocol described by Margaritopoulos et al. (Reference Margaritopoulos, Bacandritsos, Pekas, Stamatis, Mamuris and Tsitsipis2003).
Map showing sampling sites of Sesamia nonagrioides. 1, Toulouse (43.4°N); 2, Pontevedra (42.3°N); 3, Lleida (41.4°N); 4, Perugia (43.1°N); 5, Axioupoli (40.6°N); 6, Velestino (39.2°N); 7, Mornos (38.2°N); 8, Kilini (37.5°N) and 9, Tripoli (37.3°N).

Mitochondrial DNA analysis
Mitochondrial DNA variation in the nine populations surveyed was examined by RLFP performed on polymerase chain reaction (PCR) amplified products from 20 individuals per population. The primers 5′-CCGGTCTGAACTCAGATCACGT-3′ and 5′-CGCCTGTTTATCAAAAACAT-3′ (Palumbi et al., Reference Palumbi, Martin, Romano, McMillan, Stice and Grabowski1991) were used to amplify a ∼600 bp segment of the 16S rRNA mtDNA region. The primers 5′-CCGGGATTTGGAATAATCTC-3′ and 5′-CAGCTGGAGGAAGATTTTGA-3′ were constructed based on the GenBank Accession J829717 in order to amplify a ∼780 bp segment of the COI mtDNA gene.
DNA amplifications were performed in an Eppendorf (Mastercycler personal) thermocycler in 50 μl volumes containing 1.5 units of Taq polymerase (Minotech, Heraklion, Greece), 0.2 mm dNTPs, ∼100 ng of each primer, 2.5 mm MgCl2, 1X reaction buffer (500 mm KCl, 100 mm Tris-HCl, pH 9.0) supplied by the enzyme manufacturer and approximately 100 ng of DNA. Amplification conditions involved a preliminary denaturation at 95°C for 4 min, a total of 35 cycles of 40 s at 94°C, 40 s at 56°C (52°C for the COI fragment), and 40 s (1 min for the COI fragment) for at 72°C, followed by 10 min at 72°C. The amplified segments of both 16S rRNA and COI (20 individuals per population were examined) were screened for polymorphism with the following 15 restriction endonucleases: AluI, AseI, AvaII, BssSI, DdeI, HaeIII, HhaI, HinfI, MboI, MseI, MspI, SpeI, SspI, TaqI, XbaI (New England, Biolabs, UK). The digested samples were electrophoretically separated on 8% polyacrylamide gels.
Diversity indices and population genetic structure
The raw data were restriction site patterns. Each haplotype was assigned as a series of binary data, ‘1’ for the presence of a restriction site and ‘0’ for its absence. Restriction patterns are available upon request. Standard genetic diversity indexes, such as the number of distinct haplotypes found in each sample, haplotype diversity (h) (the probability that two randomly chosen haplotypes are different in the sample), nucleotide diversity (π) (the probability that two randomly chosen homologous nucleotides are different) (Nei, Reference Nei1987) and mean number of pairwise differences (dx) (Tajima, Reference Tajima1983), were calculated using Arlequin version 3.01 (Excoffier et al., Reference Excoffier, Laval and Schneider2005).
Population structure was assessed by calculating F ST values for pairwise comparisons of samples. An estimation of gene flow with mtDNA can be obtained by many methods, among which the cladistic method of Slatkin & Maddison (Reference Slatkin and Maddison1989) has been proposed. However, in cases of low migration rates, as found in our study, the method based on F ST provides better estimates (Roderick, Reference Roderick1996). F ST and M values were calculated using Arlequin version 3.01. M, which is the absolute number of successfully reproducing migrants exchanged between two populations per generation (=N em, Ne=the effective size of the population and m=the proportion of migrants per generation), can be estimated by the equation M=(1−F ST)/2F ST. The null distribution of pairwise F ST values under the hypothesis of no difference between the populations is obtained by permuting haplotypes between populations. The P-value of the test is the proportion of 10,000 permutations leading to a F ST value larger than or equal to the observed one. The structure of the data was also investigated by analysis of molecular variance (AMOVA; Excoffier et al., Reference Excoffier, Smouse and Quattro1992) using Arlequin version 3.01. Particularly, the partition of haplotype diversity between groups (northern and southern populations), among populations within groups, and within populations was examined. This approach is based on analyses of variance of gene frequencies, but it takes into account the number of mutations between molecular haplotypes. A permutation (10,000 permutations of the original data set) non-parametric approach was used for the significance of fixation indices (ΦCT, ΦST, F ST) described by Excoffier et al. (Reference Excoffier, Smouse and Quattro1992). The phylogenetic relationships among populations was also examined by constructing a UPGMA tree using PHYLIP 3.5 (Felsenstein, Reference Felsenstein1993) based on Nei's D genetic distance (raw number of nucleotide differences between populations; Nei & Li, Reference Nei and Li1979). To test for significant isolation by distance, a Mantel test was carried out, using matrices of geographic distance and Nei's D genetic distance or F ST values between populations as input data. The test was performed using the FSTAT v. 2.9.3.2 program (Goudet, Reference Goudet2001).
Relationships among haplotypes
The relationships among haplotypes were investigated using a minimum spanning network (MSN). The MSN was constructed from the data set of the haplotypes using the reduced median algorithm (Bandelt et al., Reference Bandelt, Foster, Sykes and Richards1995) implemented in the program NETWORK version 4.1.1.2 (Fluxus Technology Ltd).
Demographic history of populations
The distribution of the observed number of differences between pairs of haplotypes was analysed by the mismatch distribution using Arlequin ver. 3.01. This distribution is usually multimodal in populations at demographic equilibrium, but it is usually unimodal in populations having passed through a recent pure demographic expansion (Slatkin & Hudson, Reference Slatkin and Hudson1991; Rogers & Harpending, Reference Rogers and Harpending1992). The validity of the estimated stepwise expansion model (Rogers, Reference Rogers1995) was tested using the method of sum of square deviations (SSD) between the observed and the expected mismatch as a test statistic (Schneider & Excoffier, Reference Schneider and Excoffier1999). The significance of this statistic was tested as implement in Arlequin ver. 3.01. The Tajima's (D) test for neutrality was also applied (Tajima, Reference Tajima1989). Note, that significant D values can be due to factors other than selective effects, like population expansion, bottleneck or heterogeneity of mutation rates (Tajima, Reference Tajima, Takahata and Clark1993, Reference Tajima1996; Aris-Brosou & Excoffier, Reference Aris-Brosou and Excoffier1996).
Results
Haplotype frequencies and within population diversity
In the amplified fragment of COI, six of the 15 restriction enzymes had a recognition site, and a total of 16 restriction sites was recorded. No variation was found among populations and all individuals were assigned to one haplotype. Therefore, data from COI was excluded from further population analysis. By contrast, for the 16S rRNA, 12 of the 15 enzymes used had a recognition site. A total of 48 restriction sites and 28 haplotypes was recorded (table 1). However, a length heteroplasmy was observed. In 83 individuals, a fragment of ∼590 bp long was amplified; while in the other 97, the amplified fragment had a size of ∼610 bp long. This length heteroplasmy showed an interesting north to south cline. The five northern populations (Toulouse, Perugia, Pontevedra, Lleida, Axioupoli), i.e. those from localities at a latitude higher than 40°N (fig. 1), consisted exclusively of individuals with the ∼590 bp fragment. On the contrary, this fragment was present with very low to moderate frequencies in the four southern populations (Velestino 45%, Mornos 15%, Kilini 10%, Tripoli 5%). Length heteroplasmy is observed in various animals (e.g. lagomorphs; Casane et al., Reference Casane, Dennebouy, De Rochambeau, Mounolou and Monnerot1997) including insects (Boyce et al., Reference Boyce, Zwick and Aquadro1989; Harrison, Reference Harrison1989; Kondo et al., Reference Kondo, Satta, Matsuura, Ishiwa, Takahata and Chigusa1990). In some cases, it has been attributed to variations in the number of copies of short tandemly repeated sequences in the major non-coding regions of mtDNA.
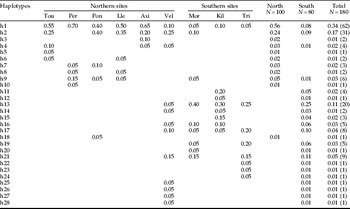
Frequency and number (in brackets) of the different haplotypes of Sesamia nonagrioides found in each sampling site. Twenty individuals per sampling site were examined.

Northern sites: Tou, Toulouse, France; Pon, Pontevedra, Spain; Lle, Lleida, Spain; Per, Perugia, Italy; Axi, Axioupoli, Greece; Southern sites: Vel, Velestino, Greece; Mor, Mornos, Greece; Kil, Kilini, Greece; Tri, Tripoli, Greece.
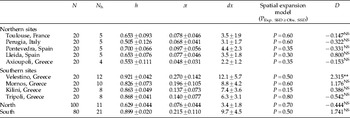
Fifteen out of the 28 haplotypes recorded were unique, i.e. found only in one population, and accounted for the 11.7% of the individuals examined. The other 13 haplotypes were common between two or more populations. The most common haplotypes were h1, h2 and h13, which all together accounted for the 62% of the examined individuals. The commonest haplotype (h1) was found in all localities surveyed (table 1). The frequency of haplotypes h1 and h2 decreased significantly in the south, although h2 was not sampled in Perugia (pooled data for h1 and h2: 56.0% in the north vs. 6.0% in the south, X 12=46.3, P<0.001 and 24.0% in the north vs. 8.8% in the south, X 12=7.3, P<0.007, respectively). By contrast, haplotype h13 was collected only in the south (table 1). In general, higher intrapopulation diversity was observed in the southern populations compared with those from the north. The number of haplotypes and haplotype diversity were higher in the south than in the north. Also, 17 haplotypes were found only in the south, while seven only in the north. The remaining four haplotypes were common between northern and southern populations (tables 1 and 2). Nucleotide diversity (π) and mean number of pairwise differences (dx) were two- to six-fold higher in the southern populations than in the northern ones and ∼three-fold higher when the pooled data of north and south localities was compared (table 2).
Number of individuals of Sesamia nonagrioides examined (N), number (N h) of different haplotypes found in each sampling site, haplotype (h) and nucleotide diversity (π), mean number of pairwise differences (dx), probability for the sudden expansion model and Tajima D test for neutrality.

NS, not significant; **P<0.01.
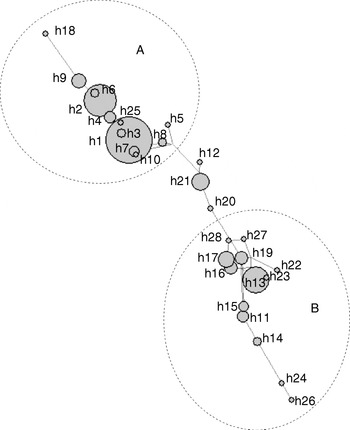
The MSN without displaying a star-like pattern grouped the haplotypes in two major clusters (fig. 2). One cluster contained the haplotypes from the north, one from the south (h25) and four (h1, h2, h4 and h9) common to both the northern and southern localities. The other cluster included the haplotypes from the southern localities. Three haplotypes (sampled only in the south; h12, h20 and h21) are located in the middle of the network.
Minimum spanning network of the 28 Sesamia nonagrioides haplotypes (h1–h28). Diameters of shaded circles are proportional to the number of individuals for each haplotype. The distance between haplotypes is proportional to the number of mutations, the smallest distance being one mutation. A: The cluster contains the haplotypes from the north, one from the south (h25) and four (h1, h2, h4 and h9) found in both northern and southern localities. B: Cluster of the haplotypes from the southern localities. h12, h20 and h21 are haplotypes sampled only in southern localities.

Population structure
AMOVA indicated that the majority of genetic variation (55.9%) occurred between the northern and the southern group of populations, and the ΦCT value (0.559, P<0.001) suggested a high level of genetic differentiation. The variation among populations within groups was 4.5% (ΦSC=0.102, P<0.001) and that within populations was 39.6%. The overall F ST value (0.604, P<0.001) suggested a high level of differentiation among populations.
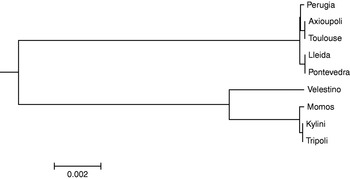
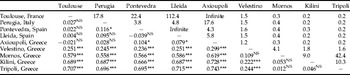
The geographical structuring of populations was also revealed by the UPGMA tree (fig. 3) based on Nei's raw number of nucleotide differences between populations and by the pairwise F ST analysis (table 3). The tree revealed two distinct clusters, the first included the five populations from northern latitudes and the other those from the south. The pairwise F ST analysis revealed significant and high values ranging from 0.236 to 0.743 between the northern and the southern populations. By contrast, no significant and low F ST values were found in most of the pairwise comparisons among the samples from the north. In the southern group, only two out of six pairwise comparisons (Velestino vs. Kilini and Velestino vs. Tripoli) resulted in moderate and significant F ST values (0.222 and 0.244, respectively). These values were in the same order as those obtained in pairwise comparisons between Velestino and each of the northern populations. Lastly, Mantel test did not reveal a significant correlation between geographical distance and either Nei's raw number of nucleotide differences between populations (r=0.300, P=0.910) or F ST distance (r=0.3280, P=0.893).
UPGMA tree clustering the nine Sesamia nonagrioides populations according to the Nei's genetic distance (D, raw number of nucleotide differences between populations) matrix. The scale denotes the genetic distance.

Pairwise F ST values among localities (below diagonal) and absolute number of females (M=Nem) of Sesamia nonagrioides exchanged among populations per generation (above diagonal).

NS Not significant; *P<0.05; **P<0.01; P<0.001.
Demographic history of populations
Tajima's test (D) for selective neutrality was not rejected in all but one population. The population from Velestino showed a significant positive value (2.315). When samples were pooled according to latitude, no significant deviation from neutrality was observed either in the northern or in the southern group of populations (table 2). The model of sudden (demographic) expansion was rejected in three out of five northern populations, since the distribution of the observed number of differences between pairs of haplotypes differed significantly from the distribution under the model of sudden expansion. By contrast, the model could not be rejected in all four southern populations. When samples were pooled in two major groups, the model was rejected in the north but not in the southern group.
Discussion
The present study is an attempt to examine variation in mtDNA in S. nonagrioides, a major pest of maize in countries around the Mediterranean basin. The results did not reveal any variation in COI, which has been proved informative in studies of other lepidopteran species (Sperling & Hickey, Reference Sperling and Hickey1994; Salvato et al., Reference Salvato, Battisti, Concato, Masutti, Patarnello and Lorenzo2002; Vandewostijne et al., Reference Vandewoestijne, Baguette, Brakefield and Saccherib2004), including noctuids, e.g. Panolis flammea (Denis & Schiffermüller) (Lowe et al., Reference Lowe, Hicks, Worley, Ennos, Morman, Stone and Watt2005). By contrast, important variation was found in the 16S rRNA fragment. RNA genes are considered as the slowest evolving part within the mitochondrial genome and are highly conserved among different insect taxa (see Simon et al., Reference Simon, Frati, Beckenbach, Crespi, Liu and Flook1994 and references therein) and even more among distant animal taxa (Meyer, Reference Meyer, Mochachka and Mommsen1993; Orti et al., Reference Orti, Petry, Porto, Jegu and Meyer1996). In the present study, 28 haplotypes were found among the 180 individuals examined, and most of the haplotypes were separated into two quite divergent groups (as revealed by MSN analysis; see fig. 2). The fact, therefore, that important variation was found in such a conservative gene suggests that a substantial degree of genetic divergence exists within the species. The lack of between-populations variability in the COI segment, which is considered less conserved than RNA genes, could be attributed to the fact that only a part of the COI gene was examined.
Geographical structuring and dispersal
An interesting finding was the high level of genetic differentiation and the strong population structure. The UPGMA tree, based on Nei's raw pairwise differences, clustered the nine populations into two major clades according to latitude. The first clade consisted of the less diverse populations from northern latitudes (<40°N), and the second contains those characterized by a high intra-population diversity sampled in the south (see figs 1 and 3). This clustering reflects the partitioning of 16S rRNA haplotypes and the levels of intra-population diversity related to latitude rather than isolation by distance. Supporting evidence provided by AMOVA showed that most of the genetic variance (56%), observed in the data, was due to the difference between the northern and the southern group of populations. The pairwise F ST analysis also confirmed the substantial geographical structuring, since significant and high F ST values have been found between northern and southern populations. Within the northern group, little or no differentiation was observed, even though some populations were collected at sites, ∼1800 km apart each other (i.e. Axioupoli vs. Toulouse). Among the four populations of the southern group, the one collected at a northern latitude (i.e. Velestino) seems to be somehow differentiated (significant and moderate F ST values) from those collected 160–220 km further south at Kilini and Tripoli.
The overall F ST value found in the present study (0.604) and those in pairwise comparisons between northern and southern populations (0.236–0.743, table 3) are among the highest reported for other lepidopteran noctuid species based on mtDNA or allozyme analysis and similar to those found in species with strong population structuring. Salvato et al. (Reference Salvato, Battisti, Concato, Masutti, Patarnello and Lorenzo2002) found an overall F ST=0.799 among populations of the forest pest, Thaumetopoea pityocampa, collected from different countries of the Mediterranean basin. In Busseola fusca Fuller (Lepidoptera: Noctuidae), a major pest of maize and cultivated sorghum, Sorghum bicolor (L) (Poaceae), Sezonlin et al. (Reference Sezonlin, Dupas, Le Ru, Le Gall, Moyal, Calatayud, Giffard, Faure and Silvain2006) reported an ΦCT value 0.708 among three major biogeographic zones in Africa (ΦCT=0.559 between northern and southern group in our study). By contrast, much lower F ST values have been found among populations of highly vagile or migratory noctuid pests, e.g. in Heliothis virescens (Fabricius) at a spatial scale of 2000 km (0.002; Schneider, Reference Schneider1999), in Helicoverpa armigera (Hübner) populations from Turkey and Israel (0.004–0.020, depending on the method of calculation; Zhou et al., Reference Zhou, Faktor, Applebaum and Moshe2000), and in Ostrinia nubilalis (Hübner) populations from Atlantic and Midwestern regions of USA (0.024; Coates et al., Reference Coates, Sumerford and Hellmich2004).
A previous study (Buès et al., Reference Buès, Eizaguirre, Toubon and Albages1996) on allozyme variation in S. nonagrioides populations from Morocco, northern Spain and southern France reported an F ST value 0.064. Leniaud et al. (Reference Leniaud, Audiot, Bourguet, Frérot, Genestier, Fai Lee, Malausa, Le Pallec, Souqual and Ponsard2006) also using allozyme markers estimated a similar value (0.061) in populations from France and Spain from various host-plants. These values are over an order of magnitude larger than the value found in the present study between Toulouse and Lleida (0.004) and three times larger than that between Toulouse and Pontevedra (0.022), although allozymes are considered as a technique of lower resolution ability than mtDNA RFLPs. This could be due to the fact that Buès et al. (Reference Buès, Eizaguirre, Toubon and Albages1996) examined samples collected on a greater latitude gradient than the present study. However, this is not the case for the study of Leniaud et al. (Reference Leniaud, Audiot, Bourguet, Frérot, Genestier, Fai Lee, Malausa, Le Pallec, Souqual and Ponsard2006). The low F ST values obtained here could be explained by the fact that we examined two mitochondrial genes, and of course only a part of them, which is considered conservative (Simon et al., Reference Simon, Frati, Beckenbach, Crespi, Liu and Flook1994). Whether another set of restriction enzymes or sequence of these segments could reveal a greater amount of genetic variability remains to be found. Another point is that the present study confirms a previous hypothesis about reproductive isolation between north-eastern Spain and southern Greece populations (López et al., Reference López, Eizaguirre and Albajes2003). It has been demonstrated that these populations possess differences in various ecophysiological traits, such as pre-reproductive period, adult age at mating, the onset of female calling behaviour during the day (López et al., Reference López, Eizaguirre and Albajes2003) and the response to pheromone component ratios (Sans et al., Reference Sans, Riba, Eizaguirre and López1997).
Low dispersal ability, geographical barriers, habitat fragmentation and host plant availability have been considered as factors responsible for the observed genetic differentiation among populations in phytophagous insects (Mopper, Reference Mopper1996). All these factors might contribute to the geographical structuring observed in the present study. On the basis of F ST and N em values between northern and southern populations, it seems that long-distance migration by adult females of S. nonagrioides between these two groups is rather rare. The number of migrants calculated for such distance is well below the threshold of one per generation, which theoretically is sufficient to maintain genetic homogeneity among populations (Wright, Reference Wright1978). It is worth noting, however, that low dispersal ability cannot explain the genetic similarity observed among most of the populations from northern latitudes (i.e. Axioupoli in North Greece and those from Western Europe). F ST analysis, although efficient at demonstrating genetic differentiation, has several limitations when migration rates are concerned (Pearse & Crandall, Reference Pearse and Crandall2004), for example a recent gene-flow is difficult to distinguish from a historical one (Slatkin & Madison, Reference Slatkin and Maddison1989). It is hard to imagine how geographically separated demes exchange high numbers of such short-lived adult individual insects per generation, whilst the exchange between Axioupoli and South Greece is restricted. The data are compatible with the scenario of a historical expansion of the species from the south towards the northern regions over a long time scale followed by the survival of certain genotypes, e.g. those able to withstand severe winters, those with low voltinism or those with other traits adapted to the northern environment. This scenario will be discussed further below.
Lower mtDNA diversity in the north
The present study also revealed lower intra-population polymorphism in the northern compared to southern localities. Leniaud et al. (Reference Leniaud, Audiot, Bourguet, Frérot, Genestier, Fai Lee, Malausa, Le Pallec, Souqual and Ponsard2006) mentioned the presence of Sesamia cretica Lederer (Lepidoptera: Noctuidae), although at low density, in southern Europe. The larvae of this species are rather indistinguishable from those of S. nonagrioides and one could speculate that the high diversity in the samples from southern Greece is due to the presence of cretica individuals. However, extensive surveys for lepidopteran pests of maize using light and pheromone traps in several regions of southern Greece during the 1980s and 90s did not reveal the presence of cretica adults (Tsitsipis, Reference Tsitsipis, Cavalloro and Sunderland1988; J.A. Tsitsipis et al., unpublished data). Therefore, this hypothesis could not account for the observed pattern of genetic variability. High levels of polymorphism in a population can be maintained if the population is large enough and stable for a long period of time. This pattern, i.e. a decrease in genetic variability in the north, is observed in various European insect species (Cooper et al., Reference Cooper, Ibrahim and Hewitt1995; Schmitt & Seitz, Reference Schmitt and Seitz2002; Snäll et al., Reference Snäll, Huoponen, Saloniemi, Savontaus and Ruohomäki2004), and it is considered a consequence of post-Pleistocene colonization events. During this period, the northward-expanding populations have experienced several bottleneck events, which resulted in the loss of a large amount of the original genetic variability (Avise, Reference Avise2000). The Tajima test for neutrality, however, was not rejected in any of the five northern populations or when it was applied on the pooled data from these samples (table 2). One possible interpretation is that northern populations might not have experienced a strong bottleneck, but the observed low genetic variability could simply reflect a founder effect. A progressive expansion of the species over a long time-scale from the southern less disturbed regions towards its northern limit seems possible, during which a few genotypes with selective advantages (e.g. tolerance to severe winters, low voltinism) were established.
It is worth noting that there is also an alternative hypothesis to the post-Pleistocene northward expansion of the species, i.e. a population expansion that followed the spread of maize cultivation in Europe. Maize had first been introduced in Spain in 1493 (Sauer, Reference Sauer1993) and then spread into other regions of Europe. It is possible that the original host plants (probably Poaceae) of S. nonagrioides were mainly available in southern regions (e.g. southern Greece, western and northern Africa) where the insect was initially located. Then the insect expanded northwards, when maize became available in these areas. From our data we cannot conclude whether an ancient or a more recent population expansion has left a stronger footprint, although both hypotheses are not necessarily mutually exclusive. There is also a possibility against the relative importance of natural selection as a driving factor for the pattern of genetic structuring observed in the present study. The low diversity in the northern populations could be explained by purely demographic effects, such as lower effective population size and evolutionary age (in terms of number of generations) compared to southern populations. This scenario is consistent with the fact that the Tajima test did not reject neutrality, and it also suggests a low frequency of long-range dispersal.
The coalescence theory (Kingman, Reference Kingman1980) predicts that the probability that a haplotype is the oldest is equal to its frequency in the sampled population. The expected rank of haplotypes by age is equal to their rank by frequency. Two (h1 and h2, fig. 2) of the three most frequent haplotypes, and probably the oldest ones, have been sampled from both northern and southern localities. The fact that northern and southern localities share two frequent, and probably the oldest, haplotypes is consistent with our theory about a northward dispersal of certain genotypes in the past history of the species. Alternatively, the occurrence of widespread haplotypes could suggest some ongoing gene flow between localities. However, the restricted gene flow estimated, the sedentary nature and the short life of the adults along with the many geographical barriers between southern and northern populations (Olympus and Pelion mountains, between the northern and southern sampling sites in Greece; sea and various mountain chains between southern Greek and European sampling sites) favour the possibility of an ancient progressive dispersal of certain haplotypes towards the northern borders of the distribution area of the species. Finally, sudden (demographic) expansion suggested by the mismatch distribution analysis (see table 2) for the southern group supports the above consideration.
The hypothesis, therefore, that the insect is largely sedentary and gene flow among geographically separated populations is restricted (Tsitsipis, Reference Tsitsipis, Cavalloro and Sunderland1988; Buès et al., Reference Buès, Eizaguirre, Toubon and Albages1996; Albajes et al., Reference Albajes, Eras, Lopez, Ferran, Vigata and Eizaguire2004), is supported by the results of the present study. Toward that direction, supporting evidence is provided by the length heteroplasmy observed. This heteroplasmy adequately discriminates the northern from the southern populations. In all individuals from the north, a shorter fragment was amplified, while it was found only in 19% of the individuals from the south. This percentage reflects the existence of four common haplotypes in both northern and southern localities.
It is worth noting that due to the maternal inheritance of mtDNA, estimation of geneflow and migration rates, based on such markers, may not be very accurate. Thus, further research is needed by applying both mitochondrial and nuclear DNA markers on the same populations in order for final conclusions to be drawn about male and female migration. In addition, application of microsatellite markers, which are highly polymorphic and suitable for population genetic studies (Sunnucks, Reference Sunnucks2000), on samples from various host-plants from Europe and northern Africa would probably give further insights in the evolutionary history of S. nonagrioides and probably provide cues for its future evolution.
Acknowledgements
The authors are grateful to Ana M. Butron (Misión Biológica de Galicia, Spanish Council for Scientific Research, CSIC, Apartado 28, E-36080, Pontevedra, Spain), Matilde Eizaguirre (Area de Proteccio de Conreus, Centre UdL-IRTA Universitat de Lleida, Spain), Eric Conti (Department of Arboriculture and Plant Protection-Entomology, University of Perugia, Borgo XX Giugno, 06121 Perugia) and Sergine Ponsard (Laboratoire Dynamique de la Biodiversité, UMR CNRS 5172, Université P. Sabatier – Toulouse III, 118 route de Narbonne, 31 062 Toulouse) for providing the samples collected outside Greece. In addition, the authors thank two anonymous reviewers for providing valuable comments on earlier versions of this manuscript.