INTRODUCTION
During the last glaciation, the Laurentide Ice Sheet covered much of north-central North America, extending well south of the Lake Superior basin. As the ice sheet shrank during deglaciation, various lobes and sub-lobes readvanced and retreated numerous times through the basin (Wright, Reference Wright1971; Clayton and Moran, Reference Clayton and Moran1982; Farrand and Drexler, Reference Farrand, Drexler, Karrow and Calkin1985). The last major ice advance into the Superior basin (Fig. 1), culminating at the end of the Younger Dryas, is called the Marquette readvance in the upper peninsula of Michigan (Clayton, Reference Clayton, Teller and Clayton1983; Drexler et al., Reference Drexler, Farrand, Hughes, Clayton and Teller1983; Farrand and Drexler, Reference Farrand, Drexler, Karrow and Calkin1985). This readvance formed a well-defined and well-dated moraine (Grand Marais I) near Marquette, Minnesota (see Fig. 1; Drexler et al., Reference Drexler, Farrand, Hughes, Clayton and Teller1983; Farrand and Drexler, Reference Farrand, Drexler, Karrow and Calkin1985; Lowell et al., Reference Lowell, Larson, Hughes and Denton1999). Radiocarbon dating of the Gribben forest bed that was buried by outwash of the Marquette readvance provide the best age estimate for the maximum of the advance, 10,025 ± 100 14C yr BP (ca. 11.7 cal ka BP; Lowell et al., Reference Lowell, Larson, Hughes and Denton1999), although age data exist in other areas (references in Leydet et al., Reference Leydet, Carlson, Teller, Breckenridge, Barth, Ullman, Sinclair, Milne, Cuzzone and Caffee2018). The extent and configuration of the Marquette readvance to the west, locally known as the Lake View advance (Clayton and Moran, Reference Clayton and Moran1982), is not well defined. Red tills along the Wisconsin shore of Lake Superior have been identified as related to the Lake View advance and correlated with the Marquette readvance (Clayton and Moran, Reference Clayton and Moran1982), as have till and related sediments on the Minnesota shore near Duluth (Hobbs, Reference Hobbs2004; Mooers et al., Reference Mooers, Larson and Marlow2005). In the Thunder Bay region of Ontario, the Marks moraine also has been assumed to correlate with the Marquette readvance (Zoltai, Reference Zoltai1963; Clayton, Reference Clayton, Teller and Clayton1983; Teller and Thorleifson, Reference Teller, Thorleifson, Teller and Clayton1983; Boyd et al., Reference Boyd, Teller, Yang, Kingsmill and Shultis2012).
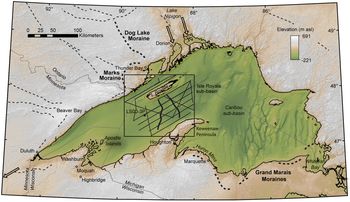
(color online) Location and bathymetric map for the Lake Superior region, modified from Breckenridge (Reference Breckenridge2013). Box delineates the study area for this paper, enlarged in Figure 2. Within this area, thick lines mark the two Isle Royale moraines (IR1 and IR2). Medium solid lines indicate ship tracks along which data were collected. Thin dashed line through core site LS00-3P, parallel to the nearby seismic line, is the line of profile for the topography shown in Figure 11. On land, labeled thick dashed lines indicate moraines that have been correlated with the Marquette readvance, lighter dashed lines indicate other moraines. Southwestern extension of the Marks moraine (light dashed) is based on small-scale ridges visible in LIDAR data (A. Breckenridge, unpublished data). The Nipigon area inlets from Lake Agassiz and the Portage outlet are shown diagrammatically by open arrows.

The position of the western Superior lobe of the ice sheet controlled potential eastward drainage of glacial Lake Agassiz (Teller, Reference Teller2013, and references therein), as well as smaller pro-glacial lakes that were predecessors to Lake Superior (Farrand, Reference Farrand1969; Farrand and Drexler, Reference Farrand, Drexler, Karrow and Calkin1985; Breckenridge, Reference Breckenridge2013). The routing of glacial Lake Agassiz overflow (Teller and Thorleifson, Reference Teller, Thorleifson, Teller and Clayton1983; Teller, Reference Teller2013) has been implicated as a factor affecting Atlantic Ocean meridional overturning circulation (Broecker et al., Reference Broecker, Kennett, Flower, Teller, Trumbore, Bonani and Wolfli1989) and may have initiated multiple abrupt climatic cooling events, including the Younger Dryas stadial. All potential eastern outlets of Lake Agassiz to the Atlantic Ocean during the late Younger Dryas would have been closed by the readvances to the Grand Marais and Marks moraines. Subsequent retreat of the ice margin from the basin allowed a series of high-volume discharges from Lake Agassiz into the Superior basin through channels in the Lake Nipigon area (see Fig. 1) during the early Holocene (Teller and Thorleifson, Reference Teller, Thorleifson, Teller and Clayton1983; Teller and Mahnic, Reference Teller and Mahnic1988; Leverington and Teller, Reference Leverington and Teller2003; Breckenridge and Johnson, Reference Breckenridge and Johnson2009; Gary et al., Reference Gary, Colman, Wattrus and Lewis2012).
The maximum position of Younger Dryas-age ice in the western arm of Lake Superior is uncertain, but three moraines have been identified in the Isle Royale sub-basin in seismic-reflection profiles (Landmesser et al., Reference Landmesser, Johnson and Wold1982). These moraines in the Isle Royale sub-basin were deposited in glacial Lake Duluth, which was impounded between the ice and the Portage outlet to the southwest (Landmesser et al., Reference Landmesser, Johnson and Wold1982; Breckenridge, Reference Breckenridge2013). Here we interpret new seismic-reflection data from the Isle Royale sub-basin, between Isle Royale and the Keweenaw Peninsula to better characterize the moraines described by Landmesser et al. (Reference Landmesser, Johnson and Wold1982) and overlying glacial-lacustrine sediments deposited during subsequent ice retreat (Breckenridge, Reference Breckenridge2007). These moraines, the till that underlies them, and the glacial-lacustrine sediments that overlie them define the depositional environment and a sequence of events associated with ice readvance and subsequent retreat during and immediately after the Younger Dryas in the western Lake Superior basin. These interpretations, in turn, help constrain the character, extent, and pacing of this last ice advance into the Superior basin, which has been implicated in the regulation of glacial Lake Agassiz overflow to the Atlantic Ocean.
DATA AND METHODS
Seismic-reflection data are relatively limited in Lake Superior, especially data collected with systems that penetrate deeper than the uppermost lacustrine deposits. Early seismic-reflection profiles were collected in Lake Superior to determine sediment thickness as part of the development of techniques for ocean drilling technology (Zumberge and Gast, Reference Zumberge and Gast1961). About 8000 km of additional seismic-reflection profiles were collected during the 1960s to define the topography of the bedrock surface and the total thickness of sediment above bedrock (Wold and Hutchinson, Reference Wold and Hutchinson1979; Wold et al., Reference Wold, Hutchinson and Johnson1982). Landmesser et al. (Reference Landmesser, Johnson and Wold1982) used a subset of these data along with 3.5 kHz data that they collected in the central part of the lake to define three recessional moraines and related deposits, which are discussed further here.
We collected seismic-reflection data using multiple systems in several areas of Lake Superior in order to better understand the glacial and post-glacial history of Lake Superior and Lake Agassiz. These surveys included areas in and adjacent to Thunder Bay, Ontario (Voytek et al., Reference Voytek, Colman, Wattrus, Gary and Lewis2012), the purported route of catastrophic drainage from Lake Agassiz at the beginning of the Younger Dryas (Teller and Thorleifson, Reference Teller, Thorleifson, Teller and Clayton1983), and the northern corner of Lake Superior and adjacent bays (Gary et al., Reference Gary, Colman, Wattrus and Lewis2012), where well-documented post-Younger Dryas floods from Lake Agassiz occurred (Teller and Mahnic, Reference Teller and Mahnic1988). Data collected in the mid-section of Lake Superior between Isle Royale and the Keweenaw Peninsula, known as the Isle Royale sub-basin, are the focus of this study (Fig. 2). Most of the data were collected during a research cruise on the RV Blue Heron in 2006; supplemental data were collected on a similar cruise in 2009. Additional data from a pseudo-3D (lines spaced about 50 m apart) seismic-reflection survey, conducted with the 28 kHz ship-mounted Knudsen echo sounder aboard the RV Blue Heron (Wattrus et al., Reference Wattrus, Sharpe and Cartwright2006) were also used here. This pseudo-3D survey was located around one of the cores (LS00-3P) examined by Breckenridge (Reference Breckenridge2007). Additional short cores were taken subsequently in the area and described by Johnson et al. (Reference Johnson, Van Alstine, Rolfhus, Colman and Wattrus2012). These cores provide lithological information for the upper part of the sedimentary section.
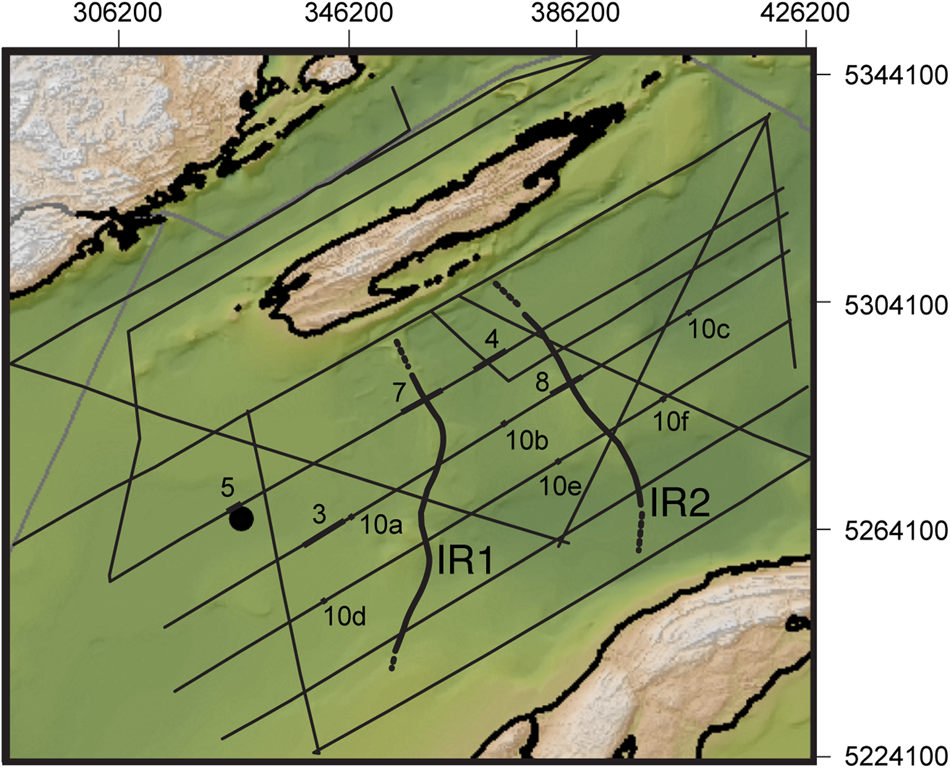
(color online) Detailed bathymetric map showing tracks along which data were collected, as indicated in Figure 1. Horizontal and vertical scales are in meters in Universal Transverse Mercator zone 16 projection. Labeled thick line segments indicate locations of seismic profiles shown in corresponding figures. Thick curved lines indicate the crests of the Isle Royale moraines (IR1 and IR2). Circle near the segment for Figure 5 is the location of core LS00-3P.

Seismic-reflection data were collected with two systems: a small airgun system and an EdgeTech™ Compressed High Intensity Radar Pulse (CHIRP) system. The surveys were designed and managed using a Hypack™ Survey Management system. Navigation was by differential GPS, and the average survey speed was approximately 3.5–4 knots. The airgun data were collected using a 5-in3 chamber Bolt™ airgun as a sound source, towed about 0.5 m below the water surface. A Benthos™ AQ-4 24-element hydrophone streamer was used with the airgun for high-resolution single-channel data acquisition, and the source was fired at 2-s intervals. This generated an average offset between each trace of approximately 3–4 m. The data were recorded with a digital ISIS™ system, using a record length of 0.75 s. The airgun data were processed at the Large Lakes Observatory using SPW™. Data processing included geometry, muting of the water column, spherical divergence correction, bandpass filtering, and deconvolution to simplify the wavelet.
The CHIRP data were collected using a single-channel EdgeTech SB-0512i CHIRP sub-bottom profiler and deep towfish; 20-ms sound pulses were used at a swept frequency of 0.7–12 kHz, yielding a theoretical vertical resolution of about 10 cm. The CHIRP towfish was deployed at variable depths close to the lake floor, so the depths on CHIRP profiles are reported relative to the towfish rather than to the lake surface.
Both types of processed data were interpreted using Kingdom Software Suite (IHS, Houston, Texas), an industry standard interpretation package. An average sound velocity of 1500 m/s for fresh lake water and unconsolidated sediments was assumed. Actual sound velocities are probably slightly less than this for fresh water, and they may be somewhat higher for consolidated sediment such as till (e.g., Peters et al., Reference Peters, Anandakrishnan, Alley and Smith2007). Seismic records were collected along the survey lines shown in Figure 2. Approximately 1470 km of seismic profiles were collected as part of this project. Data were processed and archived in the Geophysics Laboratory at the Large Lakes Observatory, University of Minnesota Duluth.
RESULTS
Seismic-stratigraphic units
Seismic-stratigraphic units were defined in accordance with standard practices by their reflection character, bounding reflection configuration, and external geometries, following the criteria of Stoker et al. (Reference Stoker, Pheasant, Josenhans, Davies, Bell, Cooper, Josenhans, Polyak, Solheim, Stoker and Stravers1997). Although seismic units can differ from lithological units, here we interpret seismic units as corresponding uniquely with genetic sedimentary units. Thus, we define sedimentary units directly, rather than constructing an independent seismic stratigraphy that would then have to be correlated with lithologic units. Our seismic-lithologic units are not repeated stratigraphically, with one exception (multiple tills). Unconformities occur only between certain units, and they are discussed only where pertinent to the geologic history.
Bedrock: The western part of Lake Superior is underlain by Precambrian sedimentary and volcanic rocks related to the 1.1 Ga Mid-Continent Rift. The study area itself likely is underlain by post-volcanic sediments in the central graben of the rift, the Oronto and/or the Bayfield Groups of the Keweenaw Supergroup (Morey et al., Reference Morey, Sims, Cannon, Mudrey and Southwick1982; Cannon et al. Reference Cannon, Green, Hutchinson, Lee, Milkereit, Behrendt, Halls, Green, Dickas, Morey, Sutcliffe and Spencer1989). Throughout most of the study area, the signals from the airgun source reached bedrock, whose upper surface is marked by a continuous, high-amplitude reflection. The seismic signals commonly penetrated a short distance into bedrock, which in many areas is sedimentary, as indicated by parallel internal reflections (Figs. 3 and 4). Depending on the orientation of the profile, internal reflections within the upper part of the bedrock are gently dipping, generally toward the basin center, and parallel over relatively long distances (many km).
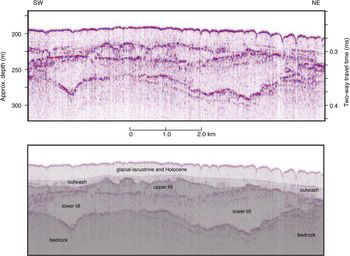
(color online) Airgun seismic profile showing bedrock and multiple till units. Location shown in Figure 2. Depth scale assumes a sound velocity of 1500 m/s.

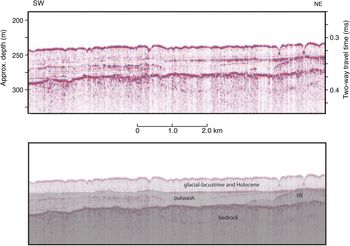
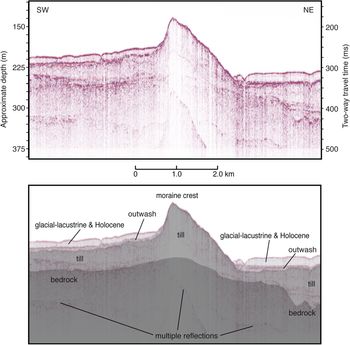
(color online) Airgun seismic profile showing relatively thick outwash. Location shown in Figure 2. Depth scale assumes a sound velocity of 1500 m/s.

Till: Till deposits in the airgun seismic-reflection data are characterized by high-amplitude, continuous, irregular upper- and lower-bounding reflections with chaotic or massive internal structure and rare discontinuous internal reflections (see Fig. 3). These seismic characteristics are typical signatures of till in other subaqueous environments (references in Davies et al., Reference Davies, Bell, Cooper, Josenhans, Polyak, Solheim, Stoker and Stravers1997). Till lies directly and unconformably on bedrock or other till units, where its specific means of emplacement (lodgment, ablation, etc.) may be uncertain. Till forms the cores of the moraines described here, and till grades into, and interfingers with, stratified outwash beneath the distal (southwestern) parts of those moraines. The lack of stratification in till distinguishes it from outwash deposited by flowing water.
Stratified outwash (Otw): Outwash lies directly above till, with high-amplitude, continuous upper-and lower-bounding reflections. In the down-ice (southwestern) sections of moraine interiors, outwash interfingers with, and grades into, till. Internally, outwash units are acoustically stratified, with long, continuous, parallel internal reflections in the airgun data (see Fig. 4). The uppermost outwash deposits are also commonly penetrated by the CHIRP signal. Most of the stratified outwash in the study area occurs to the southwest of the major moraines, but thin outwash is found on bedrock in the northeast part of the study area as well. Because the Marquette readvance was continuously in contact with a series of proglacial lakes (Farrand and Drexler, Reference Farrand, Drexler, Karrow and Calkin1985; Breckenridge, Reference Breckenridge2013), the stratified outwash is interpreted as subaqueous, deposited in freshwater settings similar to those described elsewhere (e.g., Rust and Romanelli, Reference Rust, Romanelli, Jopling and McDonald1975; Sharpe et al., Reference Sharpe, Pullan and Warman2007; Geirsdóttir et al., Reference Geirsdóttir, Miller, Wattrus, Björnsson and Thors2008).
Glacial-lacustrine deposits (Gl): Glacial-lacustrine deposits conformably overlie bedrock, outwash, or till. Sediment cores establish that the oldest glacial-lacustrine sediments are red varves, which are superseded by gray varves (Farrand, Reference Farrand1969; Dell, Reference Dell1972; Leverington and Teller, Reference Leverington and Teller2003; Breckenridge, Reference Breckenridge2007; Hyodo and Longstaffe, Reference Hyodo and Longstaffe2011).
The glacial-lacustrine deposits are largely transparent in the airgun data, but the base of the unit, where it is underlain by stratified outwash, is commonly observed in the airgun data. The glacial-lacustrine deposits are acoustically laminated in the CHIRP data (Fig. 5), and they are bound by a high-amplitude reflection at the top of the older units and by a weak, continuous reflection at the boundary with the overlying post-glacial lacustrine clays. In the CHIRP data, the glacial-lacustrine deposits can be divided into two sub-units in much of the study area: a strongly laminated lower sub-unit (Gll) and a moderately laminated upper sub-unit (Glu). The boundary between the two glacial-lacustrine units is commonly disrupted by small-scale discontinuities (see Fig. 5). Cores recovered from this unit within the study area (including LS00-3P, location shown in Figures 1 and 2) show that both sub-units are glacial-lacustrine varves (Breckenridge, Reference Breckenridge2007; Hobbs and Breckenridge, Reference Hobbs and Breckenridge2011; Johnson et al., Reference Johnson, Van Alstine, Rolfhus, Colman and Wattrus2012), and that the red-gray boundary is approximately at the contact between the Gll and Glu sub-units (see Fig. 5). The strong acoustic laminations characteristic of the unit are the result of interference patterns caused by many reflections from closely spaced, parallel horizons in the varved sequence.
(A) CHIRP seismic profile showing the glacial-lacustrine and Holocene sequence near core LS00-3P. Location shown in Figure 2. Depth scale assumes a sound velocity of 1500 m/s. Interpreted seismic-stratigraphic column is shown, and the projected position of core LS00-3P is shown diagrammatically. Arrows indicate disrupted reflections (see text). (B) Images and selected data for core LS00-3P (modified from Hobbs and Breckenridge, Reference Hobbs and Breckenridge2011). The correlation between the red-gray transition in the core and the boundary between the upper and lower glacial-lacustrine units in this study occurs at a depth of about 2.3 m in the core and is indicated by the line to the CHIRP profile.

Post-glacial (Holocene) lacustrine clay (Hol): The uppermost (surface) unit in the sequence is post-glacial-lacustrine clay, present at the lake floor, which is transparent in the airgun data and has weak acoustic internal stratification in our CHIRP data (see Fig. 5) as well as other high-resolution seismic data (Wattrus et al., Reference Wattrus, Rausch and Cartwright2003). The boundary with the underlying glacial-lacustrine deposits is a weak, continuous reflection in the CHIRP data. The boundary tends to be conformable in the deepest part of the basin and unconformable in shallower areas, where the top of the glacial-lacustrine unit has been subaqueously eroded. The upper boundary of the unit is the lake floor. The unit is absent in relatively shallow water and on top of some topographic highs such as moraine crests. This unit has been the subject of many coring studies (cf. Dell, Reference Dell1972; Breckenridge et al., Reference Breckenridge, Johnson, Beske-Diehl and Mothersill2004; Johnson et al., Reference Johnson, Van Alstine, Rolfhus, Colman and Wattrus2012) and will not be discussed in detail here. The lake floor and the Holocene lacustrine clay are affected by polygonal faulting and ring structures that are well developed in the study area (Wattrus et al., Reference Wattrus, Rausch and Cartwright2003; Cartwright et al., Reference Cartwright, Wattrus, Rausch and Bolton2004; Johnson et al., Reference Johnson, Van Alstine, Rolfhus, Colman and Wattrus2012), and whose annular depressions appear in seismic profiles as sharp V-shaped “valleys” in the lake floor (see Figs. 3–5).
Till stratigraphy
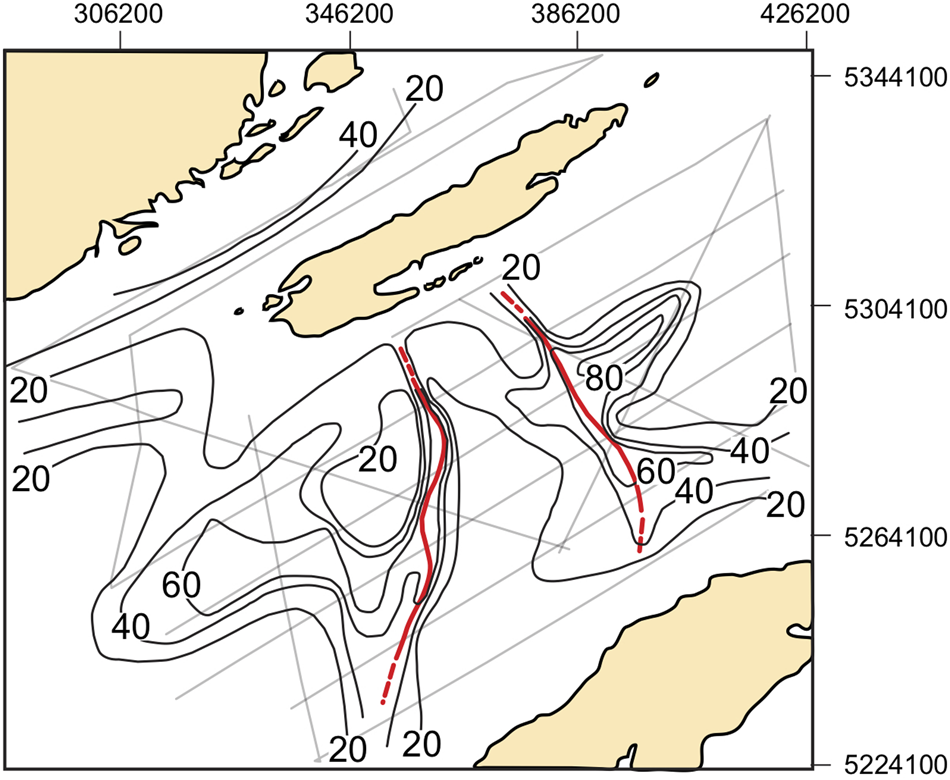
Although till deposits more than 300 m thick have been observed in the deep trough near the north shore of the western arm of Lake Superior (Wold et al., Reference Wold, Hutchinson and Johnson1982; Farrand and Drexler, Reference Farrand, Drexler, Karrow and Calkin1985), till is much thinner in the Isle Royale sub-basin (Fig. 6). The distribution of till in the study area is highly variable, but thicknesses of more than 80 m occur locally, primarily beneath the morainal ridges, but also in other locations where bedrock is irregular. Despite the complexity of the till distribution, the two moraines that are discussed in the next section clearly show as continuous narrow bands of thick till on the isopach map (see Fig. 6).
Isopach map of till in the study area, contour interval 20 m. Crests of the two Isle Royale moraines (IR1 and IR2), are shown as thick (red) lines, dashed where extrapolated. (For interpretation of the references to color in this figure legend, the reader is referred to the web version of this article.)

With more extensive data than previously available, we interpret the till stratigraphy somewhat differently than previous studies (Landmesser et al., Reference Landmesser, Johnson and Wold1982). Their interpreted sequence consisted of three off-lapping stratigraphic units of drift, each drift unit consisting of four facies: stratified drift and three till facies. In our data, we were able to identify multiple superimposed till units locally, two of which are shown in Figure 3. However, the observed till units are generally thin and discontinuous, and we could not trace them far enough laterally to define separate stratigraphic sequences. Also, we could not consistently correlate stacked till units between isolated occurrences. As noted by Landmesser et al. (Reference Landmesser, Johnson and Wold1982), the lower members of stacked till units could range in age from early Quaternary to late glacial. Although the till units could vary greatly in age, the simplest explanation is that they were all deposited during minor fluctuations in the Marquette readvance or slightly older late Wisconsinan advances. We therefore treat till as a single seismic unit, noting that this is the only case in which our seismically defined stratigraphic units may include deposits of more than one age.
The till facies described by Landmesser et al. (Reference Landmesser, Johnson and Wold1982, moraine, ablation, and basal till facies) were defined mainly by geomorphic position, especially in relation to moraines. They do not appear to have unique seismic signatures. While moraines are a major focus of this study, till facies defined by geomorphic position (e.g., moraine till, Landmesser et al. [Reference Landmesser, Johnson and Wold1982]) are a mixture of landform and deposit, which are not useful for our purposes.
Moraines
End moraines are generally considered to indicate stable ice-margin positions, although they may be deposited rapidly. In order to identify end moraines in this study, we used multiple geomorphic and lithological criteria indicative of stable ice-margin positions. These include: (1) ridge-like topographic form, buried or exposed; (2) extension of the ridge in a direction nearly perpendicular to ice flow, across several seismic lines; (3) significant accumulation or thickening of till beneath the topographic ridge; and (4) gradation of till within the core of the ridge interior to stratified outwash in a down-ice direction, which in some cases creates an asymmetric transverse profile of the ridge. Not all of these criteria are satisfied at every location along the moraines we identify, but the majority of these characteristics are present in each case.
Based on these criteria, two well-developed end moraines were identified in the study area, and each includes most of the criteria we use to define stable ice-margin positions. To avoid nomenclature confusion and a priori acceptance of previous correlations, we rename these moraines the Isle Royale (IR) moraines. IR1 is the outer and older of the two moraines, and IR2 is the inner, younger one.
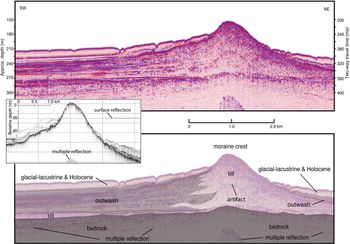
The airgun profile of the IR1 moraine in Figure 7 contains many of the classical features of an end moraine and is remarkable for showing the internal structure of the moraine as well as continuous bedrock beneath it. The moraine crest is about 60 m above the distal (down-ice) lake floor and about 80 m above the proximal (up-ice) lake floor. The topographic profile of the moraine ridge has a classic asymmetric transverse profile, steeper on the proximal, ice-contact (northeast) side, in part because of the interfingering of outwash on the distal (southwest) side. A nearly flat bedrock surface is observed continuously under the moraine, accentuating the accumulation of till (more than 100 m thick) beneath the crest of the moraine. The apparent rise in the bedrock surface beneath the crest of the moraine (see Fig. 7) is a common artifact called a “velocity pull-up” caused by the slightly higher-than-average sound velocity of the till beneath the moraine crest compared to that of the water and sediments on either side of the crest. Beneath the distal side of moraine, massive till grades into and interfingers with stratified drift, which we interpret as subaqueous outwash. The outwash rapidly thins away from the moraine, forming a distinct wedge or fan. In plan view, the crest of both the IR1 and IR2 moraines are convex down-ice (southwest) in the central (deepest) part of the basin (see Fig. 6).
(color online) Airgun seismic profiles across the outer (IR1) Isle Royale moraine. Inset is a CHIRP seismic profile on the same line. Location shown in Figure 2. Depth scale assumes a sound velocity of 1500 m/s.

Similar features are observed in the inner moraine (IR2), although this moraine is generally smaller and less well developed than IR1 (see Fig. 8). In the location shown (see Fig. 8), the distal flank of the IR2 moraine is steeper than the proximal side, in contrast to the more common steeper proximal side. Both IR1 and IR2 have topographic expression at the lake floor (see Fig. 2). No unusual till thicknesses or distinct moraines were observed in the Isle Royale Trough (north of Isle Royale) in our data nor in similar data collected off Thunder Bay (Voytek, Reference Voytek2010; Voytek et al., Reference Voytek, Colman, Wattrus, Gary and Lewis2012).
(color online) Airgun seismic profile across the inner (IR2) Isle Royale moraine. Location shown in Figure 2. Depth scale assumes a sound velocity of 1500 m/s.

Glacial-lacustrine sequence
Extensive glacial-lacustrine clays (varves) were deposited in the pro-glacial lake that formed during the retreat phase of the Marquette readvance, while the ice was in contact with the lake (Farrand, Reference Farrand1969; Dell, Reference Dell1972; Breckenridge, Reference Breckenridge2007; Hyodo and Longstaffe, Reference Hyodo and Longstaffe2011). The glacial-lacustrine seismic unit is divided into upper (Glu) and lower (Gll) sub-units separated by a distinct seismic horizon in our data (see Fig. 5 and related discussion). The two glacial-lacustrine sub-units are preserved in most of the study area, except in relatively shallow water and atop features such as the end moraines. In the deep areas between Isle Royale and the Keweenaw Peninsula, the lower unit is about 16–18 m thick and the upper unit is 12–14 m thick. Northeast of the inner (IR2) moraine, the upper unit is as much as 15–16 m thick in places.
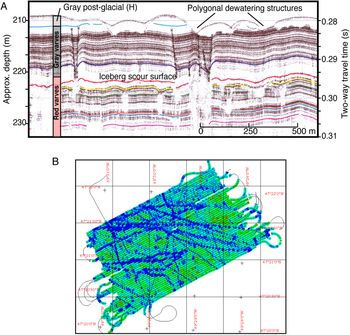
The horizon that separates the upper and lower sub-units of the glacial-lacustrine sequence is interrupted in many locations. In the CHIRP data, these disruptions take the form of gaps in the main horizon reflection, underlain by wedge-shaped zones of acoustic blanking, in which the closely spaced reflections of the surrounding areas have been homogenized (see Fig. 5). Although these features occur throughout much of the lower glacial-lacustrine unit, they are concentrated at the top of the lower unit. In many cases, the edges of the disrupted zones rise slightly above the horizon to which they are related. We infer that these features are the iceberg scours identified in 28-kHz echosounder data by Wattrus et al. (Reference Wattrus, Sharpe and Cartwright2006) (see Fig. 9). Disrupted or blank zones similar to those in our CHIRP data were observed in the echosounder data, and the close line spacing of those data allowed detailed mapping of the topography on the related surface (Wattrus et al., Reference Wattrus, Sharpe and Cartwright2006). Two-dimensional mapping (see Fig. 9) confirmed that the disrupted zones were the two-dimensional expression of iceberg scours, for which the troughs have a curvilinear plan form and slightly raised rims (Wattrus et al., Reference Wattrus, Sharpe and Cartwright2006). The scours are tens of meters across and as much as 6 m deep, extending for several km (see Fig. 9).
(A) Echosounder profile and (B) elevation map of an iceberg scour surface derived from a pseudo-3D seismic survey (Wattrus et al., Reference Wattrus, Sharpe and Cartwright2006) around the location of core LS00-3P (location shown in Figs. 1 and 2). The iceberg scour surface is equivalent to the surface between the upper and lower glacial-lacustrine units in this study (Glu and Gll). In the map, colors (tones) indicate relative elevation, blue (dark) being lowest. The iceberg scours are a few meters deep. (For interpretation of the references to color in this figure legend, the reader is referred to the web version of this article.)

Iceberg scours have been observed on the shallow exposed floor of Lake Superior, where the overlying sediments have been removed or were never deposited (Berkson and Clay, Reference Berkson and Clay1973). Iceberg scours have also been observed on the former floor of Lake Agassiz (Clayton et al., Reference Clayton, Laird, Klassen and Kupsch1965; Woodworth-Lynas and Guigne, Reference Woodworth-Lynas, Guigne, Dowdeswell and Scourse1990), as well as in many marine environments. The presence of these pervasive scours indicates the glacier was calving large tabular bergs like those seen in the Amundsen Sea embayment of Antarctica (Wise et al., Reference Wise, Dowdeswell, Jakobsson and Larter2017), rather than narrow bergs commonly observed in Greenland, which rotate once calved. These scours in the echosounder data appear to be identical to the features observed in our CHIRP data, and hence, we interpret all such features as troughs formed by icebergs dragging across the lake floor during deposition of the glacial-lacustrine sediments.
The glacial-lacustrine sequence is thickest midway between Isle Royale and the Keweenaw Peninsula, and both units thin toward the basin margins and bathymetric high points such as the two moraines. This pattern suggests differential deposition of the glacial-lacustrine sediments, with thicker deposition in deeper water. Both units have also been truncated by post-depositional, subaqueous erosion in shallow water.
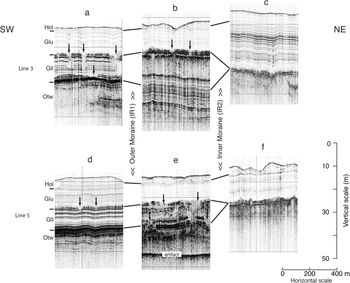
The lower unit of the glacial-lacustrine sequence (Gll) has a distinct distribution with respect to the two Isle Royale moraines. Gll is found only outside (southwest of) the inner (IR2) moraine and appears similar where it occurs between the two moraines when compared to its appearance outside (southwest of) the outer (IR1) moraine (Fig. 10). In many areas in between the two moraines, especially toward the inner moraine, the lower unit appears to be present, but its internal reflections appear to have been destroyed, resulting in a homogenized internal appearance (see Fig 10b and 10d). The upper unit of the glacial-lacustrine sequence appears similar throughout the study area, although it is somewhat thicker and has slightly higher-amplitude internal reflections inside (northeast of) the inner moraine (see Fig. 10c and 10e).
Segments of CHIRP profiles on two parallel CHIRP seismic lines (a-b-c and d-e-f) across the Isle Royale moraines. In each case, a segment outside (a and d), between (b and e), and inside (c and f) of the two moraines is shown, from southwest (left) to northeast (right). Locations of each segment (e.g., 10a) are shown in Figure 2. Bracketed labels show the relative positions of the IR moraines. Depth scale assumes a sound velocity of 1500 m/s.

The distribution of Gll with respect to the moraines is difficult to demonstrate in individual seismic profiles because the unit is relatively thin compared to the extent of the moraines. Nevertheless, tracing packages of seismic reflections throughout the network of CHIRP profiles in the study area leads to the conclusion that Gll is present only outside the inner moraine (IR2).
Because the lower unit of the glacial-lacustrine sequence is not present northeast of the inner moraine (IR2), the horizon that separates the two units, along which iceberg scour features are concentrated, occurs only southwest of the inner moraine. As a result, the iceberg scours, which are scattered through the lower unit of the glacial-lacustrine sequence and concentrated at its top, also are present only to the southwest of the inner (IR2) moraine. No evidence of iceberg scours was observed in the upper unit of the glacial-lacustrine sequence, which is present throughout the study area.
DISCUSSION AND CONCLUSIONS
The Isle Royale sub-basin of Lake Superior contains a variety of deposits and features related to the last retreat of the Laurentide Ice Sheet through the central part of the Lake Superior basin. Several till units exist, the uppermost of which likely relates to the youngest ice advance and retreat into the Isle Royale sub-basin. Tills beneath the uppermost unit are discontinuous and cannot be traced to specific moraines in the area. These till units may be related to slightly older advances and retreats during the last episode of glaciation in the basin, or they may be older yet.
Several prominent end moraines exist in the study area, lying more than 150 m below the modern lake surface on the southwest end of the Isle Royale sub-basin (see Fig. 1). Three moraines were described using sparse seismic-reflection data by Landmesser et al. (Reference Landmesser, Johnson and Wold1982) and were correlated with proglacial lake stages (Glacial Lakes Duluth, Washburn, and Beaver Bay) that developed during retreat from the maximum of the Marquette readvance (Farrand, Reference Farrand1969; Farrand and Drexler, Reference Farrand, Drexler, Karrow and Calkin1985; Breckenridge, Reference Breckenridge2013). Three moraines (I, II, and III) were also identified in the Isle Royale sub-basin by Breckenridge (Reference Breckenridge2013), primarily from topography. However, the identified moraines are not the same in the two publications. The Lake Washburn and Lake Beaver Bay moraines of Landmesser et al. (Reference Landmesser, Johnson and Wold1982) are the same as the moraines labeled I and II by Breckenridge (Reference Breckenridge2013), respectively, and these are the two moraines shown in Figures 1, 2, and 6. The Lake Duluth moraine of Landmesser et al. (Reference Landmesser, Johnson and Wold1982) is located to the southwest of the other two, while the III moraine of Breckenridge (Reference Breckenridge2013) is located to the northeast as seen in the bathymetry of the area (see Fig. 2).
Based on denser and higher-quality seismic data presented here, as well as our criteria for identifying moraines, we do not consider the Lake Duluth moraine of Landmesser et al. (Reference Landmesser, Johnson and Wold1982), nor moraine III of Breckenridge (Reference Breckenridge2013), to be moraines. There is relatively thick till with a broad convex-up upper surface southwest of Isle Royale in the one seismic line crossing shown in Landmesser et al. (Reference Landmesser, Johnson and Wold1982). However, our till isopach map (see Fig. 6) shows that this accumulation does not extend coherently to the southeast, across the flow direction of the ice, as expected for an end moraine. Also, this area of till accumulation displays none of the other criteria we use to identify morainal positions. Although the assumed correlations of the moraines to specific lake stages are plausible (Landmesser et al., Reference Landmesser, Johnson and Wold1982), they are largely assumptions based only on the sequence of events. We refrain from making such specific correlations for the remaining two moraines (IR1 and IR2) confirmed here. The III moraine of Breckenridge (Reference Breckenridge2013) appears to be a bedrock ridge draped with till of low but variable thickness. It is subparallel to the two well-defined morainal ridges, but it does not display any of the other criteria we use to identify stable ice-margin positions in which a moraine would form.
In our interpretation, two well-developed moraines, an older, outer one (IR1) to the southwest, and an inner, younger one (IR2) to the northeast, are found on the southwest rim of the Isle Royale sub-basin of Lake Superior, and are denoted here as the Isle Royale moraines. These are the same as the Washburn and Beaver Bay moraines of Landmesser et al. (Reference Landmesser, Johnson and Wold1982) and the I and II moraines of Breckenridge (Reference Breckenridge2013). Although the bulk of some end moraines in the region may be composed of stratified drift (e.g., Sharpe et al., Reference Sharpe, Pullan and Warman2007), the Isle Royale moraines are cored with till, clearly distinguished from stratified outwash. On the distal sides of the moraines, outwash grades into, and interfingers with, till, forming a depositional wedge (see Figs. 7 and 8). The IR moraines have some similarities to grounding zone wedges in Antarctica (Bart et al., Reference Bart, Anderson and Nitsche2017; McGlannan et al., Reference McGlannan, Bart, Chow and DeCesare2017), although the details of scale and mode of emplacement may differ, especially with regard to meltwater and outwash deposition.
As the Laurentide Ice Sheet last retreated through the Superior basin, it was continuously fronted by a glacial lake (Landmesser et al., Reference Landmesser, Johnson and Wold1982; Breckenridge, Reference Breckenridge2013). In plan view (see Fig. 2), the two moraines mapped in detail here have straight to concave down-ice traces, suggesting calving ice margins. In support of this interpretation, abundant features interpreted as iceberg scours or drag marks occur in the lower unit of the glacial-lacustrine sediments that were deposited in front of the moraines. In some cases, till beneath the moraines grades down-ice into a wedge of stratified outwash, creating an asymmetric cross-section. The subaqueous outwash thins and becomes less reflective away from the moraines. All of these characteristics suggest that the till, outwash, and glacial-lacustrine varves originated in a depositional environment similar to those in which sedimentation occurs at a submerged grounding line, in either lacustrine (e.g., Rust and Romanelli, Reference Rust, Romanelli, Jopling and McDonald1975; Sharpe et al., Reference Sharpe, Pullan and Warman2007; Geirsdóttir et al., Reference Geirsdóttir, Miller, Wattrus, Björnsson and Thors2008) or marine (e.g., Lonne et al., Reference Lonne, Nemec, Blikra and Lauritsen2001) environments. Understanding sedimentary processes and architecture at grounding lines in aqueous environments is important because of the critical role these environments play in the stability of marine ice sheets, such as the West Antarctic ice sheet (e.g., Rignot et al., Reference Rignot, Velicogna, van den Broeke, Monaghan and Lenaerts2011).
The relationships of the moraines to the varved glacial-lacustrine sediments in the basin are important for the history of the area. We have divided the glacial-lacustrine units interpreted in the CHIRP profiles into two sub-units. The lower of these units (Gll) occurs southwest of both moraines, but not northeast of the inner (IR2) moraine. It correlates with the red varves in core LS00-3P and other cores (Farrand, Reference Farrand1969; Dell, Reference Dell1972; Breckenridge, Reference Breckenridge2007). This interpreted distribution of Gll is entirely consistent with Dell's (Reference Dell1972) mapping of the distribution of red varved and non-varved glacial-lacustrine sediments based on numerous cores. The upper sub-unit (Glu) correlates with the gray varves at core site LS00-3P and at many other sites (Farrand, Reference Farrand1969; Dell, Reference Dell1972; Breckenridge, Reference Breckenridge2007).
The lower, red glacial-lacustrine unit does not occur inside the inner (IR2) moraine, and between the two moraines, the completeness of the lower red unit is difficult to determine because of disruption of its internal stratification (see Fig. 10), probably due to iceberg scour. From these relationships, we infer that the ice margin paused relatively briefly at the IR1 moraine, before retreating to the IR2 moraine. Most of the deposition of the lower glacial-lacustrine unit must have occurred as the ice margin stood at the IR2 moraine. A rapid retreat from IR1 to IR2 accounts for the lower unit of the glacial-lacustrine sequence being present in front of each of the two moraines. The retreat from IR1 to IR2 is also marked by iceberg scour marks within unit Gll (see Figs. 5, 9), suggesting that iceberg calving played an important role in a relatively rapid retreat.
The gray varves of the upper glacial-lacustrine unit are inferred to have been deposited as the ice retreated from the IR2 moraine out of the Superior basin. This retreat is marked by the distinct concentration of iceberg scour marks at the interface between the red varves (Gll) and the gray varves (Glu). The inferred rapid retreat from the IR2 moraine left little in the way of sediments below the upper glacial-lacustrine unit.
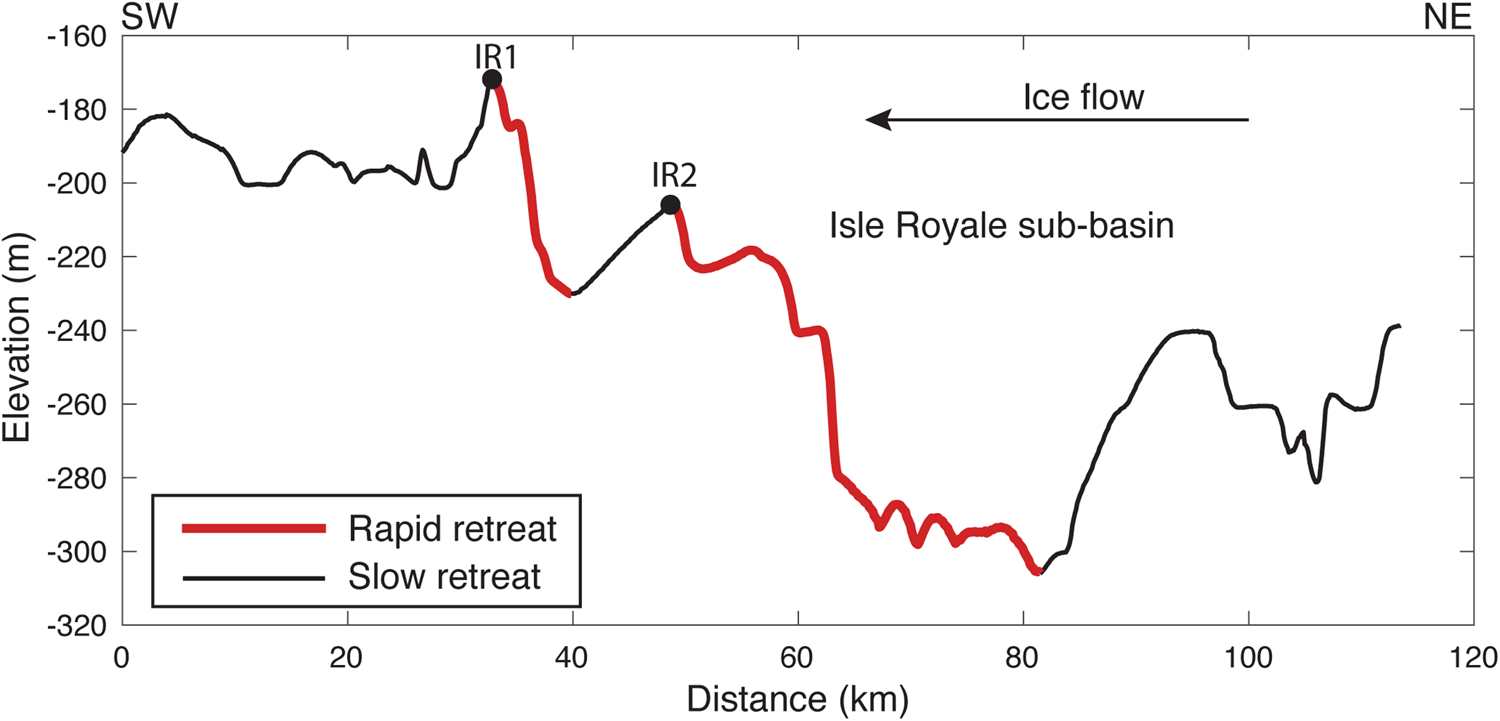
Mechanics similar to those evoked in marine ice-sheet instability could have caused the rapid retreat of the Superior lobe from the IR1 to the IR2 moraine and then subsequently caused further rapid retreat once the glacier became ungrounded from the IR2 moraine. To form the IR1 moraine the ice would have been grounded near the site of IR1 for a time sufficient to form this significant landform, although end moraines can form rather quickly if rates of sediment erosion and redeposition are high (Motyka et al., Reference Motyka, Truffer, Kuriger and Bucki2006). Behind the IR1 moraine, the bed slope is adverse to the ice flow direction (Fig. 11), potentially facilitating rapid retreat through increased calving rates or ice cliff instability. The water column depth in the vicinity of IR1 was a maximum of 475 m during moraine construction. The current depth to the bedrock surface is ~260 m (see Fig. 7), and at the time of moraine construction, the relative lake water level would have been ~215 m greater than present, based on the change in outlet of the lake and the differential uplift of the Lake Duluth shoreline between the moraines and the Portage outlet (estimated from Fig. 5 of Breckenridge [Reference Breckenridge2013]). A water column thickness of 475 m is insufficient to trigger the process of ice-cliff instability failure (Parizek et al., Reference Parizek, Christianson, Alley, Voytenko, Vaňková, Dixon, Walker and Holland2019), because the maximum height of a paleo ice cliff at flotation would have been ~48 m (~10% of the ice thickness if the ice front were near hydrostatic equilibrium), though active calving would still occur. Parizek et al. (Reference Parizek, Christianson, Alley, Voytenko, Vaňková, Dixon, Walker and Holland2019) estimated that a minimum ice cliff height of ~100 m is required to initiate the ice-cliff instability mechanism, indicating that ice cliff instability failure was unlikely when the IR1 moraine was formed, unless the ice was extremely weak from extensive crevassing. However, the adverse bed slope (see Fig. 11) would have promoted increased calving rates as the ice front retreated from the IR1 moraine.
Bathymetry profile through the study area roughly oriented along ice flow, showing the Isle Royale (IR) moraines on the southwest rim of the Isle Royale sub-basin (profile location shown in Fig. 1). Circles correspond to the location of the two moraines (IR1 and IR2). Ice flow is from right to left, and adverse slopes (signified by thick [red] lines) are found behind both IR1 and IR2. A significant retrograde slope is located behind the IR2 moraine. (For interpretation of the references to color in this figure legend, the reader is referred to the web version of this article.)

The large iceberg scours in front of the IR moraines imply that large tabular bergs likely calved from the front of the glacier, similar to bergs that create scours in the Amundsen sea embayment, Antarctica (Wise et al., Reference Wise, Dowdeswell, Jakobsson and Larter2017), rather than relatively thin bergs that quickly topple. The retreat of ice from the IR moraines would have caused ice to retreat into deeper water behind the moraine toward the center of the Isle Royale sub-basin (see Fig. 11). Because calving rates are generally proportional to water depth (Hanson and Hooke, Reference Hanson and Hooke2000), the retreat of the glacier into the deeper water would have increased the calving rates, thus causing a positive feedback leading to rapid retreat as the ice retreated into ever deeper water. This rapid retreat would have halted once the ice front encountered a bed that was sloping in the same direction as the ice surface. Such a bed slope extends ~10 km in longitudinal distance from the IR2 moraine outwards (see Figs. 8 and 11). As the ice stabilized where the basal slope was not adverse, the retreat would have slowed, allowing the formation of the IR2 moraine.
Similar episodic retreat has been modeled for Antarctic ice streams as they suddenly retreated from high point to high point (Alley et al., Reference Alley, Anandakrishnan, Dupont, Parizek and Pollard2007). Rapid retreat of this sort also has been projected for glaciers in the Amundsen Sea Embayment, where the bed slope is adverse to the ice surface slope. The retreat of the Superior lobe from the Isle Royale moraines may be an analog for those regions that experience rapid retreat from increased calving rates related to retreat down a retrograde slope.
In addition to the northeastward slope into the Isle Royale sub-basin, the localization of the Isle Royale moraines between the Keweenaw Peninsula and Isle Royale may relate to the lateral confinement of these two topographic high points, which provided substantial transverse stress to stabilize the ice front. The additional transverse stress in these areas would have allowed resistive stress to be transferred from the bed to the margins, thereby stabilizing the ice front long enough to build the moraines (see Fig. 1). The lack of substantial moraines in regions not pinned by Isle Royale (see Fig. 6) suggests that the transverse drag provided by Isle Royale was important in the formation of the moraines. The deposition of ice front ridges in regions of lateral confinement in the Superior lobe is similar to placement of ridges identified at Bindschadler Ice Stream, Antarctica, where the ice stream was laterally confined (Bart et al., Reference Bart, Anderson and Nitsche2017; McGlannan et al., Reference McGlannan, Bart, Chow and DeCesare2017; Bart and Tulaczyk, Reference Bart and Tulaczyk2020).
The glacial-lacustrine sequence has been cored in many places in Lake Superior (Farrand, Reference Farrand1969; Dell, Reference Dell1972; Mothersill, Reference Mothersill1988; Breckenridge, Reference Breckenridge2007; Hyodo and Longstaffe, Reference Hyodo and Longstaffe2011). Core LS00-3P is within the study area and can be directly correlated with the glacial-lacustrine sequence imaged in the CHIRP data (see Figs. 2, 5). The core contains abundant lithological variations, including color, grain-size, and chemical and physical properties (Breckenridge, Reference Breckenridge2007; Hobbs and Breckenridge, Reference Hobbs and Breckenridge2011). However, these detailed lithological changes, on scales of centimeters, are difficult to match with individual reflections in the acoustic data because of the acoustic interference patterns produced in laminated or thinly bedded sediments.
The dominantly red lower glacial-lacustrine unit in core LS00-3P represents roughly 300 years, based on varve counts, correlations, and estimated sedimentation rates, starting at about 10.7 cal ka BP (Breckenridge, Reference Breckenridge2007). However, the seismic data suggest that core LS00-3P did not reach the base of the glacial-lacustrine unit (see Fig. 4). Because this lower red unit is present only southwest of the IR2 moraine, we infer that it was deposited while ice retreated from its maximum Marquette-age position to the IR2 moraine. The similarity in the lower glacial-lacustrine unit between the IR1 and IR2 moraines, compared to the section southwest of the IR1 moraine, suggests that the ice paused only relatively briefly at the IR1 moraine, although long enough to build this substantial landform.
The amount of time necessary to build the moraines is difficult to estimate directly. The ice retreated from the site of core LS00-3P sometime before 10,700 cal yr BP and from the north shore of modern Lake Superior by about 10,200 cal yr BP (Breckenridge, Reference Breckenridge2007), but these ages do not provide a good estimate of the maximum amount of time available. Another approach is by possible analogy to modern tidewater Alaskan glaciers, whose rate of grounding-line moraine construction is largely dependent on subglacial sediment flux (Motyka et al., Reference Motyka, Truffer, Kuriger and Bucki2006). The Isle Royale moraines were probably not built any faster than those of the Taku Glacier (Motyka et al., Reference Motyka, Truffer, Kuriger and Bucki2006), for example. Observations and modeling of that glacier suggest that a 350-m-high moraine can be built in about 326 years (Brinkerhoff et al., Reference Brinkerhoff, Truffer and Aschwanden2017). By this analogy, we expect that the 60–100-m-high Isle Royale moraines each took several decades to a century or so to build.
The final retreat of ice from the Superior Basin, and from the IR2 moraine, is marked by the change from the lower, red glacial-lacustrine unit to the upper, gray glacial-lacustrine unit. This interpretation is in contrast to earlier suggestions that the color change in the glacial-lacustrine sequence was due to the ice margin leaving the Superior basin entirely (Farrand, Reference Farrand1969; Dell, Reference Dell1972). Our interpretation is that the lower (red) glacial-lacustrine unit is mostly restricted to areas southwest of the IR2 moraine, and that the color change from the lower to the upper glacial-lacustrine sequence occurs at the ice-berg scour horizon, which in turn marks ice retreat from the IR2 moraine. The extensive core data compiled by Dell (Reference Dell1972) also indicates that red glacial-lacustrine sediments are limited to areas west of the IR2 moraine in the western basin of Lake Superior.
To the east of the IR2 moraine in the Caribou sub-basin, probably once beneath a different sub-lobe of the Superior ice lobe, only thin outwash deposits overlie bedrock or till. Accordingly, the base of the glacial-lacustrine sequence in the Caribou sub-basin is younger than the base of the glacial-lacustrine sequence at core site LS00-3P located southwest of the moraines (Breckenridge, Reference Breckenridge2007). In the Caribou sub-basin, the thin outwash at the base is red in color, and it is overlain by roughly 100 red varves, 75 transitional red-gray varves, and 1360 gray varves (Breckenridge, Reference Breckenridge2007). The stratigraphy in core LS00-3P also suggests a short transition between uniformly red and gray varves (Breckenridge, Reference Breckenridge2007; Hobbs and Breckenridge, Reference Hobbs and Breckenridge2011). This transition may be related to brief, minor fluctuations in the ice margin, or to interactions between the ice lobe in the western Superior basin and the Marquette readvance lobe in the eastern part of the basin. In any case, the oldest gray varves in the Caribou sub-basin are directly dated to about 10.48–10.23 cal ka BP (9.156 ± 43 14C yr BP) in core #534 (Hyodo and Longstaffe, Reference Hyodo and Longstaffe2011). We infer that the base of the gray varves is equivalent in the Caribou and Isle Royale sub-basins, and that this age for the base of the gray varves closely dates the base of the upper glacial-lacustrine unit delineated in the CHIRP seismic data. In the Caribou sub-basin, the ~175 varves below the red-gray transition in core S62-8, extending to bedrock near core #534 (Breckenridge, Reference Breckenridge2007; Hyodo and Longstaffe, Reference Hyodo and Longstaffe2011), indicate deglaciation by about 10.7–10.4 cal ka BP. This is the only direct age for deglacial ice-margin position (apart from the Gribben Forest bed) in Lake Superior.
Lake Agassiz discharged into the Superior basin at various times during deglaciation. Eastward discharge prior to the Marquette readvance and the Younger Dryas cold period is controversial, but post-Marquette discharge of Lake Agassiz into the Superior basin is well documented (Teller and Mahnic, Reference Teller and Mahnic1988; Lewis and Anderson, Reference Lewis and Anderson1989; Teller et al., Reference Teller, Boyd, Yang, Kor and Fard2005; Gary et al., Reference Gary, Colman, Wattrus and Lewis2012). This discharge was copious and occurred through a progressive series of outlets into the Black and Nipigon Bays of Lake Superior (see Fig. 1; Leverington and Teller, Reference Leverington and Teller2003). Radiocarbon control on strandlines from the greater Lake Agassiz basin suggests that the discharge began about 10.5–10.3 cal ka BP (Teller et al., Reference Teller, Boyd, Yang, Kor and Fard2005), although more recent 10Be analyses suggest the Nipigon-phase drainage began by 11.0 cal ka BP (Kelly et al., Reference Kelly, Fisher, Lowell, Barnett, Schwartz and Gajewski2016) or earlier (Leydet et al., Reference Leydet, Carlson, Teller, Breckenridge, Barth, Ullman, Sinclair, Milne, Cuzzone and Caffee2018).
Our interpretation is that the red-gray varve transition corresponds to the interface between our upper and lower glacial-lacustrine units, and that this interface marks the retreat from the IR2 moraine, accompanied by a marked increase in calving and iceberg flux. An intriguing possibility is that these events are related: the opening of the Nipigon outlets, substantial discharge of water from Agassiz, rapid glacial retreat from the IR2 moraine, increased calving and iceberg scour, and a transition from red to gray glacial-lacustrine sediments. If so, the series form a coherent sequence of events. Previous suggestions that the red-gray transition was due to ice withdrawal from the Lake Superior basin (Farrand, Reference Farrand1969; Dell, Reference Dell1972) are not consistent with either the distribution of red varves in the basin (Dell, Reference Dell1972), or our seismic-reflection data, which indicate that ice was at the IR2 moraine at about the time of the red-gray transition. Teller and Mahnic (Reference Teller and Mahnic1988) first suggested that thicker, gray rhythmites were related to increased Agassiz discharge, although Thorleifson and Kristjansson (Reference Thorleifson and Kristjansson1993) argued against this on sedimentological and glaciological grounds. Breckenridge (Reference Breckenridge2007) suggested that three series of thick red varves just before the red-gray transition in LS00-3P might reflect the initial flooding of Agassiz into the Superior basin. Finally, the carbon and oxygen isotope values of carbonates in the varved sequence in Lake Superior (Breckenridge, Reference Breckenridge2007; Hyodo and Longstaffe, Reference Hyodo and Longstaffe2011) can been interpreted as reflecting input from a Lake Agassiz source at, or just before, the red-gray transition. Our conclusion is that the red-gray color change in the glacial-lacustrine sediments and the retreat from the IR2 moraine, along with the increase in iceberg calving, are likely related to an influx of meltwater from Lake Agassiz through the Nipigon channels.
The Grand Marais moraines, to the east of the Isle Royale sub-basin, define the Marquette readvance and are well dated from the Gribben bed (Lowell et al., Reference Lowell, Larson, Hughes and Denton1999). The Grand Marais moraines have been correlated with the Marks moraine (Zoltai, Reference Zoltai1963; Clayton, Reference Clayton, Teller and Clayton1983; Teller and Thorleifson, Reference Teller, Thorleifson, Teller and Clayton1983; Boyd et al., Reference Boyd, Teller, Yang, Kingsmill and Shultis2012) to the west (see Fig. 1), although the dating of the latter is less certain (see disscussion in Leydet et al., Reference Leydet, Carlson, Teller, Breckenridge, Barth, Ullman, Sinclair, Milne, Cuzzone and Caffee2018). In between, the equivalent of the Marquette readvance has long been thought to have filled the western arm of Lake Superior, extending to Duluth or farther (e.g., Farrand and Drexler, Reference Farrand, Drexler, Karrow and Calkin1985), where it has been called the Lake View advance (Clayton and Moran, Reference Clayton and Moran1982) in Wisconsin. Red tills and related sediments have been described near both the Wisconsin and Minnesota shores (Clayton and Moran, Reference Clayton and Moran1982; Hobbs, Reference Hobbs2004; Mooers et al., Reference Mooers, Larson and Marlow2005). Radiocarbon ages of about 11.7 cal ka BP, comparable to those from the Gribben forest bed, have been obtained from red sediments interpreted as tills or related to ice margins from several locations around the southwest end of Lake Superior (Hack, Reference Hack1965; Black, Reference Black and Mahaney1976).
Despite these observations, direct evidence for an ice-margin position in western Lake Superior is almost entirely lacking from either erosional or depositional landforms. Certainly, no landforms or deposits exist around the western arm of Lake Superior on the scale of the subaqueous Isle Royale moraines and associated deposits. However, small ridges that might be extensions of the Marks moraine into the western arm of Lake Superior have been observed in LIDAR data (Fig. 1; A. Breckenridge, unpublished data). The discrepancy between the stratigraphic evidence (red tills) and the lack of geomorphic (landform) evidence for the extent of the Marquette-age readvance in the western Lake Superior basin has led to the term “enigmatic Marquette readvance” (Hobbs and Breckenridge, Reference Hobbs and Breckenridge2011).
One possibility is that the Isle Royale moraines mark the terminal position of the Marquette-age readvance in the western part of the Lake Superior basin, and that the Isle Royale moraines are correlative with the Grand Marais moraines on the Upper Peninsula of Michigan and the Marks-Dog Lake moraines near Thunder Bay, Ontario. This interpretation was suggested by Hobbs and Breckenridge (Reference Hobbs and Breckenridge2011) in their discussion of the “enigmatic” readvance, but it requires that the radiocarbon ages of about 11.7 cal ka BP associated with red tills around the western arm are incorrect—either the ages are incorrect, or the associated sediments are not till and do not indicate the presence of a glacier. Also arguing against the IR moraines marking the Marquette-age maximum is the fact that no significant moraines or deposits correlative with the Isle Royale moraines have been described on the Keweenaw Peninsula or on Isle Royale itself, and no significant ice-margin positions were found in seismic-reflection data from the Isle Royale trough (between Isle Royale and the mainland) (Voytek, Reference Voytek2010). In addition, although the Grand Marais, the Isle Royale, and the Marks moraines are roughly all along the same isobase of postglacial isostatic rebound (Breckenridge, Reference Breckenridge2013) and hence regional average ice thickness, the Isle Royale moraines are many hundreds of meters lower in the landscape than the other two, arguing against their simultaneous occupation. Finally, if our inference that ice rapidly retreated from the IR2 moraine at about the time of Lake Agassiz influx into the basin and the transition from red to gray sediments is correct, then this final retreat was as much as a thousand years after the Marquette readvance buried the Gribben forest (Lowell et al., Reference Lowell, Larson, Hughes and Denton1999).
The other possibility is that Marquette-age ice advanced into the western arm of Lake Superior but left only scattered patches of red till and almost no geomorphic evidence. One possible exception is the northeastward termination of the “Epi-Duluth” shoreline, which could be interpreted as indicating an ice margin near Beaver Bay (Breckenridge, Reference Breckenridge2013). This shoreline is more deformed and therefore older than the Glacial Lake Duluth shorelines, formed during the retreat from the Marquette-Lake View maximum (Breckenridge, Reference Breckenridge2013).
A possible explanation for the scarcity of geomorphic evidence for the Marquette-age advance into the western arm of Lake Superior, albeit a highly speculative one, is that the Marquette-age ice lobe advanced over water-saturated lake sediments, in conditions that led to very low basal shear stresses, low surface slopes on the ice, and ice-stream-like behavior. After a rapid, ice-stream-like advance, the ice lobe may have retreated to a stable position such as that marked by the Isle Royale moraines, leaving little geomorphic evidence to the southwest. Clayton et al. (Reference Clayton, Teller and Attig1985) suggested that the southwest sector of the Laurentide Ice Sheet as a whole was prone to such sudden lobate advances. For the Marquette readvance, Lowell et al. (Reference Lowell, Larson, Hughes and Denton1999) argued against a sudden surge-like advance, instead suggesting control by climate during the Younger Dryas cold interval. Both ice-stream-like behavior and the climate forcing of the Younger Dryas may very well have been at play. In any case, the Isle Royale moraines are significant landforms. Given the seismic-reflection data presented here that document the size and structure of the Isle Royale moraines, as well as the related stratigraphy, the moraines are an important part of the deglacial history of the Superior basin.
ACKNOWLEDGMENTS
We thank Captain Mike King and the crew of the RV Blue Heron for all their help with the research cruises on Lake Superior. C.F.M. (Mike) Lewis, Jessica Gary, Dan Gustavson, and Emily Voytek participated in the 2009 cruise and helped with data collection and discussions. John Green discussed with us the bedrock that is likely beneath the lake in the study area. Helpful reviews were provided by Tom Lowell and three anonymous reviewers. Funding for this research was provided by the National Science Foundation under grants OCE-0421091 and OCE-0623607.