The extent to which firms use patents to protect their intellectual property rights is a central issue in the economics of innovation. It informs our understanding of how firms appropriate the returns to research and development (R&D) and how policymakers think about patent systems as a mechanism for stimulating innovation. To address these issues, scholars have frequently used innovation surveys of firms to examine the link between R&D and patents in the United States, Europe and Japan. While each survey has given rise to nuanced results, the main findings from each suggest that patents are a relatively unimportant means by which firms seek to protect their knowledge assets, and that the use of patents varies strongly across industries. A large and influential literature has emerged from these studies.Footnote 1
Less is known about patenting behavior by R&D firms historically. This article presents results from a data collection effort that uses patents and major surveys of R&D establishments conducted by the National Research Council (NRC). Beginning in the 1920s and for several years thereafter, the NRC compiled information on the fields of activity and the numbers of research personnel for a comprehensive set of firms with industrial R&D facilities and it published these in volumes titled Industrial Research Laboratories of the United States. These data have been used by David Mowery and Nathan Rosenberg to describe the institutionalization of industrial research during the early twentieth century, but they have never been fully matched with patent data.Footnote 2 I hand matched all 2,777 firms in the 1921, 1927, 1931, 1933, and 1938 surveys with patents granted in the United States, providing a profile of patenting activity linked to R&D firms during one of the most central phases in the development of U.S. innovation.Footnote 3
I analyze the data in two main ways. First, I measure the propensity to patent. I define a firm as patenting if it applied for at least one patent in the United States between 1921 and 1938 and the patent was subsequently granted. This provides a broad indicator of the use of the patent system by firms. I also allow for a closer temporal association between the patent application and the time a firm is observed in each survey by determining if a firm patented within a one year window of the survey year. I break down the patenting statistics by firm type (i.e., publicly traded), industry, and survey year and I also construct benchmarks using data on patenting by modern R&D firms. The data reveal strong variation in patenting by industry, which is similar to the results reported by scholars analyzing modern innovation surveys. However, compared to the modern samples, I find a more extensive use of patents by R&D firms in the past.
Second, using variables measuring resources devoted to R&D, the geographic location of R&D facilities relative to large cities, and industry of focus, I examine the drivers of the propensity to patent and their relative constancy over time. An attractive feature of the NRC data is that it covers drastically different macroeconomic environments: the expansion of the 1920s and the Depression of the 1930s. Innovation scholars often assume in their empirical work that the propensity to patent remains constant over time, without reference to hard evidence showing that the constancy assumption holds true.Footnote 4 If the propensity to patent varies over time, changes in patenting will be a highly imperfect proxy for changes in innovative activity. I examine cross-sectional variation in patenting and I also test for changes over time by comparing firms’ patenting behavior in the 1920s and the 1930s. The results show that the determinants of the propensity to patent and the distribution of patenting by industry remained highly persistent. Despite the major upheaval of the Great Depression, firms still used patents to protect their intellectual property rights in much the same way as they did during the 1920s. The evidence implies there was no change in the relative role of patents versus secrecy.
BACKGROUND: INNOVATION SURVEYS
Patent data has long played a prominent role in studies of innovation and patenting activity by R&D firms during the 1920s and 1930s can be contextualized by a broad research program designed to elicit the value of patents as a measure of technological change. Jacob Schmookler's pioneering work in the 1950s and 1960s popularized the idea that patent statistics provided a more accurate measure of underlying inventive activity than qualitative lists of “important inventions.”Footnote 5 Subsequently, a large empirical literature developed using patents as a measure of inventive activity, including research by economic historians.Footnote 6 Given concerns over the robustness of the relationship between patents and innovation, researchers began to investigate the effectiveness of patents for appropriating the returns to R&D. All of this work bypassed the historical material in the surveys compiled by the NRC.Footnote 7
In an oft-cited contribution, Erik Mansfield used a direct correspondence survey administered to a random sample of 100 firms drawn from the population of firms spending over $1 million on R&D in 1981. He found that that the impact of patent protection on the initial development or commercialization of innovation varied strongly across industries. It was most important in pharmaceuticals and least important in office equipment, motor vehicles, rubber, and textiles. Mansfield also found that although the patent system did not spur innovation, it was important for appropriability. He concluded: “firms generally do not prefer to rely on trade secret protection when patent protection is possible.”Footnote 8
The Yale Survey of 1983, analyzed by Richard Levin and his collaborators, also investigated the impact of patents on technological development through direct correspondence with 650 R&D executives of publicly traded firms. As in Mansfield's study, the Yale Survey showed that patent protection did not drive innovation, but Mansfield's earlier finding that firms did not rely on alternative mechanisms to protect their intellectual property rights was reversed. Patents were shown to be subsidiary to lead time, speed of learning, and complementary capabilities, such as sales and service, in appropriating the returns to R&D in both product and process innovation. The choice to maintain secrecy rather than to patent depended on how far public disclosure facilitated reverse engineering and “inventing around.” The survey results also revealed substantial interindustry differences in the propensity to patent, with patents being relatively more important than average in chemicals-related areas and in semiconductors.Footnote 9
In 1994 the Carnegie Mellon Survey was administered and the main findings for firms with $5 million or more in sales are described in work by Wesley Cohen, Richard Nelson, and John Walsh.Footnote 10 With broadly similar results to the Yale Survey on the differential propensity to patent across industries, the study also highlighted an intertemporal shift towards other mechanisms for protecting intellectual property, especially secrecy. The finding that secrecy matters for R&D firms has been verified for Europe,Footnote 11 Australia,Footnote 12 and for Japan with respect to process innovation.Footnote 13 Moreover, this is not just an empirical observation. James Anton and Dennis Yao show theoretically that secrecy will be chosen in the case of breakthrough inventions if there is incomplete information about the extent of an innovation, patent protection is limited and imitation is facilitated by disclosure.Footnote 14
Despite their attractiveness, there are several drawbacks to the innovation surveys. Zvi Griliches remarked of the ordered responses for the effectiveness of patents in the Yale Survey: “given the use of a scale of one to seven, I remain unsure about whether one person's response of five is equivalent to another's of four or six.”Footnote 15 Furthermore, the surveys are undertaken for mostly publicly traded firms, yet small enterprises may be more likely to pursue formal intellectual property rights to signal the likelihood of profitable entry in order to acquire venture capital funding, or to engage in the market for ideas more generally.Footnote 16 The surveys also tended to be conducted for snapshot years, so they cannot be used to test the assumption economists often make in their empirical work about the propensity to patent remaining constant over time. In the remainder of the article, I examine the patenting behavior of firms using some of the most comprehensive surveys of R&D establishments ever conducted.
DATA SOURCES, PATENT-TO-FIRM MATCHING AND DEFINITIONS
NRC Firms and Matched U.S. Patents
The NRC was organized in 1916 to advise the government on science and technology and its direct correspondence survey of industrial research and development was first administered with the objective of providing a directory of industrial research activities to meet the needs of government agencies. The original correspondence letter sent to firms states:
The purpose is to aid the government and the industries in the period of reconstruction and the years following, and thus to further the welfare of our nation and of the world through the advancement of American industry, engineering, and science.Footnote 17
The NRC defined research activities broadly. No sharp distinction between scientific and industrial research was made, although laboratories established through government funds or those tied to educational institutions were excluded. Letters were sent to firms “which by a liberal interpretation do any research work.”Footnote 18 The population of firms to survey was established using annual directories of firms. Scientific societies also provided lists of target firms and the NRC posted advertising notices in technical journals. The surveys drew a significant amount of attention within the R&D sector, and most firms were keen to be included. Although a study conducted by the Federal Works Agency Work Projects Administration suggests that some R&D firms may have been omitted from the 1921 survey, and therefore selection biases are possible, it also states that the coverage is complete by 1927 so any potential biases should be limited by this point in time.Footnote 19 The directory was updated and widely distributed.Footnote 20
Mowery was the first to systematically analyze the NRC data, providing significant insights into the organization of industrial research and development in the United States. He showed that R&D became increasingly institutionalized over time as scientific knowledge was applied to industry and imperfections in market mechanisms pushed innovation inside the boundaries of firms. Later work by Mowery and Rosenberg focused on the structure, organization, and performance of industrial R&D.Footnote 21 Further research has used the NRC data to analyze various aspects of innovation. Samples of NRC data have been used to show the important role of corporate R&D laboratories in mediating links between firms and independent inventors active in the market for technology.Footnote 22 Using NRC firm data and patents, Megan MacGarvie and Jeffrey Furman find a causal link between university research and innovation, which determined the early evolution of the pharmaceutical's industry.Footnote 23 Positive trends in R&D activity revealed by the NRC surveys have been used extensively by Alexander Field to show the Great Depression was a key decade of new technology formation and productivity growth.Footnote 24
To compile the data set, I first collected information on all 2,777 firms listed as being engaged in R&D in the 1921, 1927, 1931, 1933, and 1938 surveys. Major R&D firms operating centralized and decentralized R&D structures are included, such as General Electric, DuPont, Eastman Kodak, and AT&T. The data also include smaller firms undertaking research investment, such as the New England Confectionery Company, founded in 1847. It employed between one and three research workers at its factory in Cambridge, Massachusetts. Smaller and medium-sized firms are typically excluded from modern innovation surveys, which can lead to biased inferences if these firms exhibit different patterns of patenting behavior to those of large firms.
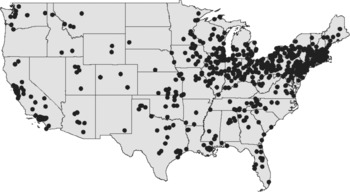
To sort firms into industries, I used descriptions in the NRC directories on fields of activity and SIC codes.Footnote 25 I constructed variables on the number of research labs a firm operated and the number of research personnel employed in R&D, both as proxies for firm size.Footnote 26 I also established the location of the labs relative to major urban areas using U.S. Census Bureau data on the 100 largest cities in the United States.Footnote 27 The concentration of innovative activity in urban areas is often attributed to the influence of positive demand environments and the potential for spillovers. Kenneth Sokoloff used patents to show the geographic concentration of patenting in urban areas in the nineteenth century, while Allen Pred shows that inventive activity as measured by patents was highly focused in cities of the United States between 1860 and 1910.Footnote 28 Figure 1 illustrates that R&D facilities during the 1920s and 1930s were geographically concentrated in the north east manufacturing belt. The top five states—New York, Pennsylvania, New Jersey, Illinois, and Ohio accounted for 57.9 percent of all laboratories. New York and Chicago accounted for 6.3 percent and 9.1 percent of labs respectively.
A key part of the data construction effort was the patent match. I used all United States patents issued during the 1920s and 1930s contained in the European Patent Office's (EPO) PATSTAT database. I used patents granted as of their initial application date to establish correspondence between the patent data and the NRC survey dates.Footnote 29 While studies of modern data use rules and text algorithms for matching, such methods were precluded by substantial text errors resulting from OCR processing of the original patent documents by the EPO.Footnote 30 To ensure an accurate concordance between firms and patents, names of firms listed in the NRC directories were hand matched with names of assignees in the patent data.
THE LOCATION OF R&D LABORATORIES, 1921 TO 1938

Defining the Propensity to Patent
An ideal test of the propensity to patent would be to compare the number of patentable inventions with the number actually patented. Because this information is not typically available for R&D firms, the literature has relied on proxy measures. F. M. Scherer utilizes a ratio measure defined as the number of patents per million dollars of R&D expenditure.Footnote 31 Point scales have also been adopted, most notably in the Yale and Carnegie Mellon surveys, where R&D lab managers were asked to rank the effectiveness of patents. Other researchers also examine zero versus nonzero patenting, but the bias towards publicly traded firms in their samples prohibits inferences about a broader population.Footnote 32
My main estimates use a discrete choice variable to identify firms that patented from those that did not. I define a firm as patenting if a match between it and a patent assignee occurred at any point between 1921 and 1938. I also adopt a more restrictive assumption to define a patenting firm if a match occurred within a year of a survey. Although the decision to patent revolves around complex issues related to the type of invention and interdependencies between different appropriability mechanisms,Footnote 33 this definition is useful for empirical purposes given underlying models of patenting behavior. The knowledge production function of Griliches assumes that patents are the outcome of research investment and that firms patent their new ideas almost instantaneously.Footnote 34 If firms undertake investments, some of which is applied in nature and therefore patentable, the discrete choice measure can be used to identify differences in the propensity to patent between firms in the data. Broader statistical inferences can also be made given the representative coverage of the NRC surveys.
TRENDS IN THE DATA
Summary Statistics and Modern Benchmarks
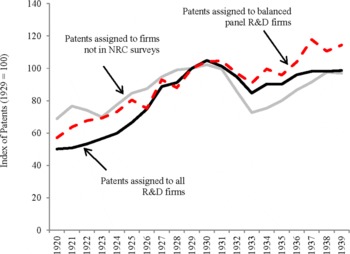
Figure 2 illustrates patenting by the R&D firms in the NRC surveys, both for all firms and balanced panel firms observed across the survey years. A series is also included for all patents assigned to firms not in the NRC surveys because innovation also took place in industrial corporations outside the formal boundaries of R&D establishments. The Federal Works Agency Work Projects Administration estimated that in 1938 approximately 150,000 U.S. manufacturing companies did not operate a research laboratory.Footnote 35
All of the series in Figure 2 are presented as indices. To get a sense of levels, NRC R&D firms applied for over 152,000 patents during the 1920s and 1930s that were subsequently granted, compared to 293,000 patents for firms not in the NRC surveys. NRC R&D firms accounted for around one-third of all assigned patents during this period, with the NRC share of all assigned patents rising from 31 percent during the 1920s to 37 percent during the 1930s. The level of patenting by NRC firms doubled during the 1920s and although it fell during the early 1930s, it quickly recovered. For a balanced panel of firms, patents returned to their 1929 level by 1934 and they increased by 26 percent between 1933 and 1939.
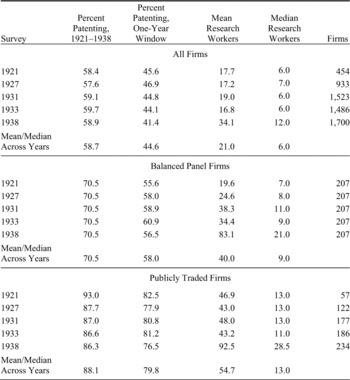
Descriptive statistics on the propensity to patent and on research employment are reported in Table 1. The statistics are given for all firms in the NRC surveys, firms observed in the balanced panel in all years, and for publicly traded firms.Footnote 36 Across surveys, 59 percent of firms patented at least once between 1921 and 1938, while 45 percent patented within a year of each survey. These figures rise to 71 percent and 58 percent, respectively for balanced panel firms and they are higher still at 88 percent and 80 percent for publicly traded firms. The statistics show that the propensity to patent was highly stable over time across all firm groupings. Approximately the same share of firms in the NRC surveys patented both in the 1920s and the 1930s.
PATENTING BY R&D FIRMS, 1921 TO 1938

Are the percentages shown in Table 1 large or small? To answer this question, I use patenting by modern firms. Although statistics from studies of modern R&D firms are not perfectly comparable, they do provide informative points of comparison. One study found that 68 percent of publicly traded firms (1,754 out of 2,582) patented at least once between 1965 and 1979, which is noticeably lower than the 86 to 93 percent of publicly traded firms patenting between 1921 and 1938 (Table 1).Footnote 37 For the population of manufacturing firms in the U.S. Census Bureau data, not just those undertaking R&D, Natarajan Balasubramanian and Jagadeesh Sivadasan found just 5.5 percent of firms owned a patent between 1963 and 1997.Footnote 38
THE PROPENSITY TO PATENT BY R&D FIRMS

Notes:
Percentages reflect matches between firms in the NRC data and United States patent applications between 1921 and 1938 that were subsequently granted. The patenting percentages are given for firms that patented at any point between 1921 and 1938 and within a one year window of each of the NRC surveys. Of the 2,777 firms in the data set, 2,549 reported research employment data. The number of firms listed is those for which research employment data are also available. The top panel reflects all firms in the data set, the middle panel those firms observed in every survey year, and the bottom panel is for publicly traded firms only.
THE PROPENSITY TO PATENT BY PUBLICLY TRADED R&D FIRMS

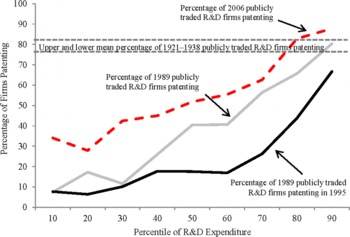
In Figure 3, I report the percentage of publicly traded firms patenting in the 1989, 1995, and 2006 cross sections of the NBER-Compustat data at different percentiles of their reported R&D expenditure.Footnote 39 The propensity to patent is increasing in the size of R&D outlays within the publicly traded sector. The most striking finding is that the share of all NRC publicly traded firms patenting in the 1920s and 1930s (the dashed lines in Figure 3) is higher than the share of firms patenting at the 70th percentile of R&D expenditure in the 2006 data and the 90th percentile in the 1995 data. This set of comparisons suggests that publicly traded firms relied considerably more on patents to protect their knowledge assets in the past.Footnote 40
Research Employment
Turning to the additional NRC data reported in Table 1, mean employment of research workers doubled for all firms, and publicly traded firms between 1921 and 1938 but quadrupled for the balanced panel firms, which indicates a striking increase in the resources devoted to innovation by surviving firms. While R&D firms observed some reduction in research employment during the nadir of the Great Depression, for the decade as a whole, growth in the employment of scientists and engineers was pronounced and even more so than the growth in patents illustrated in Figure 1. Between 1933 and 1940 aggregate R&D employment increased by a factor of 2.5.Footnote 41 To put this into perspective, it represents a much faster pace than the growth in the number of R&D scientists and engineers in R&D-performing companies reported by the NSF in any eight-year period from 1953 to the end of the twentieth century.Footnote 42
Industry-Level Variation
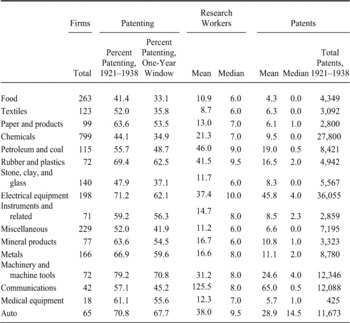
Table 2 breaks down the propensity to patent and research employment numbers by industry. To avoid small numbers of observations at the industry-level by survey year, I aggregated the summary statistics across all surveys.Footnote 43 An oft-cited result from the Yale and Carnegie Mellon innovation surveys is that the effectiveness of patents varies across industries. This pattern is also prevalent in the NRC data. The largest share of firms patenting is in machinery and machine tools and the smallest share is in food products.Footnote 44 The literature on innovation during the 1920s and the 1930s helps to illuminate mechanisms driving these differences.
DESCRIPTIVE STATISTICS BY INDUSTRY

Notes:
Firms are allocated to SIC codes given in the data appendix based on a description of their research activities in the NRC surveys. Research workers (columns 4 to 5) and patents (columns 6 and 7) are expressed as a mean and median across the survey years. Patent totals by industry (column 8) are for the time period 1921–1938.
Machinery and machine tools was a key industry during the early twentieth century. American manufacturers were technological leaders as demand inducements created by the diffusion of electricity led to the retooling of industrial establishments with a new generation of mechanical devices.Footnote 45 Important cross-industry linkages also acted as a catalyst to innovative activity and patenting. The growth of the automobile industry spurred development as high-speed machine tools drew on advances in automobile gearing and lubricants. Patent protection in this industry was necessary to reduce expropriation risk. Jochen Streb shows that U.S. advances in machine tools were copied extensively by German manufacturers, which encouraged U.S. firms to seek out patent protection both domestically and abroad.Footnote 46
The fact that food ranks lowest in the propensity to patent in Table 2 may reflect the long-standing issue that secrecy has always been a realistic alternative to patents in this industry. When the Netherlands abolished patents in 1869, the share of inventions in food processing it exhibited at the Philadelphia Exhibition in 1876 more than trebled over the share it exhibited at the Crystal Palace Exhibition in 1851.Footnote 47 Equally, it is worth noting that food is the second largest industry in terms of the total number of firms. The 1906 Food and Drug Act, which enforced food safety standards, gave rise to extensive research investment in this industry. For example, the Chicago-based meat producer, Swift & Co., operated 14 research facilities in the United States and two more in Canada, employed 97 research workers in 1938, and it applied for 149 successful patents between 1921 and 1938. More generally, firms took out patents on a range of products and processes such as cereals, syrups, heat sterilizing, and freezing. Rick Szostak asserts that output of cans doubled during the Great Depression as the food industry was relatively immune to the cyclical effects of the downturn.Footnote 48
A few other industries stand out in Table 2. Only a small share of chemicals firms patented, which is surprising given the prominence of patenting in this industry in the modern innovation surveys. However, the largest number of firms is observed in chemicals, and this industry accounted for the second highest number of total patents behind electrical equipment. Communications is one of the higher frequency patenting industries. Inventions such as cathode ray tubes used to create television images, could be easily reverse engineered, so patents and cross-licensing contracts dominated. The distribution of research workers and patents in this industry is skewed by the largest laboratory facility in the data set, Bell Labs, which was formed by AT&T in 1925 and had research employment of 3,008 in 1931. The auto industry accounted for a large number of patents and the average number of patents per firm was also high, indicating the large scale of resources devoted to innovation and the rise of dominant firms. Advances related to engines, brakes, transmissions, and automobile body shells, mark the 1930s as one of the most technically forward-looking phases in the industry's history.Footnote 49 During the early twentieth century, the auto industry also displayed a high propensity to patent.
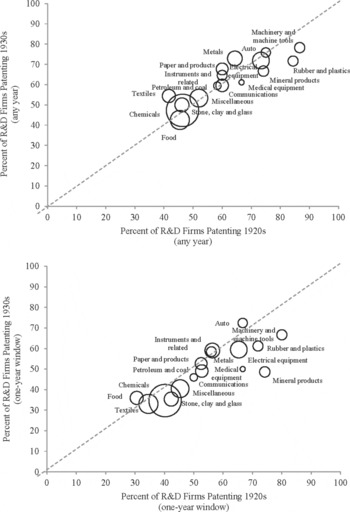
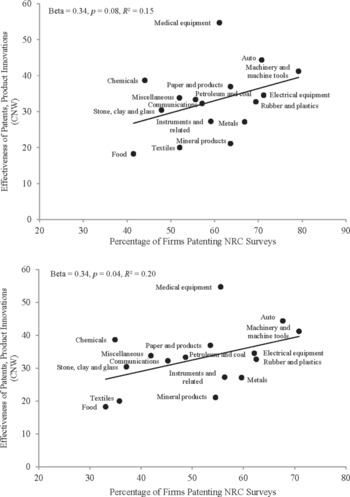
Industries that patented in the 1920s tended to do so in the 1930s. Figures 4A and 4B are scatter plots of the propensity to patent by industries. Using both definitions of the propensity to patent, the industry-level observations fall close to the 45 degree line, with strong positive and statistically significant correlations between the series in excess of 0.8. Additionally, patenting behavior during the 1920s and 1930s is correlated with patenting behavior in the late twentieth century as illustrated in Figures 5A and 5B. These figures plot the propensity to patent against the effectiveness scores by industry for protecting product innovations with patents reported in the prominent study of Cohen, Nelson, and Walsh.Footnote 50 Despite differences in the underlying composition of the samples and the methods used to assess the use of patents by firms, the correlations are strong. The R statistics indicate that approximately 15 to 20 percent of the variation across industries in the effectiveness scores can be predicted by variation in patenting across industries more than 50 years earlier and this rises to between 20 and 24 percent when the outlying sector of medical equipment is excluded.Footnote 51 This evidence of long-run persistence over time in the propensity to patent is plausibly related to fundamental differences across industries in the types of technologies being developed, which in turn determines whether patenting or secrecy is considered by R&D firms to be the most appropriate mechanism for protecting new inventions.
ESTIMATION
To test for statistical differences in the propensity to patent, I organize the data into an unbalanced panel with i indexing firms, j industries, k regions, and t survey years. I estimate probit specifications where p is an indicator variable to identify firms that patented from those that did not. Firms are coded as patenting if they patented at any point between 1921 and 1938, and if they patented within a year of a survey.Footnote 52 I use year dummies for survey years to control for any differences in the propensity to patent specific to each year but not varying cross-sectionally. I use region fixed effects to control for unobservables that vary over regions of the United States but not over time.Footnote 53 Specifications take the following form:
THE PROPENSITY TO PATENT BY INDUSTRY IN THE NRC DATA

THE PROPENSITY TO PATENT BY INDUSTRY OVER THE LONG RUN

![\[
\begin{array}{c}
\mathrm{E}\left[d_{i,\thinspace r},\Bar{\varepsilon }_{i,t} \right]=\thinspace \mathrm{E}\left[s_{i,r},\Bar{\varepsilon }_{i,t} \right]=\mathrm{E}\left[p_{i,r},\Bar{\varepsilon }_{i,t} \right]=0\thinspace \thinspace \thinspace \thinspace \thinspace \thinspace \thinspace \mathrm{r}\left(\mathrm{t-1} \right)\thinspace
\end{array}
\](https://static.cambridge.org/binary/version/id/urn:cambridge.org:id:binary:20160921005858766-0085:S0022050711002233:S0022050711002233_eqn1.gif?pub-status=live)
I estimate parameters for the industry dummy variables, R, and for the vector of firm-level variables, X. At the firm level, I use indicator variables for publicly traded firms and balanced panel firms observed across all of the surveys. I also capture the geographic location of R&D facilities relative to large cities. Firms located in dense urban areas that are conducive to knowledge spillovers may be more likely to protect their intellectual property rights through patents because secrecy is difficult to maintain in such environments. Since the propensity to patent is an endogenously determined choice variable, the parameters are not causal estimates. Instead, the objective is to determine if the unconditional shares from Table 2 are robust to the introduction of firm-level covariates and to test if the estimates change across the macroeconomic environments of the 1920s and the 1930s.
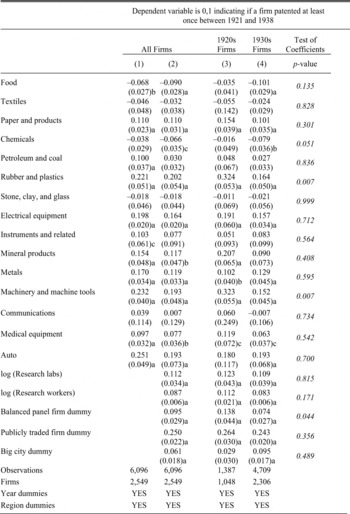
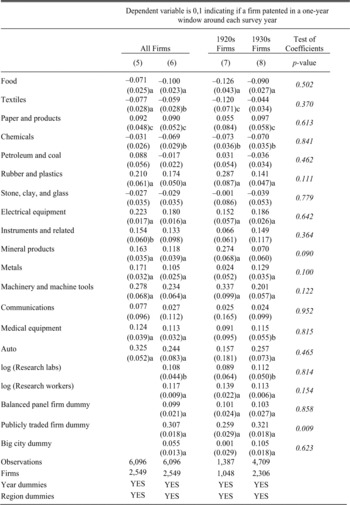
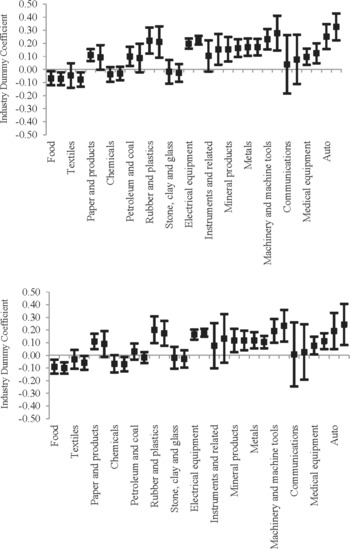
In column 1 of Table 3A, the coefficients measure the change in the probability of observing a firm patenting in a given industry relative to the baseline industry (miscellaneous) with year and region fixed effects. Patterns in the coefficients are consistent with those from the unconditional estimates in Table 2. The probability of a firm in the food industry patenting at least once between 1921 and 1938 is around 7 percent lower than in the baseline industry, whereas the patenting propensity is 23 percent higher in the machinery and machine tools industry. Figure 6A plots the 95 percent confidence intervals on the point estimates from columns 1 and 5, which shows these differences are robust to defining the propensity to patent using a one-year window around each survey year. Firms in eight industries exhibit statistically significantly higher propensities to patent than in food. The most precise estimates are for the electrical equipment industry, where the probability of a firm patenting at the bounds of the 95 percent confidence intervals shown in Figure 6A is between 16 and 26 percent higher than in the baseline industry.
DETERMINANTS OF THE PROPENSITY TO PATENT

DETERMINANTS OF THE PROPENSITY TO PATENT

Notes:
The estimates are marginal effects from probit models with discrete changes for variables measured as dummy variables. The 1920s firms are those in the 1921 and 1927 surveys, and the 1930s firms are those in the 1931, 1933, and 1938 surveys. Industry variables are 0,1 dummies. The baseline industry is “miscellaneous” and the baseline year is 1921. Research labs is a count of the number of labs a firm operated and research workers is a count of research personnel employed, both of which are reported in the NRC directories. The balanced panel dummy is coded 1 for firms observed in every survey year and the publicly traded dummy for firms with a stock exchange listing. The big city dummy is coded 1 if a firm was located in one of the 100 largest cities in the United States. The p-values are from Wald tests of the difference between the coefficients. Robust standard errors clustered by region are reported in parentheses: “a” is for significance at the 1 percent level, “b” for the 5 percent level, and “c” for the 10 percent level.
Columns 2 and 6 add the firm-level variables, which all enter positively with coefficients that are statistically significant. Because the coefficients on the number of research laboratories and research workers are measured in logarithms, they can be interpreted as elasticities. Holding the number of research workers at its mean and controlling for firm type and location, the estimates imply that a doubling in the number of research labs a firm operated is associated with an 11 percent increase in the probability of patenting. A doubling in the number of research workers, holding the research laboratory variable at its mean, is associated with a 9 to 12 percent increase. Although the propensity to patent could be driven by large economies of scale in patenting and by smaller firms being more likely to utilize the patent system to protect their intellectual property rights, I find no evidence for these relationships in the data. That is, the propensity to patent appears to be linearly related to measures of firm size.
The coefficient on the balanced panel firm indicator implies that surviving firms were approximately 10 percent more likely to patent, while the coefficient estimates in columns 2 and 6 on the indicator for publicly traded firms imply a 25 to 31 percent increase in the probability of patenting respectively. The results do not disentangle whether these firms were more likely to patent, other things equal, or because they were more accomplished at innovating in the first place. But they do suggest that the scale of resources devoted to innovation is a robust predictor of the decision to patent. Similarly, the association between firms in big cities and patenting is positive and statistically significant, which is consistent with firms being more likely to protect their intellectual assets using patents in urban areas. Regional specialization in manufacturing peaked in the 1930s, so firms in the same industry were more likely to be geographically close to one another.Footnote 54 Chemicals research was clustered in New Jersey, Delaware, and New York, automobile industry research in Michigan, rubber in Ohio, and petroleum research in Texas, Oklahoma, and California. The New York metropolitan area was a central location for research in electrical equipment and communications.Footnote 55 Tacit knowledge moves more freely in clustered environments, which possibly constrained the ability to use secrecy rather than patents.
INDUSTRY DUMMY COEFFICIENTS

When the estimation controls for firm size and other firm characteristics, the coefficients on the industry dummy variables change very little. The 95 percent confidence intervals shown in Figure 6B (including firm-level controls) are substantively the same as the intervals shown in Figure 6A, which are estimated without firm-level controls. The results suggest that the propensity to patent was highly industry specific.
Finally, the coverage of R&D firms active during the 1920s and the 1930s provides a unique opportunity to assess the relative constancy of patenting determinants across quite different economic settings. In Table 3, I estimate the propensity to patent separately for firms in the 1921 and 1927 surveys and for firms in the 1931, 1933, and 1938 surveys. I then assess differences between the coefficients using Wald tests. Out of 20 variables used in columns 3 and 4, only the coefficients on four indicate statistically significant differences in patenting between the 1920s and 1930s. The propensity to patent is lower during the 1930s in chemicals, rubber and plastics, machinery and machine tools, and for balanced panel firms. In comparisons of the coefficients in columns 7 and 8, only the coefficients on the dummy variables identifying firms in mineral products and publicly traded firms indicate statistically significant differences in the propensity to patent. In most industries, I find little evidence of changes in the propensity to patent across two of the most changeable decades in the twentieth century. Given the additional evidence presented in Figures 5A and 5B on the long-run persistence of differences in the propensity to patent across industries, the results likely are being driven by the nature of the technologies being protected and fundamental assessments across industries of the patent-secrecy tradeoff.
CONCLUSION
Modern innovation surveys have shown that industry of focus is a main driver of the propensity to patent but that in aggregate firms do not use the patent system extensively to protect their intellectual property rights. Summarizing this literature, James Bessen and Michael Meurer assert that, “firms do not patent a majority of their inventions and about 15 percent of all R&D is performed by firms that obtain no patents at all.”Footnote 56 Less is known about the relationship between R&D and patents historically. This article has presented findings from a comprehensive matched data set of patents and R&D firms active during a key phase of U.S. technological development. Similar to results reported for modern innovation surveys, I find strong evidence of cross-industry variation in the propensity to patent. But I also show that the patent system was used far more extensively by firms in the past. One implication is that patents may be a particularly useful measure of inventive activity in historical data sets of corporate R&D.
Another implication follows from the context in which the surveys were conducted. Data from the NRC surveys on the growth of research employment and the foundation of new laboratory facilities have been used to support the view that the Depression years were characterized by an important phase of new technology formation.Footnote 57 The new data matching R&D firms with patents reinforces this view. Notwithstanding sharp movements in major macroeconomic aggregates, patenting activity in the R&D sector as a whole was relatively unaffected by the economic shock of 1929 to 1933. Over four-fifths of publicly traded firms in the NRC data patented during the 1930s and the Great Depression appears to have had no effect on the tradeoff between secrecy and patent disclosure across industries.