INTRODUCTION
Future global food availability is determined by the ability of agricultural production to accommodate climate change, growth of world population, socio-economic development and changes in diets (Godfray et al. Reference Godfray, Beddington, Crute, Haddad, Lawrence, Muir, Pretty, Robinson, Thomas and Toulmin2010). On the global level, opportunities to increase the area of agricultural land are limited because of concerns about biodiversity loss, carbon emissions related to land conversion, climate change, soil erosion and competing claims such as bioenergy production and urbanization. The availability of relatively cheap nitrogen (N) fertilizer and the introduction of high-yielding semi-dwarf cultivars of wheat and rice have been major factors in raising crop production per hectare over the past 5 decades and hence curb land requirements for food production (Erisman et al. Reference Erisman, Sutton, Galloway, Klimont and Winiwarter2008; Spiertz Reference Spiertz2010). Since the mid-1960s, production of the major food commodities such as rice, maize and wheat increased by 50%, associated with only a 10% increase of area globally. In the European Union, the increase in scale and intensity of animal production, which is partly based on imported feed, has a major impact on N use and losses both from feed cultivation and the feeding operations (Westhoek et al. Reference Westhoek, Rood, van den Berg, Janse, Nijdam, Reudink and Stehfest2011). As a consequence of agricultural intensification, N emissions from agriculture have become a major cause of environmental problems at the local, regional and global scale (Sutton et al. Reference Sutton, Oenema, Erisman, Leip, van Grinsven and Winiwarter2011a ). Major hot spots of N emissions by agriculture in Europe are associated with high stocking rates and the production of manure (Lesschen et al. Reference Lesschen, van den Berg, Westhoek, Witzke and Oenema2011). This development underlines the importance of an increase in N use efficiency of animal-based production systems and a lower meat and dairy consumption by a shift towards less protein-rich diets.
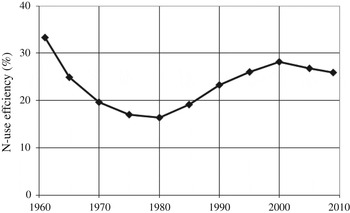
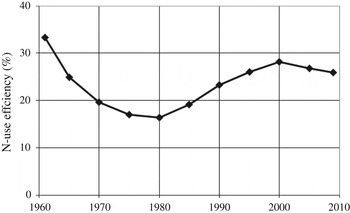
The Common Agricultural Policy (CAP) of the European Union (EU) was initially aimed at food security and self-sufficiency for major commodities (e.g. dairy, meat and cereals). As a result, the production of major commodities received a boost and resulted in surpluses in the 1980s, but also the intensive use of fertilizers and manure led to environmental problems (air quality, eutrophication and contamination) and a decrease in nitrogen use efficiency (NUE) between 1960 and 1980 (Fig. 1). From the early 1990s onwards, the CAP and Environmental Directives encouraged member states to take environmental measures (legislation, monitoring, etc.). As a consequence, manure was more effectively utilized on grassland and arable crops, with fewer losses to the environment (van Grinsven et al. Reference van Grinsven, ten Berge, Dalgaard, Fraters, Durand, Hart, Hofman, Jacobsen, Lalor, Lesschen, Osterburg, Richards, Techen, Vertès, Webb and Willems2012). Therefore the use of fertilizer N and phosphorus in agriculture was lowered, while yields per hectare continued to increase. This improved use of nutrients has led to an overall increase of NUE in European agriculture since 1980 (Fig. 1). An additional factor for Central and Eastern European countries was the political transition in 1989, causing a collapse in fertilizer use. Currently, however, environmental improvements are stagnating and policy targets, especially those related to water quality, are not within reach (van Grinsven et al. Reference van Grinsven, ten Berge, Dalgaard, Fraters, Durand, Hart, Hofman, Jacobsen, Lalor, Lesschen, Osterburg, Richards, Techen, Vertès, Webb and Willems2012).
Average nitrogen use efficiency (NUE) of the agricultural sector of the EU27. NUE values are derived from national N budgets, based on FAOSTAT data (http://faostat.fao.org/) on land use and fertilizer use, crop and livestock production, and trade of food and feed, by multiplying product volumes and their respective N contents.
The present paper assesses the role of N in food production and associated environmental impacts, focusing on Europe. It builds on the European Nitrogen Assessment (ENA; Sutton et al. Reference Sutton, Howard, Erisman, Billen, Bleeker, Grennfelt, van Grinsven and Grizzetti2011b ) and the European protein puzzle (Lesschen et al. Reference Lesschen, van den Berg, Westhoek, Witzke and Oenema2011; Westhoek et al. Reference Westhoek, Rood, van den Berg, Janse, Nijdam, Reudink and Stehfest2011; Stehfest et al. Reference Stehfest, van den Berg, Woltjer, Msangi and Westhoek2013). For various aspects, the findings reported in ENA are updated and put into a global context using recent assessments by the United Nations Environment Programme, the Inter-Governmental Panel on Climate Change, the Organisation for Economic Co-operation and Development and the International Assessment of Agricultural Science and Technology for Development, as summarized in Kok et al. (Reference Kok, Bakkes, Eickhout, Manders, van Oorschot, van Vuuren, van Wees and Westhoek2008), and using scenario analyses by Bouwman et al. (Reference Bouwman, Klein Goldewijk, Van der Hoek, Beusen, Van Vuuren, Willems, Rufino and Stehfest2011). The present paper further explores some options in addition to ENA for maintaining European and global food security while minimizing N losses to the environment. Details on data, calculation schemes and scenarios in the current review paper can be found in the abovementioned assessments.
ASSESSMENT
Global and regional outlook
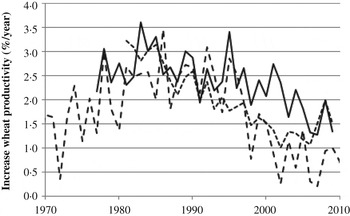
In the United Nations (UN) reference scenario, the world population will increase to 9 billion in 2050. Between 2000 and 2050, the total global caloric intake is expected to increase by 65% and the average global consumption of animal products is expected to double (Stehfest et al. Reference Stehfest, Bouwman, van Vuuren, den Elzen, Eickhout and Kabat2009). This compelling demand on the global food system will require an increase in the production of cereals in 2050 by about 60–70% (Bruinsma Reference Bruinsma2009; Godfray et al. Reference Godfray, Beddington, Crute, Haddad, Lawrence, Muir, Pretty, Robinson, Thomas and Toulmin2010). The share of cereals needed for livestock production will remain at about one-third. The total area of agricultural land of 47 million km2 in 2000 (with 31 million km2 in use for grassland and 5 million km2 for feed crops) is projected to increase to an area between 50 and 61 million km2 in 2050 (Van Vuuren & Faber Reference van Vuuren and Faber2009). The projected increase for cropland is 2 million km2 (Bruinsma Reference Bruinsma2009). Taking into account c. 3 million km2 of land use in 2050 for bioenergy production (Bouwman et al. Reference Bouwman, van Grinsven and Eickhout2010), the 60% increase in cereal production to meet the increased food demand in 2050 has to be delivered by an increase of productivity per hectare. Between 1970 and 2010, the annual wheat productivity initially increased to a mean value of 2·5% between 1980 and 1990, but from the end of the 1980s decreased to just above 1% globally and less than 1% in Europe (Fig. 2) and the USA (Dixon et al. Reference Dixon, Braun, Kosina and Crouch2009). An average annual increase by 0·8% would suffice but achievement of this level is uncertain, because of land degradation and climate change (Bruinsma Reference Bruinsma2009), among other reasons. While crop area in Europe is not expected to increase in the future, Olesen & Bindi (Reference Olesen and Bindi2002) concluded that warming is expected to lead to a northward expansion of suitable cropping areas.
Trends of the increase in wheat grain productivity since 1970 in Europe (—), The Netherlands (- - -) and globally (■ ■ ■ ■). NB: Trends are 20 years moving averages of annual data from FAOSTAT (http://faostat.fao.org/), for The Netherlands from CBS StatLine (http://statline.cbs.nl/statweb/).
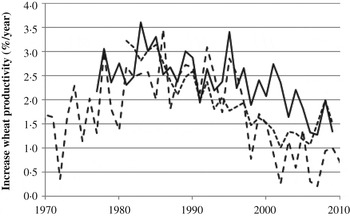
The trends in these average wheat productivities mask the underlying causes of the levelling off in crop productivity. Agronomic management, genetic effects and climate change (mainly extreme weather events) may play a role. In Western Europe, environmental policies and increased prices of fertilizer and relatively low commodity prices of cereals in the 1990s reduced fertilizer N use. Furthermore, the political transitions in Central and Eastern Europe caused a collapse in fertilizer use (Grzebisz et al. Reference Grzebisz, Gaj, Sassenrath and Halloran2012). Genetic gain in yield potential of bread wheat in France has increased linearly from the 1970s up to the present time (Oury et al. Reference Oury, Godin, Malliard, Chassin, Gardet, Giraud, Heumez, Morlais, Rolland, Rousset, Trottet and Charmet2012). However, since the end of the 1980s genetic progress has been partly or totally counterbalanced by the adverse effects of climate change on yields (Brisson et al. Reference Brisson, Gate, Gouache, Charmet, Oury and Huard2010). Wheat yields showed the highest sensitivity to warming during the grain-filling stage (Spiertz et al. Reference Spiertz, Hamer, Xu, Primo-Martin, Don and Van der Putten2006; Gourdji et al. Reference Gourdji, Mathews, Reynolds, Crossa and Lobell2013). In the last decade, short heat waves during grain filling occurred more frequently in Central and Northwest Europe. Thus, the response of crop yields to N will usually be affected by agroclimatic conditions as well as crop management (Spiertz Reference Spiertz2010).
Nitrogen, land use and crop production
Nitrogen fertilizer has been a key factor for increasing food production in developing countries in Asia (Green Revolution) as well as in many industrialized countries during the second half of the 20th century. Wheat yields in Western Europe increased from c. 4 tonnes (t)/ha in 1960 to 8 t/ha in the beginning of the 21st century. The magnitude of this yield response is in line with results for long-term continuous wheat trials at Rothamsted in the UK, where various nutrient management practices have been tested since 1843 (Goulding et al. Reference Goulding, Jarvis and Whitmore2008). A factor of four was reported for differences between the lowest and highest mean wheat yields in member states of the EU27 (Jensen et al. Reference Jensen, Schjoerring, Van Der Hoek, Poulsen, Zevenbergen, Palliere, Lammel, Brentrup, Jongbloed, Willems, van Grinsven, Sutton, Howard, Erisman, Billen, Bleeker, Grennfelt, van Grinsven and Grizzetti2011). This variation in yields is only partly affected by N use (dose, placement and timing): local growing conditions, plant breeding (semi-dwarf cultivars), irrigation, pest control, availability of other nutrients and an overall improvement of farm management also play a role. Using various sources, Erisman et al. (Reference Erisman, Sutton, Galloway, Klimont and Winiwarter2008) estimated that, globally, N fertilizer is responsible for c. 30–50% of the crop yield increase since 1960s. Such estimates should be viewed with some caution, because of the strong Genotype×Environment×Management interactions (Reynolds et al. Reference Reynolds, Trethowan, Crossa, Vargas and Sayre2002). Assessments of the contribution of genetic progress to raising yields show some variation.
Organic and low input v. intensive agriculture
It is difficult to single out the effect of synthetic N fertilizer on crop yields when comparing organic and conventional cropping systems (Erisman et al. Reference Erisman, Sutton, Galloway, Klimont and Winiwarter2008). De Ponti et al. (Reference de Ponti, Rijk and van Ittersum2012) estimated that for food crops the average yield gap between organic and conventional arable agriculture is c. 20%. Some crops, such as potato, respond more strongly to the lower availability of N in organic systems than cereals. The yield gap increased to >30% for the most productive regions in Northwest Europe. Taking into account the differences in cropping sequence between the two systems, the yield gap is bigger (Seufert et al. Reference Seufert, Ramankutty and Foley2012). Schröder & Sørensen (Reference Schröder and Sørensen2011) also infer an average reduction of land productivity in cropping systems of c. 30% without synthetic fertilizer and more efficient recycling of organic N sources, in view of the need to grow and plough under N fixing crops every third year. However, even with an average yield gap of 30%, some individual organic farms performed much better than conventional farms and these outliers are interesting cases to explore further.
Fewer data are available on organic dairy farming, but reported milk production per unit of land lie in the range of 70–100% of conventional yields, mainly due to lower stocking rates (Offermann & Nieberg Reference Offermann and Nieberg2000). An important aspect of the profitability of organic farms in Europe, besides saving on inputs, is receiving higher prices for organically produced goods than for those produced conventionally. The other aspect of organic farming is the more sustainable attitude of consumers of organic products, who tend to consume less meat products and fossil energy.
Nitrogen, land use and animal production
Meat and dairy consumption in the EU has increased steadily over the past 50 years from 25 kg of protein per capita in 1960 to over 30 kg in 2007. The EU average per capita consumption of meat is twice the world average and consumption of dairy products exceeds the world average by a factor of three (Westhoek et al. Reference Westhoek, Rood, van den Berg, Janse, Nijdam, Reudink and Stehfest2011). Total protein consumption per capita in Europe is 1·7 times the intake recommended by the World Health Organization. Overconsumption of (red) meat increases the risk of intestinal cancers (González et al. Reference González, Jakszyn, Pera, Agudo, Bingham, Palli, Ferrari, Boeing, del Giudice, Plebani, Carneiro, Nesi, Berrino, Sacerdote, Tumino, Panico, Berglund, Simán, Nyrén, Hallmans, Martinez, Dorronsoro, Barricarte, Navarro, Quirós, Allen, Key, Day, Linseisen, Nagel, Bergmann, Overvad, Jensen, Tjonneland, Olsen, Bueno-de-Mesquita, Ocke, Peeters, Numans, Clavel-Chapelon, Boutron-Ruault, Trichopoulou, Psaltopoulou, Roukos, Lund, Hemon, Kaaks, Norat and Riboli2006) and overconsumption of saturated trans fatty acids from animal products increases risks for cardiovascular health (Nishida et al. Reference Nishida, Uauy, Kumanyika and Shetty2004).
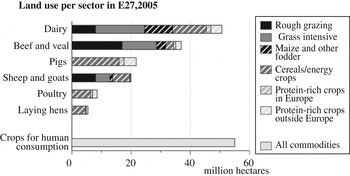
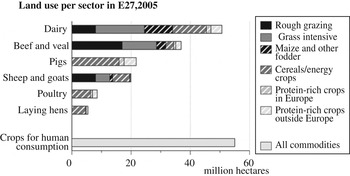
Modern industrial livestock farming has increased the efficiency of conversion of feed to food to 2–3 kg feed/kg of eggs or poultry meat and to 3–4 kg feed/kg pork (Lesschen et al. Reference Lesschen, van den Berg, Westhoek, Witzke and Oenema2011). As a result the increase in land demand for feed has slowed down. Nonetheless, feeding European livestock presently requires two-thirds (125–140 million ha) of the total agricultural land (Fig. 3). An additional 10–14 million ha is needed outside Europe for production of protein and oil-rich feedstuffs (Westhoek et al. Reference Westhoek, Rood, van den Berg, Janse, Nijdam, Reudink and Stehfest2011). Of the EU area allocated to animal production, about half (65–70 million ha) is grassland and half (60–70 million ha) is cropland used for growing cereals and silage maize. Consequently, less than half (50–60 million ha) of current arable land is used directly to produce food for human consumption. The average EU diet requires 0·4 ha per capita; 0·3 ha of this is for animal products and 0·02 ha lies outside the EU (inferred from Westhoek et al. Reference Westhoek, Rood, van den Berg, Janse, Nijdam, Reudink and Stehfest2011). As a comparison, this figure is much higher than the value of 0·12 ha per capita for the China plains (inferred from Liu et al. Reference Liu, He, Jin, Zhou, Sulewski and Phillips2011).
Land use per agricultural sector in EU27 in 2005 to feed livestock (Westhoek et al. Reference Westhoek, Rood, van den Berg, Janse, Nijdam, Reudink and Stehfest2011).
Nitrogen and the environment
Current high N losses to the environment are a partly inevitable consequence of current levels of production and consumption of food. Typically, NUE for cereal grain production on research plots (N recovery of fertilizer N in grain) in Europe is c. 40% and 60% when including straw (Ladha et al. Reference Ladha, Pathak, Krupnik, Six and van Kessel2005; based on data for 107 research plots before 2004). Nitrogen use efficiency values derived from experiments under optimal conditions tend to overestimate farm values due to unfavourable soil and weather conditions and/or suboptimal management (Cassman et al. Reference Cassman, Dobermann and Walters2002; Spiertz Reference Spiertz2010). Aggregated NUE values for European N budgets for agricultural land for the year 2000 range from 49 to 63% (de Vries et al. Reference de Vries, Leip, Reinds, Kros, Lesschen and Bouwman2011a ). Protein (or N) conversion efficiencies in livestock production range from 20 to 50% for poultry products, 15 to 30% in pork and dairy, and 5 to 13% in beef (Sutton et al. Reference Sutton, Howard, Erisman, Billen, Bleeker, Grennfelt, van Grinsven and Grizzetti2011b ). This implies that consumption of animal proteins involves a large indirect consumption of proteins supplied by feed, and thus of N inputs to produce the feed crops and of the associated N pollution.
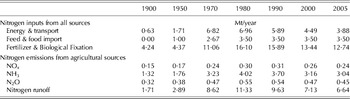
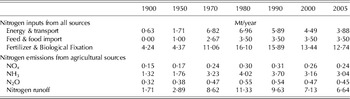
The total use of reactive N by agriculture in the EU27 increased by a factor of three in the 20th century and was c. 14 Mt in 2005, mainly in the form of chemical N fertilizer (Table 1; Bouwman et al. Reference Bouwman, Klein Goldewijk, Van der Hoek, Beusen, Van Vuuren, Willems, Rufino and Stehfest2011). This amount constitutes 75% of the total input of reactive N. Approximately 60% of the total emission to air and water is related to agricultural sources. Nitrogen pollution from agricultural sources has become the main cause of coastal eutrophication and depletion of stratospheric ozone, and contributes significantly to air pollution, contamination of drinking water, freshwater eutrophication, biodiversity loss and disruption of the greenhouse balance (Sutton et al. Reference Sutton, Howard, Erisman, Billen, Bleeker, Grennfelt, van Grinsven and Grizzetti2011b ).
Inputs and emissions of reactive nitrogen in EU27 (Bouwman et al. Reference Bouwman, Klein Goldewijk, Van der Hoek, Beusen, Van Vuuren, Willems, Rufino and Stehfest2011)
Nitrogen and society
It is difficult to convey the N issue to a wider audience (Sutton et al. Reference Sutton, Howard, Erisman, Billen, Bleeker, Grennfelt, van Grinsven and Grizzetti2011b ). Possible explanations are the complexity of causes and effects of N pollution, the dominant perception of people that N is good for food production and food security and the competition in the media with other compelling global environmental issues such as climate change and the looming water crisis. With regards to the climate and biodiversity issues, the communication of N footprinting and costs of N pollution for society should become more effective (Ingram Reference Ingram2008; Sonneveld & Bouma Reference Sonneveld and Bouma2003; Leach et al. Reference Leach, Galloway, Bleeker, Erisman, Kohn and Kitzes2012). Scientists should interact with stakeholders to develop innovative concepts based on sound production-ecological, environmental and socio-economic research to facilitate the transition to food systems that optimize N use from the farm level to the end-users.
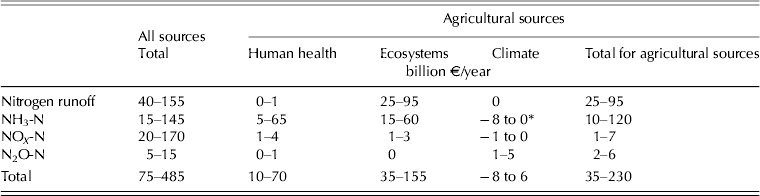
The N footprint of individual consumption patterns provides insight into the consequences of diets and underlying agricultural production processes (Leach et al. Reference Leach, Galloway, Bleeker, Erisman, Kohn and Kitzes2012). As for the economy of N it is important to acknowledge both the benefits and costs (Brink et al. Reference Brink, van Grinsven, Jacobsen, Rabl, Gren, Holland, Klimont, Hicks, Brouwer, Dickens, Willems, Termansen, Velthof, Alkemade, van Oorschot, Webb, Sutton, Howard, Erisman, Billen, Bleeker, Grennfelt, van Grinsven and Grizzetti2011). Nitrogen contributes to the farm income and gross national product by increasing agricultural output and for some regions by a positive export balance of agricultural products. The total value of agricultural production in the EU27 (including industrial processing) in 2008 amounted to >350 billion €/year, of which a large share (c. 40%) depended on the response of primary productivity to N. However, environmental pollution causes a loss of common goods and services. The total damage (or external cost) for the EU related to agricultural emissions of N has been estimated at 35–230 billion €/year (van Grinsven et al. Reference van Grinsven, Holland, Jacobsen, Klimont, Sutton and Willems2013) and appears to be in the same order as the (direct) economic benefits of N (Table 2). The largest cost for society from agricultural sources of N is due to ecosystem damage, of which two-thirds are related to N runoff and one-third to N deposition. The N cost due to impacts on human health appears to be considerable but is dominated by uncertain and debated effects of air-borne ammonium- and nitrate-containing salt particles. Currently, N appears to have no net climate-warming effect because the warming effects of agricultural emissions of nitrous oxide (N2O) are cancelled out by the current cooling effect of particles containing ammonia (NH3) (Butterbach-Bahl et al. Reference Butterbach-Bahl, Nemitz, Zaehle, Billen, Boeckx, Erisman, Garnier, Upstill-Goddard, Kreuzer, Oenema, Reis, Schaap, Simpson, De Vries, Winiwarter, Sutton, Sutton, Howard, Erisman, Billen, Bleeker, Grennfelt, van Grinsven and Grizzetti2011; de Vries et al. Reference de Vries, Kros, Reinds and Butterbach-Bahl2011b ).
Estimated economic losses due to environmental damage in the EU27 in 2008 caused by nitrogen emission from agricultural production and energy generation
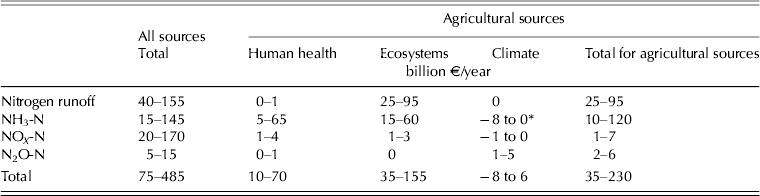
* Negative values denote climate benefits (cooling).
NB: values exceeding 10 rounded to the nearest 5 to avoid over accuracy.
Damage costs are based on surveys of willingness-to-pay to prevent environmental impacts of N and need further debate in view of large uncertainties and of conceptual issues (van Grinsven et al. Reference van Grinsven, Holland, Jacobsen, Klimont, Sutton and Willems2013). In spite of these issues, the comparable values of costs and benefits of N fertilization for the European food system suggest that lower fertilization levels, even when accompanied by a modest loss of crop production, could increase overall welfare. However, there is also large scope for progress by fine-tuning fertilizer management in agriculture (Powell et al. Reference Powell, Gourley, Rotz and Weaver2010; Oenema et al. Reference Oenema, Van Ittersum and Van Keulen2012) and recycling waste materials in the food system at large (Nakakubo et al. Reference Nakakubo, Tokai and Ohno2012).
Future nitrogen use
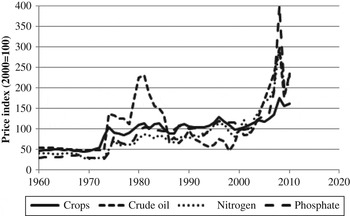
Global use of N fertilizer projected for 2050 (Erisman et al. Reference Erisman, Sutton, Galloway, Klimont and Winiwarter2008; Bouwman et al. Reference Bouwman, Beusen and Billen2009, Reference Bouwman, Klein Goldewijk, Van der Hoek, Beusen, Van Vuuren, Willems, Rufino and Stehfest2011) is very uncertain, because of the many drivers and options to increase N use efficiencies. Relative to 2000, projections of global use in 2050 range from double to a small decrease. In contrast, these scenarios show a consolidation for Europe in the use of N fertilizer and a small increase in manure production; however, only with a modest increase in nutrient use efficiency. A worst case scenario for global food security and N pollution would be a further shift to global animal protein-rich diets combined with an expansion of land allocated to bioenergy crops. The combined effect could result in escalating food and fertilizer prices, as was observed in 2008 (Fig. 4). The 2008 peak of fertilizer prices was attributed to a variety of reasons (Roberts Reference Roberts2009a ), the major one being a temporary shortage of supply due to a rising global demand by farmers and their intermediaries, which in part was an overreaction to increasing food commodity prices. Economic feedback should be able to counteract these trends, but current prices of fertilizer, food and fuel in developing countries are highly volatile.
Historic price trends in the USA of N and phosphate fertilizers and of crops (http://www.ers.usda.gov/data-products/fertilizer-use-and-price.aspx) and crude oil (http://www.wtrg.com/prices.htm).
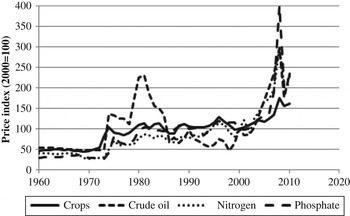
An alarming recent observation is that global N fertilizer use increased by >25% between 2000 and 2009, and already approaches the level that was projected by FAO for 2030 (Bruinsma Reference Bruinsma2003).
Challenges and options for Europe
The challenges to maintaining global food security while minimizing impacts due to N pollution are: increasing nutrient use efficiency, consolidating and preserving the quality of agricultural land and changing diets. Reducing food waste, amounting to 30% globally and in Europe, appears to be an easy and no-regret first priority. In Europe, consumers waste 20% of purchased food (Bellarby et al. Reference Bellarby, Tirado, Leip, Weiss, Lesschen and Smith2013), but reduction of this waste is difficult as it is deeply embedded in the food chain and in consumer behaviour in industrialized countries (Roberts Reference Roberts2009b ; Gustavsson et al. Reference Gustavsson, Cederberg, Sonesson, van Otterdijk and Meybeck2011). Complicating factors not yet included in most scenarios are the effects of climate change on agricultural production, and particularly for Europe, stricter demands on animal welfare, and controlling human health risks and use of antibiotics in animal production, which will probably decrease feed conversion efficiencies (Stehfest et al. Reference Stehfest, van den Berg, Woltjer, Msangi and Westhoek2013). However, in the long run new food sources such as proteins from aquaculture or insects, with low land requirements and high conversion efficiencies, may replace some of the current protein sources (Verkerk et al. Reference Verkerk, Tramper, van Trijp and Martens2007; Oonincx & de Boer Reference Oonincx and de Boer2012).
Major improvements in N-use efficiency may be expected from adapting the cropping systems to change in agro-ecological conditions. The shift from wheat to maize in warmer and dryer climates is one option (Timsina et al. Reference Timsina, Jat and Majumdar2010) and the introduction of legumes in cropping systems that are deprived of fertilizer N is another (Giller et al. Reference Giller, Rowe, De Ridder and Van Keulen2006). In a study by Parr et al. (Reference Parr, Grossman, Reberg-Horton, Brinton and Crozier2011), 16 winter annual cover crop cultivars were grown to assess total N accumulation, biological N fixation and organic-grown maize performance; their study showed that total N content of these cover crops ranged from 23 to 182 kg N/ha with most of it derived from biological N fixation. The recovery of this N source by the maize crop depended largely on crop management. A great opportunity for Europe is to substitute a large part of the imports of protein-rich feed by developing legume-based forage systems (Hirel et al. Reference Hirel, Tétu, Lea and Dubois2011; Peltonen-Sainio & Niemi Reference Peltonen-Sainio and Niemi2012). Furthermore, the introduction of smart technologies to develop agricultural practices in the Central and Eastern EU-member states and in the western states of the Former Soviet Union (FSU) will contribute to enhance land productivity and as a consequence a higher agronomic N-use-efficiency (Jensen et al. Reference Jensen, Schjoerring, Van Der Hoek, Poulsen, Zevenbergen, Palliere, Lammel, Brentrup, Jongbloed, Willems, van Grinsven, Sutton, Howard, Erisman, Billen, Bleeker, Grennfelt, van Grinsven and Grizzetti2011).
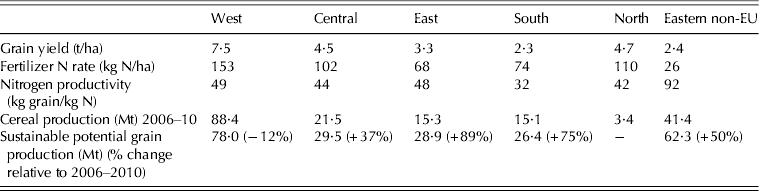
A well-integrated EU food and N policy would stimulate a transition from economically and agronomically optimal N fertilizer rates to environmentally optimal rates (Brink et al. Reference Brink, van Grinsven, Jacobsen, Rabl, Gren, Holland, Klimont, Hicks, Brouwer, Dickens, Willems, Termansen, Velthof, Alkemade, van Oorschot, Webb, Sutton, Howard, Erisman, Billen, Bleeker, Grennfelt, van Grinsven and Grizzetti2011; Good & Beatty Reference Good and Beatty2011). Using N damage costs from Brink et al. (Reference Brink, van Grinsven, Jacobsen, Rabl, Gren, Holland, Klimont, Hicks, Brouwer, Dickens, Willems, Termansen, Velthof, Alkemade, van Oorschot, Webb, Sutton, Howard, Erisman, Billen, Bleeker, Grennfelt, van Grinsven and Grizzetti2011), the optimal ecological and economical balanced N rates for winter wheat in Northwest Europe would be 30–90 kg/ha (median 55 kg/ha), 30% lower than current rates. The concurrent reduction in cereal yield according to conventional N response curves would be 1–2 t/ha (c. 15% lower for Northwest European yields) and could compromise food security. Yield loss from lower inputs of N fertilizer could be compensated for, to some extent, by adapting nutrient conservation and recycling practices of organic farming. Alternatively, this yield loss may be compensated by increased yields in the new member states of the EU27. For example Romania and Bulgaria hold 20% of the agricultural land in the EU27, while yields and N use are still low. Based on current yield gaps (Fischer et al. Reference Fischer, van Velthuizen, Shah and Nachtergaele2002), wheat production in Europe could be increased by 40 Mt (20%) relative to production in 2000–06 (Table 3) and the EU27 could thus become a net exporter of cereals. However, the EU decision to lift the milk quota system in 2015, for the very purpose of meeting the increasing demand for dairy in Asia, may absorb a large quantity of this potential yield increase. Decreasing food waste and meat and dairy consumption in Europe have a larger potential to lower feed demand and turn the EU into an exporter of cereals (Westhoek et al. Reference Westhoek, Rood, van den Berg, Janse, Nijdam, Reudink and Stehfest2011).
Grain yields, nitrogen fertilizer rates and nitrogen productivities in six European regions (FAO stat; 2006–10) and the estimated long term sustainable potential cereal production (Fischer et al. Reference Fischer, van Velthuizen, Shah and Nachtergaele2002; note for Western EU this yield is below current yield levels)
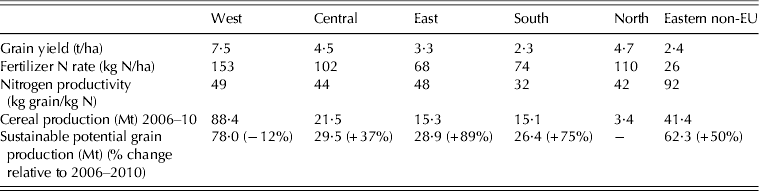
Moving part of the cereal production, and the associated high N fertilization and pollution per hectare, from Northwestern to Central and Eastern Europe could improve the balance between profit and sustainability in both regions. Expressed per capita per year, current N benefits in food production in Northwestern and Eastern Europe are €290 and 250, while pollution costs are €200 and 165, respectively (Table 2; van Grinsven et al. Reference van Grinsven, Holland, Jacobsen, Klimont, Sutton and Willems2013). A transition to simultaneously productive and more N efficient European agriculture would involve long-term targets and short-term incentives, combined with a vision on the future optimal structure and spatial layout of agricultural production. Ewert et al. (Reference Ewert, Rounsevell, Reginster, Metzger and Leemans2005) estimated future changes in crop productivity of wheat in Europe taking into account climate change and technology development.
IMPLICATIONS FOR POLICY AND RESEARCH
Theoretically, there are many technical possibilities for developing future food systems that are more N efficient, less polluting and yet productive. A strategy for implementing these possibilities requires not only technological and management innovations in the agri-food system, but also changes in governance and institutions. Global competition between land for food, feed, biodiversity or bioenergy, urbanization, recreation and nature is influenced strongly by policies for economy, trade, land use planning, agricultural and energy. Development of more efficient and less polluting production systems for food, feed and bioenergy can be stimulated by targeted public-private funding of innovations, while actual implementation can be enhanced by smart payment schemes, certification and agreements between large players in the food and energy chain. To find a better balance between increasing productivity and reducing pollution of agricultural production systems, both the internal and external costs of food production need to be quantified and discounted in food prices. The critical components of the food system need to be identified, where changes can make a difference for the performance of the system as a whole. In Europe, the best examples of N policies along these lines are those that have stimulated the reduction of fertilizer inputs and improved manure and ammonia management (housing, storage and application). These measures reduced losses of N considerably, but often with considerable costs for individual livestock farmers. From the perspective of the farmer, the recurring question is who will pay for a transition to more N efficient, less polluting farming systems that will probably be somewhat less productive per unit of land and labour, and less profitable when these additional costs are not covered by higher commodity prices. Stricter N policies for agriculture should go hand in hand with more targeted allocation of CAP payments and investments in research, technology and management tools enabling a more N efficient agriculture. Together with higher prices for N intensive and more polluting food products, this could provide part of the funds to compensate farmers for loss of production and costs of measures and transition. It could stimulate development of more resource-efficient farming systems that depend less on N fertilizer, and perhaps also a partial return to more N efficient spatially integrated feed and livestock production. A major challenge in the EU would be to decrease the individual land and N requirement for diets rich in meat and dairy by a change to more balanced (and healthier) diets that will not be more costly than current diets. Therefore, convincing or perhaps nudging consumers to eat less meat and dairy by communicating the associated health benefits and smaller ecological footprints could also be an effective strategy to decrease N pollution and increase food security. However, in spite of apparent benefits for public health and goods, governments are reluctant to interfere with what people eat, while the food industry and retail are very effective using marketing to influence food choices.