Introduction
Nanocomposites that mimic nature have been increasingly studied in the past two decades due to advances in the fields of nanoscience and nanoengineering. Biocomposites, such as nacre, bone, sponge spicules, and fish scales, consist of a softer phase that normally provides energy dissipation, toughness, and flexibility, and a harder phase that provides stiffness [e.g., Refs. Reference Curry1, Reference Meyers, Lin, Seki, Chen, Kad and Bodde2, Reference Meyers, Chen, Lin and Seki3, Reference Chen, Lin, Lin, Seki, Stokes, Peyras, Olevsky, Meyers and McKittrick4, Reference Barthelat, Rim, Espinosa, Bhushan and Fuchs5, Reference Dunlop and Fratzl6, and Reference Ehrlich, Simon, Carrillo-Cabrera, Bazhenov, Botting, Ilan, Ereskovsky, Muricy, Worch, Mensch, Born, Springer, Kummer, Vyalikh, Molodtsov, Kurek, Kammer, Paasch and Brunner7]. Their unique combinations of properties make them suitable for a variety of adaptations such as structural support, protection, and absorption of impact energy.
Within this broader context, bivalve Mollusca are important aquatic organisms ranging from freshwater through marine to hypersaline habitats, and from shallow to deep seas. They have a long evolutionary history, first appearing in the Lower Cambrian, and they show considerable taxonomic and adaptive diversity [Reference Bieler, Mikkelsen, Collins, Glover, González, Graf, Harper, Healy, Kawauchi, Sharma, Staubach, Strong, Taylor, Tëmkin, Zardus, Clark, Guzmán, McIntyre, Sharp and Giribet8]. Bivalves have been popular targets for understanding biomineralization and, in the field of biomimetics, bivalve shell formation has been studied with potential applications such as bone implants, where biological compatibility and strength are two key characteristics [Reference Kaplan9, Reference Rousseau and Pignatello10, Reference Kim, Kim, Kim and Rho11].
Bivalve shells consist of a hard calcium carbonate phase within a soft organic matrix. Microstructures with aragonite include nacre, prisms, crossed-lamellar, complex crossed-lamellar, and homogeneous. Calcitic microstructures include prismatic and foliated [Reference Bieler, Mikkelsen, Collins, Glover, González, Graf, Harper, Healy, Kawauchi, Sharma, Staubach, Strong, Taylor, Tëmkin, Zardus, Clark, Guzmán, McIntyre, Sharp and Giribet8]. Different taxa employ different microstructural arrangements that are clearly under strong genetic control [Reference Bieler, Mikkelsen, Collins, Glover, González, Graf, Harper, Healy, Kawauchi, Sharma, Staubach, Strong, Taylor, Tëmkin, Zardus, Clark, Guzmán, McIntyre, Sharp and Giribet8, Reference Taylor, Kennedy and Hall12, Reference Taylor, Kennedy and Hall13]. In the early days of mechanical testing, representative sets of elastic properties and strength were obtained for a wide range of species and, hence, microstructures using three-point bending, indentation, tension, and compression methods both on wet samples and samples which had been allowed to dry out (e.g., Refs. Reference Taylor and Layman14, Reference Currey and Taylor15, Reference Currey16, Reference Currey17, Reference Currey18, and Reference Jackson, Vincent and Turner19). The importance of keeping the sample wet was recognized by Jackson et al. [Reference Jackson, Vincent and Turner19] but, nevertheless, not usually applied. The more modern techniques of nanoindentation and finite element analysis (FEA) have been applied to nacre in order to try and characterize the properties of a natural biocomposite in terms of the aragonite and organic materials, which are present in proportions ∼95 and ∼5% [Reference Katti and Katti20, Reference Katti, Katti, Sopp and Sarikaya21, Reference Katti, Katti, Tang, Pradhan and Sarikaya22, Reference Katti, Mohanty and Katti23, Reference Tang, Barthelat and Espinosa24]. For example, the elastic modulus of nacre from a variety of species is ∼30–60 GPa [Reference Currey18] and FEA modeling gives ∼32 GPa for a “brick and mortar” microstructure in which the elastic moduli of the organic and inorganic phases are ∼20 and ∼100 GPa [Reference Katti and Katti25].
Shell strength with respect to mechanical failure provides an obvious benefit in terms of resistance to crushing predation, such as from fish and crabs, and abiotic collisions, for example with rocks or ice. However, although the advantages of strength are obvious, it is not necessarily so clear why there would be advantages with respect to particular elastic properties that are also determined by the microstructural arrangement of organic and inorganic components. The present study was designed to focus on elastic properties of selected bivalves by combining nanoindentation, four-point bending, X-ray tomography, and FEA. The four-point bending technique has been adapted for the particular problem of measuring elastic properties of samples that do not have anything like the regular shape that would be used for mechanical testing of engineering samples. Nanoindentation of wet samples has been used to determine local elastic properties of the same bivalves, for comparison with the macroscopic properties of the more complete shells. X-ray tomography and FEA have then been used to characterize the detailed elastic response of the prismatic microstructure of Pinna nobilis. This overall approach leads to a robust protocol for determining the elastic properties of biocomposites at both macroscopic and mesoscopic length scales.
Results
Microstructures and organic content
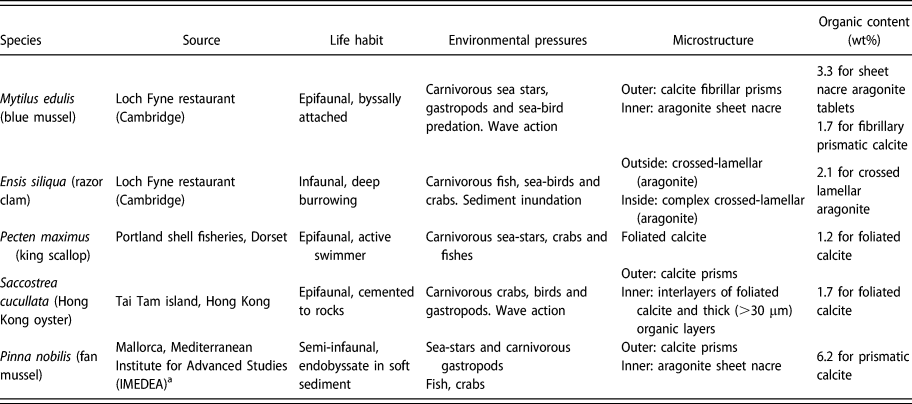
Representative thermogravimetric analysis (TGA) traces for each species are shown in Fig. S1(b) (Supplementary material). The organic content determined from them has been added to Table I, alongside a brief description of the known microstructures. The P. nobilis prismatic structure has the highest organic content (6.2 wt%) and P. maximus foliated calcite has the lowest (1.2 wt%).
Summary of the sources of bivalve species tested in this study, their known microstructures, and their organic contents measured by thermogravimetric analysis.

a Collected under permit.
Figure S1(a) (Supplementary material) shows an example of the weight loss sequence observed during heating at a rate of 10 °C/min from room temperature up to 700 °C in a nitrogen atmosphere. The first decrease, at around 100 °C, is due to loss of residual water. Organic matter is burnt off as the temperature rises from 100 to 500 °C. Above 600 °C, calcium carbonate starts to decompose, releasing carbon dioxide and causing the weight to decrease rapidly [Reference Balmain, Hannoyer and Lopez26]. Between 2 and 4 sets of measurements were taken on samples from each species, and the reproducibility of these is illustrated in the Supplementary material for the case of M. edulis.
Young’s modulus
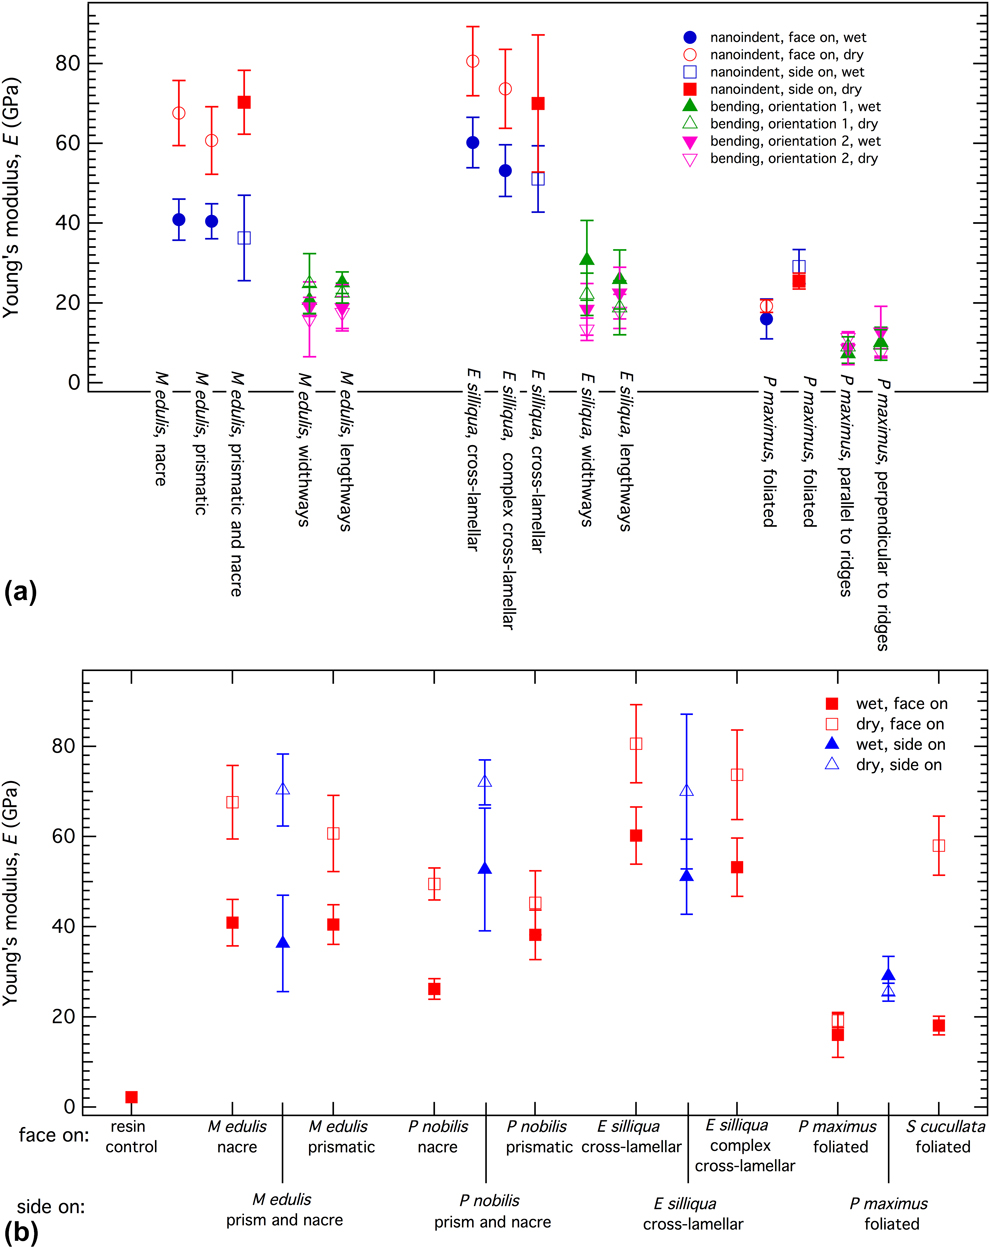
Average values from ∼20 separate measurements of the Young’s modulus from four-point bending for the shells of three species are shown in Fig. 1(a) and listed in Table SI (Supplementary material). As is clear from the figure, results for “wet” and “dry” measuring conditions are indistinguishable. Because of the layered microstructures of the shells, with the outer layer being different from the inner layer, it would be expected that four-point bending measurements should give different results depending on whether the concave surface of the shell is pointing upward or downward, as set out in the Methods section below. However, although there may be small differences for M. edulis and E. siliqua, the actual values overlap within realistic experimental uncertainty.
(a) Comparison of Young’s modulus values from four-point bending and nanoindentation measurements under both wet and dry conditions. (b) Nanoindentation data, ±1σ, from face-on and side-on measurements. There is no obvious anisotropy in the values for M. edulis and E. siliqua, but both P. nobilis and P. maximus are elastically stiffer in the side-on orientation than the face-on orientation. Higher values of the Young’s modulus are obtained under dry measuring conditions in comparison with wet, apart from for P. maximus.

In the nanoindentation tests, individual Young’s modulus values were determined as the mean value at a fixed depth, usually 400 nm, on the modulus–depth curves. In most cases, this is in the plateau region where a constant value has been reached, as in the example shown in Fig. S2(b) (Supplementary material). All the results for face-on measurements are compared with side-on measurements in Fig. 1(b), and the numerical values are listed in Table SII of the Supplementary material alongside other data from the literature (Refs. Reference Stempflé, Pantale, Rousseau, Lopez and Bourrat27, Reference Barthelat, Li, Comi and Espinosa28, Reference Bignardi, Petraroli and Pugno29, Reference Scurr and Eichhorn30, Reference Li and Nardi31, Reference Fleischli, Dietiker, Borgia and Spolenak32, and Reference Wählisch, Peter, Abad, Oliveira, Schneider, Schmahl, Griesshaber and Bennewitz33). In each case, the Young’s modulus under wet conditions (blue) is lower, i.e., more flexible/less stiff, than under dry conditions, except for P. maximus where the wet and dry values overlap. Side-on values overlap with face-on values only for M. edulis and E. siliqua.
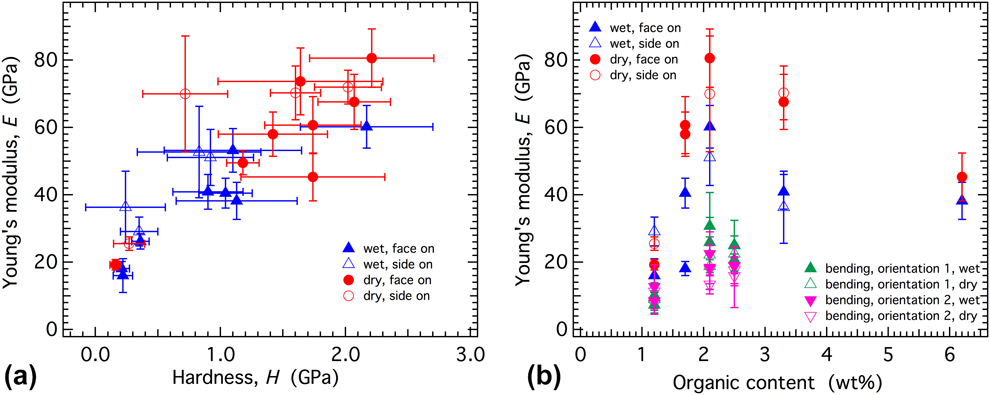
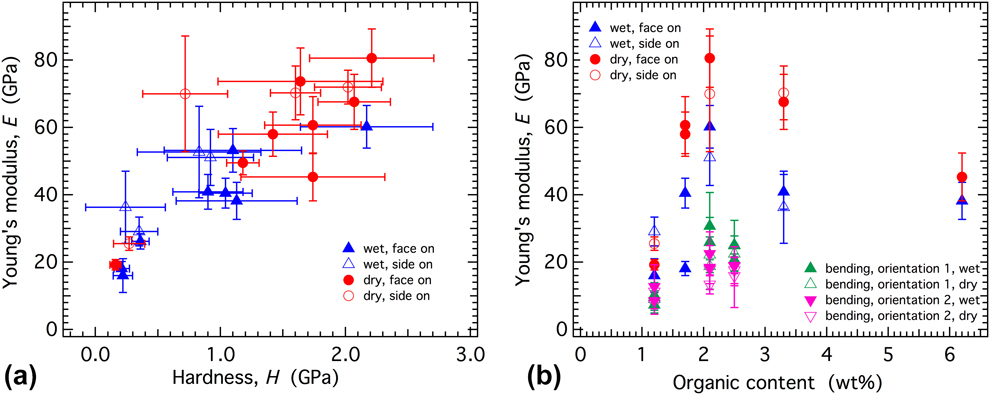
Values of the Young’s modulus from four-point bending are compared with the nanoindentation values for M. edulis, E. siliqua, and P. maximus in Fig. 1(a), showing that the four-point bending values are always lower than the values from nanoindentation. The difference is least for P. maximus. Although there is some scatter in the data, there is an overall correlation between hardness and the Young’s modulus from nanoindentation measurements [Fig. 2(a)], as would be expected if the response is predominantly elastic rather than plastic. By way of contrast, there is no overall correlation between the Young’s modulus and organic content [Fig. 2(b)].
Correlations of nanoindentation data. (a) Young’s modulus correlates with hardness for both wet and dry measuring conditions, but from (b) there is no overall correlation with organic content. The organic content used here for four-point bending of M. edulis has been taken as the average of the values given in Table I for nacre and prismatic calcite of this species.
Indentation measurements were also undertaken on the resin in which the samples were embedded. They showed no difference between wet and dry conditions, consistent with the view that the difference in Young’s moduli of bivalve shells under wet and dry conditions is real and not the result of a systematic measurement error from the nanoindenter.
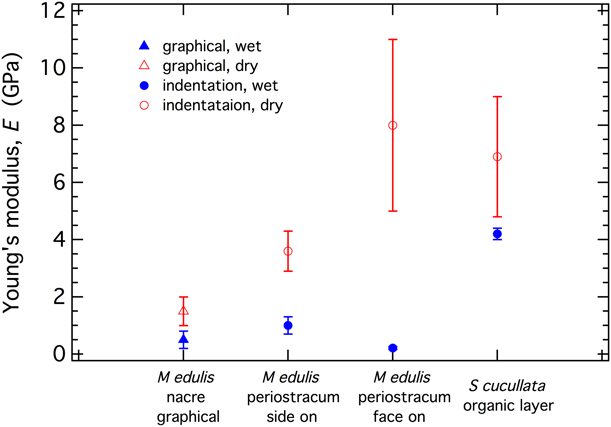
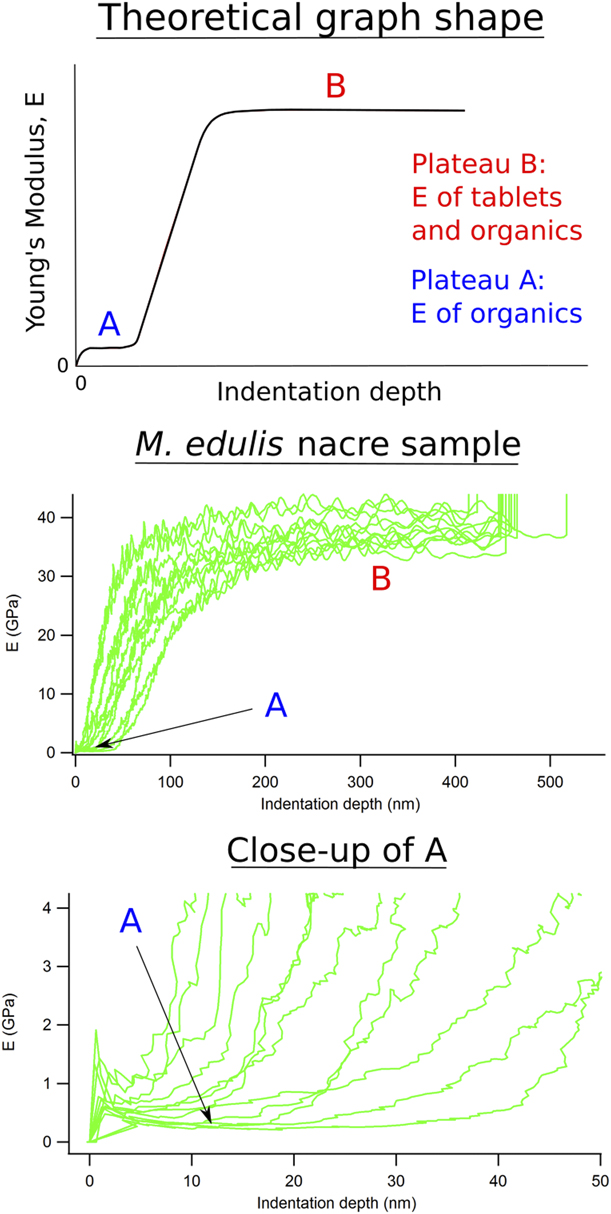
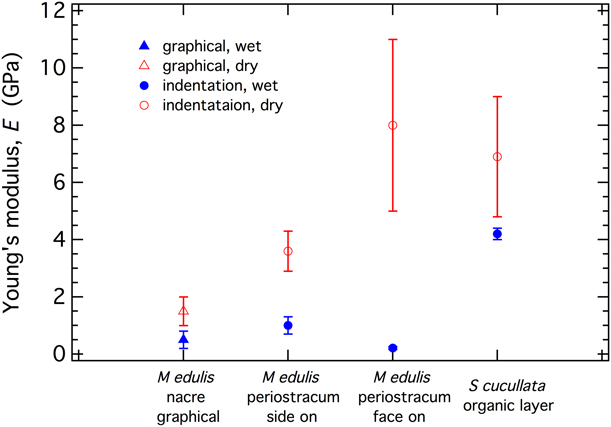
Young’s modulus values from measurements made by nanoindentation directly into organic phases and an estimate based on the graphical result shown in Fig. 7 for nacre in the shell of M. edulis are given in Fig. 3 and Table SII (Supplementary material). As seen from nearly all the other nanoindentation results, the organic phase shows a reduction in Young’s modulus when wet. The periostracum has a layered structure with variations of Young’s modulus in the range ∼0.5–1.75 GPa [Reference Wählisch, Peter, Abad, Oliveira, Schneider, Schmahl, Griesshaber and Bennewitz33], and the overall results for wet conditions are in the range ∼0.21–1.75 GPa. The “wet” value for Saccostrea cucullata determined in this study appears to be anomalously high, although it is not clear whether this is real or due to some unidentified experimental artefact. Values from the graphical method are at the lower end of the range of values from direct measurements, suggesting that at low loads the real response of nacre, at least, is overwhelmingly dominated by the response of the organic matrix.
Young’s moduli of the organic phase. The methods of determination are the graphical method (see Fig. 7) and direct indentation. The face-on values for Mytilus sp. shown here are from Wählisch et al. [Reference Wählisch, Peter, Abad, Oliveira, Schneider, Schmahl, Griesshaber and Bennewitz33].
Modelling results
Although it does not take into account the variations of elastic properties with orientation of single crystals of calcite, FEA has allowed a simple exploration of parameter space for the actual configuration of calcite crystals and organic material in the prismatic microstructure of P. nobilis. The calcite filler phase and organic matrix phase were first assumed to be isotropic, with Young’s moduli of 90 and 3 GPa, respectively. A Poisson’s ratio of 0.3 was assumed for both phases. This gives an orthotropic elastic stiffness matrix, [C ik] GPa (from the finite element-based numerical homogenization analysis), for the microstructure and reference axes shown in Fig. 4 as
 $$\left[ {\matrix{ {24.06} & {8.96} & {10.07} & 0 & 0 & 0 \cr {8.96} & {24.88} & {10.29} & 0 & 0 & 0 \cr {10.07} & {10.29} & {79.23} & 0 & 0 & 0 \cr 0 & 0 & 0 & {8.80} & 0 & 0 \cr 0 & 0 & 0 & 0 & {8.46} & 0 \cr 0 & 0 & 0 & 0 & 0 & {8.97} \cr} } \right]\quad .$$
As would be expected from a simple inspection of the prismatic microstructure, the matrix is close to being transversely isotropic (C 11 ≈ C 22, C 13 ≈ C 23, C 44 ≈ C 55). Values for components of the Young’s and shear moduli calculated from this elastic stiffness matrix are E x = 20, E y = 21, E z = 73, G yz = 8.8, G xz = 8.5, and G xy = 9.0 GPa.
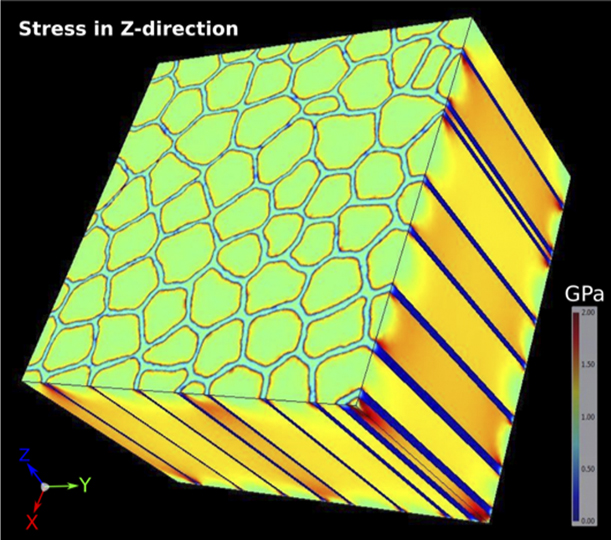
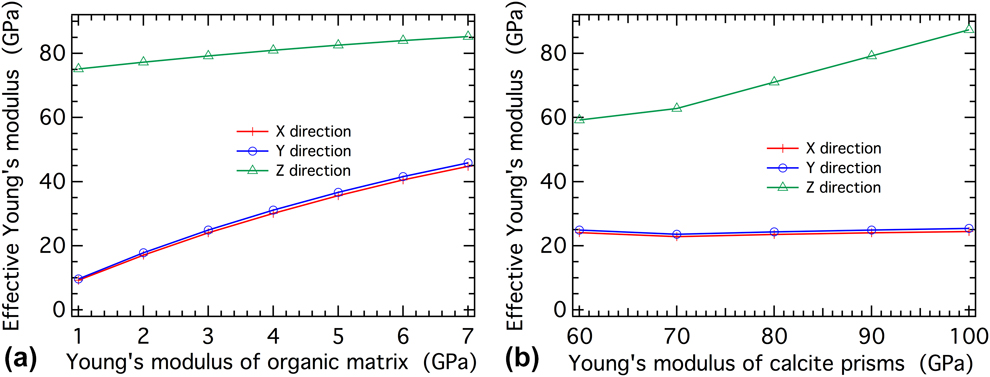
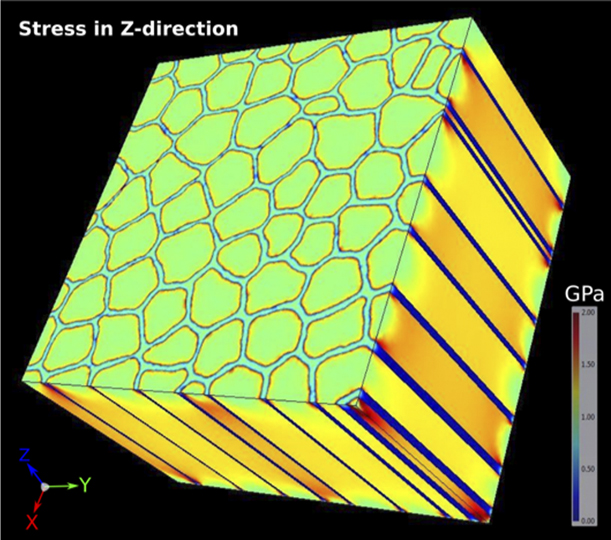
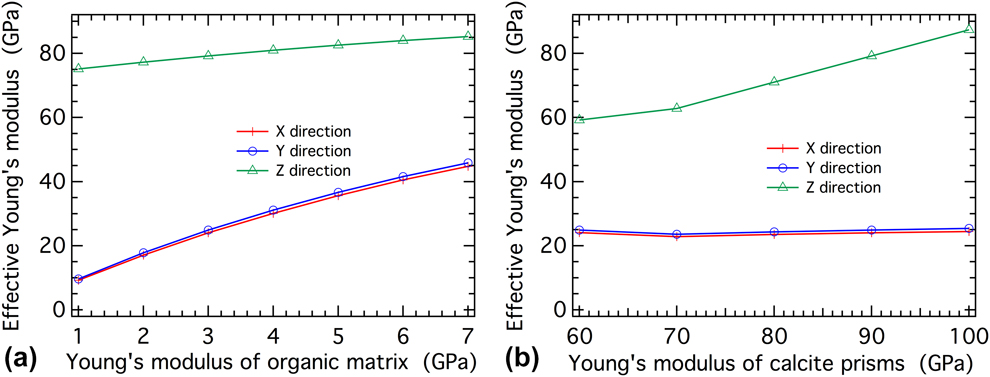
Figure 4 is an illustration of the stress distribution when a tensile force is applied in the Z-direction. The colder colors of the surrounding organic matrix show how the stress is accommodated essentially by the calcite crystals alone, although with a large stress build-up (red color) on the edges of the prisms near the interface. It follows that the calculated value of E z = 73 GPa is only slightly smaller than the value of E = 90 GPa assigned to the calcite. If the Young’s modulus of the organic phase is increased from 1 to 7 GPa while keeping E for the calcite fixed at 90 GPa, the effective Young’s modulus in the Z-direction remains relatively constant at around 80 GPa, close to the assigned stiffness of the calcite prisms (90 GPa) [Fig. 5(a)]. The influence of the organic phase is larger for other directions and, for the same increase of E for the organic phase, E x and E y increase from 10 to 45 GPa [Fig. 5(a)]. If the Young’s modulus of the calcite prisms is varied from 60 to 100 GPa and that of the organic phase kept constant at 3 GPa, E x and E y remain constant at around 25 GPa and E z increases from 60 to 90 GPa [Fig. 5(b)].
Stress distribution in the prismatic part of the shell of P. nobilis when tensile forces are imposed in the Z-direction (parallel to prisms). Calcite prisms are visible in green in XY plane and orange in ZX plane. The organic matrix is light blue (XY plane) and dark blue (ZX plane).
Sensitivity test showing variations of Young’s modulus in three principal directions for the prismatic microstructure shown in Fig. 4, as a consequence of (a) varying E of the organic phase while keeping that of the calcite constant at 90 GPa and (b) varying E (isotropic) for the calcite while keeping the value for the organic phase at 3 GPa.
Discussion
In a three-point or four-point bending experiment, compressional and tensional stresses occur along the length of the beam. For all measurements made in this study, the configuration of the beam had X (or Y) parallel to the length, with the stress applied parallel to Z. The measured components of the Young’s modulus are therefore E x or E y. These are generally lower than the values reported from three-point bending by Currey and Taylor [Reference Currey and Taylor15] for the two species in common (see values listed in Table SI of the Supplementary material) and generally lower than for all the other species as well. Despite the relatively large uncertainties associated with measuring the elastic properties of imperfectly shaped beams, it is likely that the new data are more accurate as a consequence of using four-point bending, which gives a more even distribution of strain.
Most of the shell microstructures are effectively uniaxial, as shown explicitly by the modeling of the prismatic structure of P. nobilis, so E x and E y are expected to be closely similar. The exception is where there is an additional macroscopic feature, such as strong corrugation in P. maximus, which gives a significant anisotropy within the plane of the shell [Fig. 6(a), Table SI of Supplementary material].
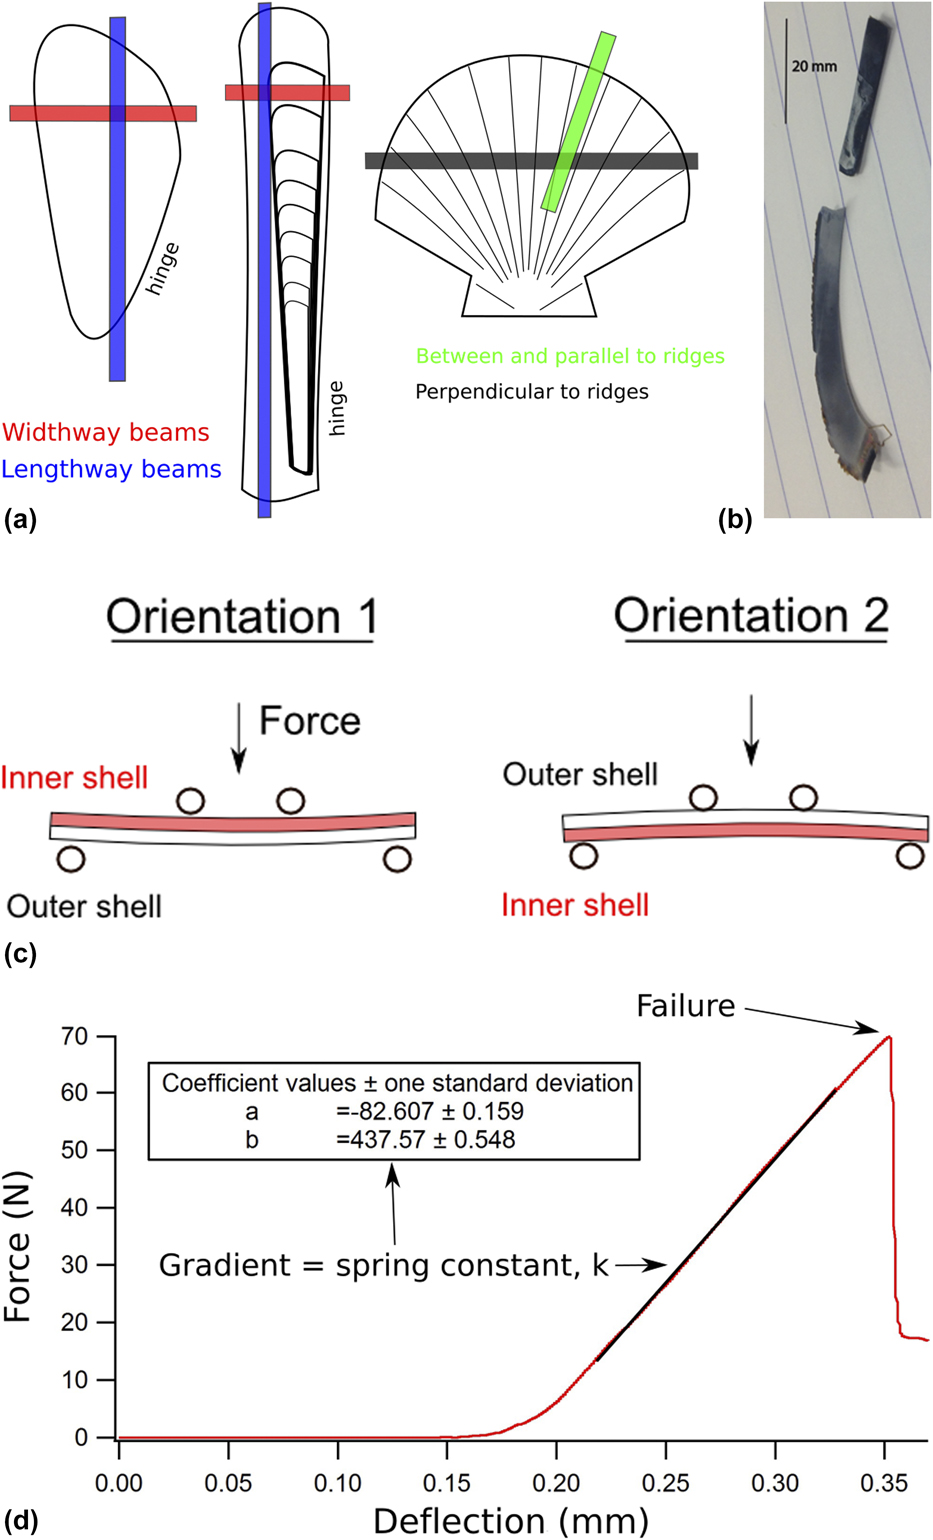
(a) Beam position with respect to the shell of the species tested: M. edulis (left), E. siliqua (center), and P. maximus. Width way beams = horizontal, length way beams = vertical. (b) Photograph of a cut beam from a M. edulis shell. The straight piece was used for four-point bending. (c) Illustration of the two orientations of beams used in four-point bending measurements. The Young’s modulus, E, is related to the width of the sample, w, its thickness, t, the distance between the two bottom supports, L (= 10.5 mm), and a force constant, k, by E = 0.21 kL 3/wt 3. k is determined from the slope of load (Force) versus displacement in the direction of the force, x. The distance between the two top beams was 4 mm. Four-point bending is likely to give a better estimate of the Young’s modulus than three-point bending, as a pure bending state occurs over the full distance between the lower supports in the former rather there being a peak stress at the midpoint of the beam in the latter. (d) Typical loading graph for an elastic material that undergoes brittle failure. The spring/stiffness constant, k, is the gradient of the linear loading region. This sample was a dry P. maximus beam cut parallel to ridges and loaded in orientation 2.

Nanoindentation measurements made in the face-on orientation give values of E z, whereas those made in the side-on direction measure E x (or E y). There are no significant differences with orientation, and this fits with previous observations by Bignardi et al. [Reference Bignardi, Petraroli and Pugno29] that there is no difference (within experimental uncertainty) between face-on and side-on measurements of the outer layer of P. nobilis, and between face-on and side-on measurements of the inner layer. There may be differences between side-on values of different layers, reflecting changes in microstructure, as in the case of Clinocardium californiense [Reference Ji and Li34]. However, nearly all the “wet” and “dry” values are significantly higher than any of the values from four-point bending obtained here. This seems to confirm the suggestion from Fig. 1 that strains are accommodated by the organic layers at low loads but that the Young’s moduli at higher loads are determined disproportionately by the calcite or aragonite filler.
The value of the isotropic Young’s modulus of calcite calculated from Voigt–Reuss–Hill average values of bulk and shear moduli given by Chen et al. [Reference Chen, Lin, Liu, Sinogeikin and Bass35] is 86 GPa, whereas E x = E y = 92 GPa and E z = 58 GPa from the same set of single-crystal elastic constants. Equivalent values for aragonite, using the single-crystal elastic constants given by Liu et al. [Reference Liu, Chen, Lin and Yang36], are 92 GPa and E x = 138, E y = 78, E z = 82 GPa. Some of the largest “dry” values from nanoindentation overlap with these and the variations between different microstructures, such as reported for crossed and complex crossed lamellar aragonite in C. californiense by Ji and Li [Reference Ji and Li34], are most likely due to changes in the preferred orientation of the carbonate crystals therefore. The nanoindentation data for P. maximus (wet and dry) and S. cucullata (wet) are the exception in showing close agreement with four-point bending, although the reason for this is not clear.
An additional influence may be from intracrystalline organic material, i.e., within individual carbonate crystals, that will reduce the stiffness in a similar manner to the effect of the organic matrix in the whole microstructure. Atomic force microscopy studies have shown, for example, that individual aragonite crystals in nacre themselves consist of nano-sized crystallites embedded in an organic matrix [Reference Stempflé, Pantale, Rousseau, Lopez and Bourrat27, Reference Li, Chang, Chao, Wang and Chang37, Reference Rousseau, Lopez, Stempflé, Brendlé, Franke, Guette, Naslain and Bourrat38, Reference Li, Xu and Wang39].
It appears that the effective Young’s modulus of the organic phases is a factor of two greater for dry than wet conditions (values listed in Table SII of the Supplementary material). This contrasts with the results for four-point bending, which are the same for wet and dry, and again highlights the influence of nanoindentation measurements being determined by very local conditions. Just allowing the surface to dry is sufficient to substantially modify the elastic properties of the organic phase in the immediate vicinity of the indent. A dry surface, on the other hand, does not affect the properties from four-point bending because the organic phase remains wet throughout the bulk of the sample. It is clearly important to make nanoindentation measurements with surface water actually present if a true measure of the bulk properties is to be obtained and it appears that a shallow indent is needed. On this basis, the best estimate for Young’s modulus of the organic phase when wet is in the vicinity of 1 GPa (Table SII Supplementary material).
The FEA of the prismatic microstructure of P. nobilis produces calculated values of the elastic properties that match up with observations. Taking reasonable values for the Young’s modulus of calcite (∼90 GPa) and the organic matrix (∼1–3 GPa) gives values of E x and E y in the range 10–20 GPa, which is in the lower range of observed values for other species from four-point bending (7–30 GPa). The prediction is also of a large anisotropy for this microstructure with respect to the difference from E z.
Apart from providing confirmation that the lower values of Young’s modulus from four-point bending are realistic determinations of the real elastic properties, the FEA results highlight an extreme anisotropy of properties arising from the prismatic microstructure. There appears to be only limited anisotropy within the plane of the shell, both from the finite element results and from four-point bending. Conventional four-point bending measurements could not be used to obtain E z because the shells are too thin to produce a beam that is long enough in the Z-direction, and it appears that nanoindentation does not give the true values of the biocomposite. It follows that finite element-based homogenization analysis based on actual microstructures from X-ray tomography may provide the only method for determining the total anisotropy of E z with respect to E x and E y.
Bivalves typically have two or more different microstructures as layers within the shell (Ref. Reference Bieler, Mikkelsen, Collins, Glover, González, Graf, Harper, Healy, Kawauchi, Sharma, Staubach, Strong, Taylor, Tëmkin, Zardus, Clark, Guzmán, McIntyre, Sharp and Giribet8, and see Table I). The interesting more general point is whether there is any ecological benefit to the particular configuration grown in each case. The primary role of the shell is to provide protection from external factors, such as predation, debris and wave action, and to seal the animal from fluid gain or loss when the shells are sealed. There is clearly an energy cost in producing a shell, both from the biomineralization of the crystalline phase and the production of the organic matrix. It is not so clear what adaptive advantage might be accrued from selection on the basis of elastic properties, particularly with respect to the proportion of the organic phase, the number of different layers, the precise microstructure of each layer, and whether aragonite or calcite is used as the filler. It is worth noting, also, that with a living organism inside, the total Young’s modulus is different from that of shell alone due to the hydrostatic pressure from tissues and fluids. Although the adductor muscles are contracted and the shell closed there is greater resistance to internal deflection, creating a stiff encapsulated entity.
An indication of adaptive behavior might be seen in any correlation with the life habit, and a summary of the local environments for the bivalve species considered in this study is given in Table I. Four-point bending data are needed for a wider range of species to address this question further but the most elastically soft of the three species for which there are four-point bending results happens to be P. maximus, which has the lowest organic content and is the only active swimmer. Harper et al. [Reference Harper, Checa and Rodríguez-Navarro40] found a prismatic structure with a high organic content of 7.4% in Entodesma navicula and suggested that the flexibility this might provide would allow a hermetic seal to form around the edge of the shell when closed, to prevent desiccation in the intertidal zone. The elastic properties have not yet been measured, however.
Conclusions
(1) Four-point bending can be used as a routine method for determining the elastic properties of bivalve shells and is likely to be more reliable than previously used three-point bending due to the more homogeneous distribution of stress along standardized slices of shell.
(2) FEA of a real segment of the prismatic microstructure of P. nobilis, obtained by X-ray tomography, confirms that the elastic properties of the biocomposite can be understood at least semiquantitatively in terms of realistic values for the Young’s moduli of the organic matrix and carbonate filler.
(3) Conventional nanoindentation measurements are highly sensitive to wet/dry conditions and should probably be undertaken only with the sample surface actually under water. Even under these conditions, however, they appear to give results that are biased toward the elastic properties of the carbonate filler rather than of the biocomposite as a whole.
(4) The combination of four-point bending, X-ray tomography, and FEA provides the prospect of yielding reliable data for how the elastic properties of mollusc shells might relate to the ecological niche each organism occupies. The first hint that elastic properties, as opposed to resistance to brittle failure or predation, could have some adaptational significance is that the only species with the capacity to swim, P. maximus, has the elastically softest shell.
Materials and methods
Samples
Five different bivalve species, selected for their known differences in microstructures [Reference Bieler, Mikkelsen, Collins, Glover, González, Graf, Harper, Healy, Kawauchi, Sharma, Staubach, Strong, Taylor, Tëmkin, Zardus, Clark, Guzmán, McIntyre, Sharp and Giribet8], were purchased live from seafood restaurants and dealers or received wet from marine research institutes (see Table I). The shells were kept wet at room temperature up to the time of the measurements.
Scanning electron microscopy (SEM)
The microstructures of each species were checked using a JEOL JSM-820 SEM (JEOL Ltd., Tokyo, Japan), for comparison with their known microstructures, using broken fragments of shell which had been gold coated. Samples which had already been subjected to nanoindentation were also gold coated to examine the indents. No indents were seen, however, possibly because they had recovered elastically.
TGA
TGA was used to determine the amount of organic matter present in each microstructure. The periostracum was first removed and pieces with a given microstructure isolated by sanding. Each piece was ground up by hand in a mortar and pestle approximately two to three days before TGA testing and therefore underwent a small degree of drying in air. Ten mg of powdered shell were placed in the platinum weighing basket of a TA instruments Q500 analyzer (TA Instruments, New Castle, Delaware) that has nominal precision ±0.01 wt% and ±1 °C. Total weight losses are lower bounds as a small degree of water, which could be superficial, such as from the shell being wet and/or from the organics, would have been lost before testing due to partial air-drying.
Four-point bending
Four-point bending measurements were conducted using a Tinius Olsen 5 kN Universal Test Machine (Tinius Olsen Ltd., Redhill, UK). To produce a standardized measuring protocol, beams were prepared as narrow strips of shell, 3 mm wide, cut from fresh shells with a water-cooled tile cutter. As illustrated in Fig. 6(a), this produced curved segments in two different orientations, width ways and length ways. The flattest part of the segment was used for the measurements in each case and the pieces that were to be bent under wet conditions were stored in water until they were mounted in the test apparatus. Figure 6(b) also shows a typical test beam obtained from slicing the shell of M. edulis. As part of the protocol for achieving maximum reproducibility, half the measurements on beams cut from the shells of each species were conducted with the inner part of the shell upward and half with the outer part upward [Fig. 6(c)].
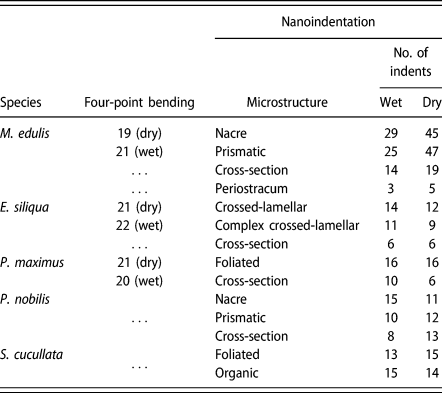
Figure 6(c) and caption provide a schematic description of the key parameters required to determine values of the Young’s modulus, E. A downward force, F [labeled force in Fig. 6(c)], results in a displacement, x, in the same direction, and the stiffness constant, k, is obtained from the slope of the resulting load–displacement graph, as illustrated in Fig. 6(d). The largest experimental uncertainty comes from defining the thickness, t, of the sample because it was not uniform along the length of each beam. Beams were bent until brittle failure occurred. The number of repeats for each sample is listed in Table II. Four-point bending tests were not conducted on the shells of S. cucullata or P. nobilis because of their small size but they could, in principle, be conducted using a miniaturized rig with smaller spacing, L, between the bottom supports.
Summary of the number of tests conducted using each testing method.

Nanoindentation
An MTS NANO Indenter XP and Oliver–Pharr methodology [Reference Oliver and Pharr41] were used to determine the Young’s modulus and hardness of different microstructures in polished samples. Stiffness was determined from the unloading portion of the load displacement curve (i.e., from the recovered elastic strains). Details of the calculation of hardness, H, and Young’s modulus, E, from the primary experimental data are given in the NANO Indenter® XP user’s manual.
Shell pieces with the desired microstructure were set in polyester resin, ground to expose the inner shell surface and incrementally polished from 400 grade emery paper down to 1 μm diamond polishing paste. Throughout the polishing process, and before mounting in the nanoindenter, the exposed shell sections were kept wet. During indentation, the samples were kept wet by a pool of water held in place by electrical tape wrapped around the resin block with its edge just above the top surface. A water depth of 1–2 mm was maintained throughout indentation, allowing the nanoindenter still to operate correctly. The anisotropy of properties was determined by measuring samples in cross section (side-on) and in the plane of the shell (face-on). Dry indentation tests were conducted on the same sample of each shell after a drying period of at least 48 h in air.
Well-polished regions of shell were chosen using a light microscope with a ×40 objective on the nanoindenter. For face-on indents, a preprogrammed 4 × 4 array with 25 μm spacing between indents was used. Cross section (side-on) indent locations were chosen individually in a transect across the shell. A 2 μm diameter spherical tip was used, as recommended by the Hysitron probe selection guide for polymers and biomaterials. Indentation to 700 nm depth ensured that both the soft organic phase and hard calcium carbonate phase were indented. (Nacre tablets are around 500 nm thick.) A Poisson’s ratio value of ν = 0.3 was chosen for the calculations, as recommended by MTS NANO indenter XP hand book and used in similar indentation studies [Reference Barthelat, Espinosa and Viney42]. The tip oscillated at 45 Hz and the continuous stiffness measurement (CSM) method was applied, as recently described, for example, in Ref. Reference Siu and Ngan43. The values of Young’s modulus and hardness were determined at every depth of indentation, and representative data sets for load versus depth and Young’s modulus versus depth are shown in Fig. S2 (Supplementary material).
The most significant source of experimental uncertainty is the projected contact area of the tip [Reference Fischer-Cripps44, Reference Menčík and Nemecek45]. An approximation that considers the depth of penetration is used by the nanoindentation software [Reference Fischer-Cripps44]. Owing to their susceptibility to experimental parameters (crystal orientation, tip size, applied forces), hardness values typically have uncertainties of ∼10% [Reference Chen, Niu, Li and Li46]. The assumed Poisson’s ratio of 0.3 produces a 5% uncertainty in the calculated value of the Young’s modulus for most materials (MTS NANO Indenter XP manual).
Direct measurements of the organic phase are only feasible for microstructures where it occurs in sufficiently thick layers. In this study, it proved possible to indent the periostracum of M. edulis side-on and the intra-shell organic layer of S. cucullata face-on. Some indication of the elastic properties of the organic phase can be estimated from measurements on areas with other microstructures, however. With increasing load, the soft organic component initially takes up a disproportionate amount of the strain, as expected for the biocomposite as a whole, but this may quickly exceed the linear regime so that results at larger loads (deeper indents) will reflect the elastic properties of the stiffer matrix phase. Figure 7 contains a cartoon of a simple interpretation for details of the earliest stages of the indentation together with actual data for the specific case of M. edulis nacre. An initial plateau at very low values of Young’s modulus is indeed observed and provides a graphical method for estimating a value for the organic phase to compare with values from the direct measurements.
The top cartoon shows a simplistic representation of the response to nanoindentation of a composite material with extreme contrast between a small proportion of soft organic phase and a large proportion of stiff inorganic phase, such as occurs in nacre. Actual data for M. edulis nacre indeed show an initial plateau at low values of E and this graphical approach provides an estimate for the response of the organic phase.

X-ray tomography and FEA
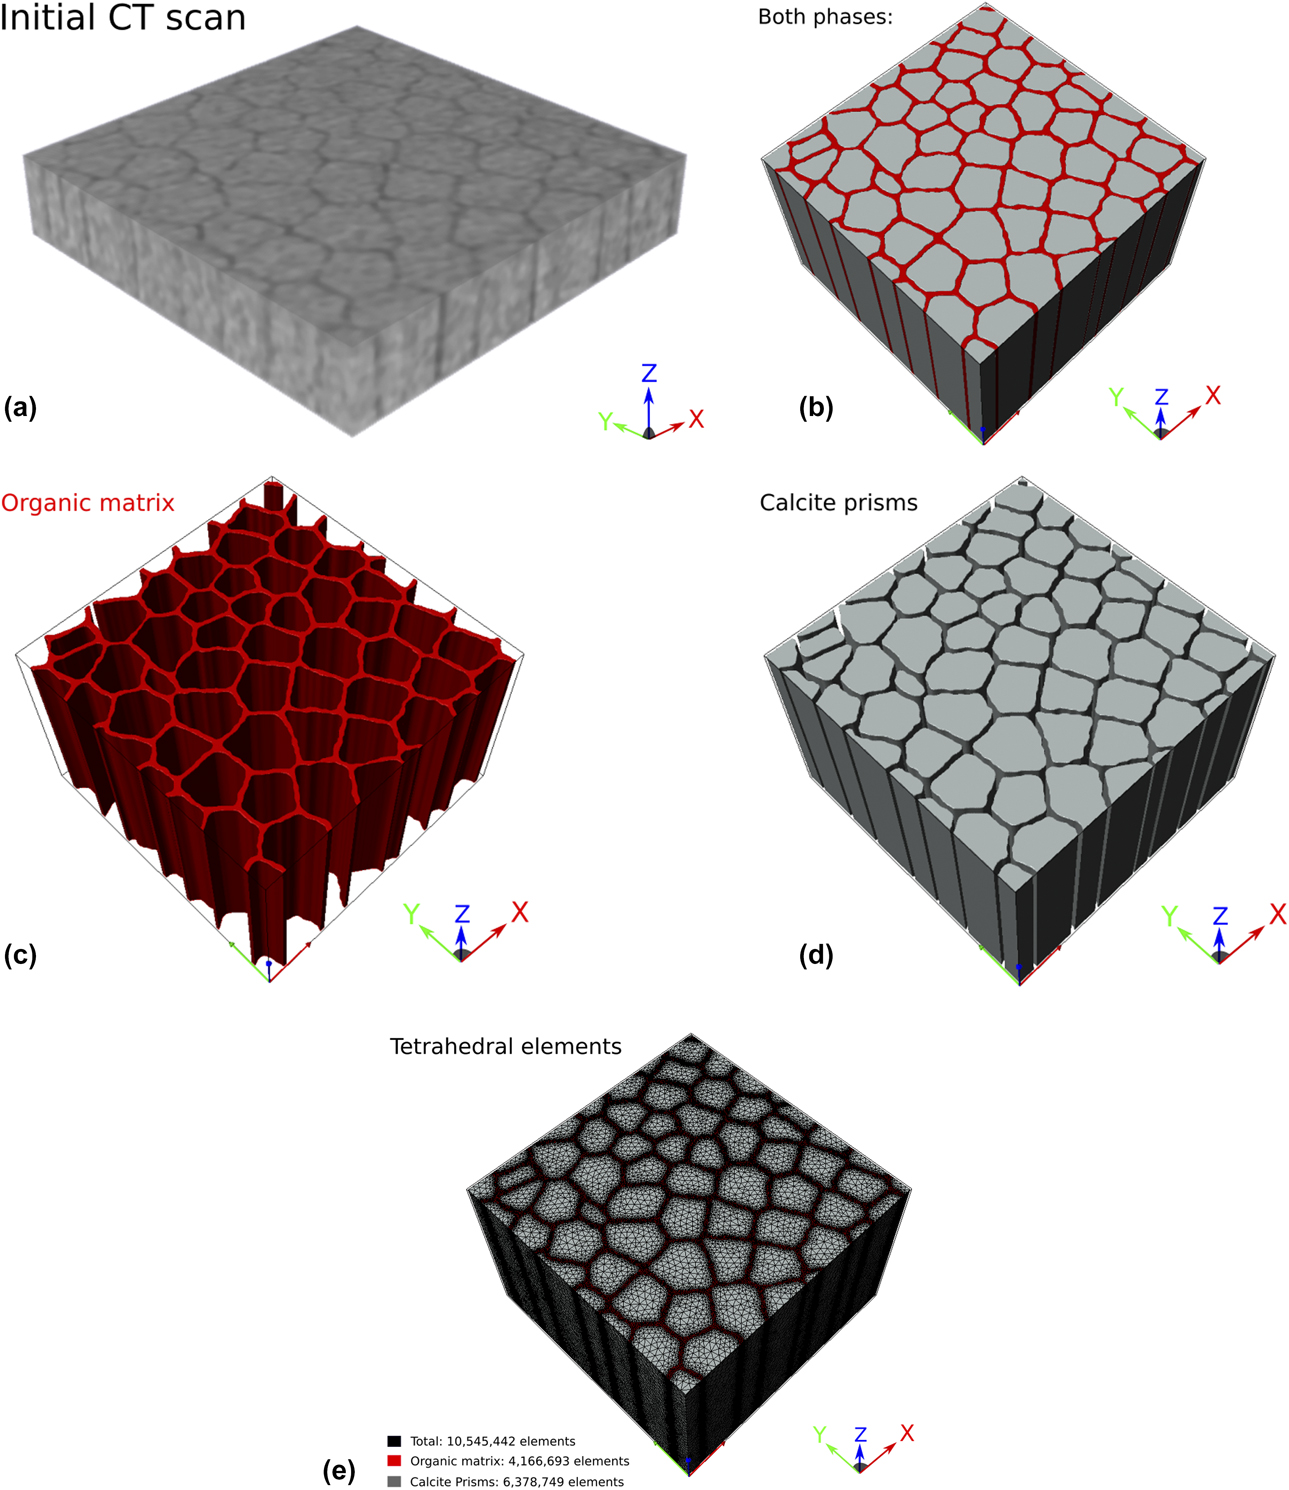
A Bruker SKYSCAN 1172 micro-CT scanner was used to build up a 3D image of the microstructure for input into the ScanIP imaging software from Synopsys Simpleware. Initially the nacreous and prismatic structures of M. edulis were scanned but the 3D voxel size of 1.29 μm for the CT scan was not sufficient to resolve the submicron microstructural features. However, the prismatic structure of P. nobilis, with larger scale prisms (>20 μm) and thicker organic layers (>1 μm), could be resolved (Fig. 8).
(a) Initial CT scan of prismatic structure of P. nobilis. Organic material (dark gray) can be distinguished from calcite prisms (lighter gray). The cuboid had dimensions 0.4 × 0.4 × 0.27 mm3. (b–d) FEA model of prismatic structure of P. nobilis, derived from the CT scan shown in (a). (e) The two phases defined by a finite number of tetrahedral elements.
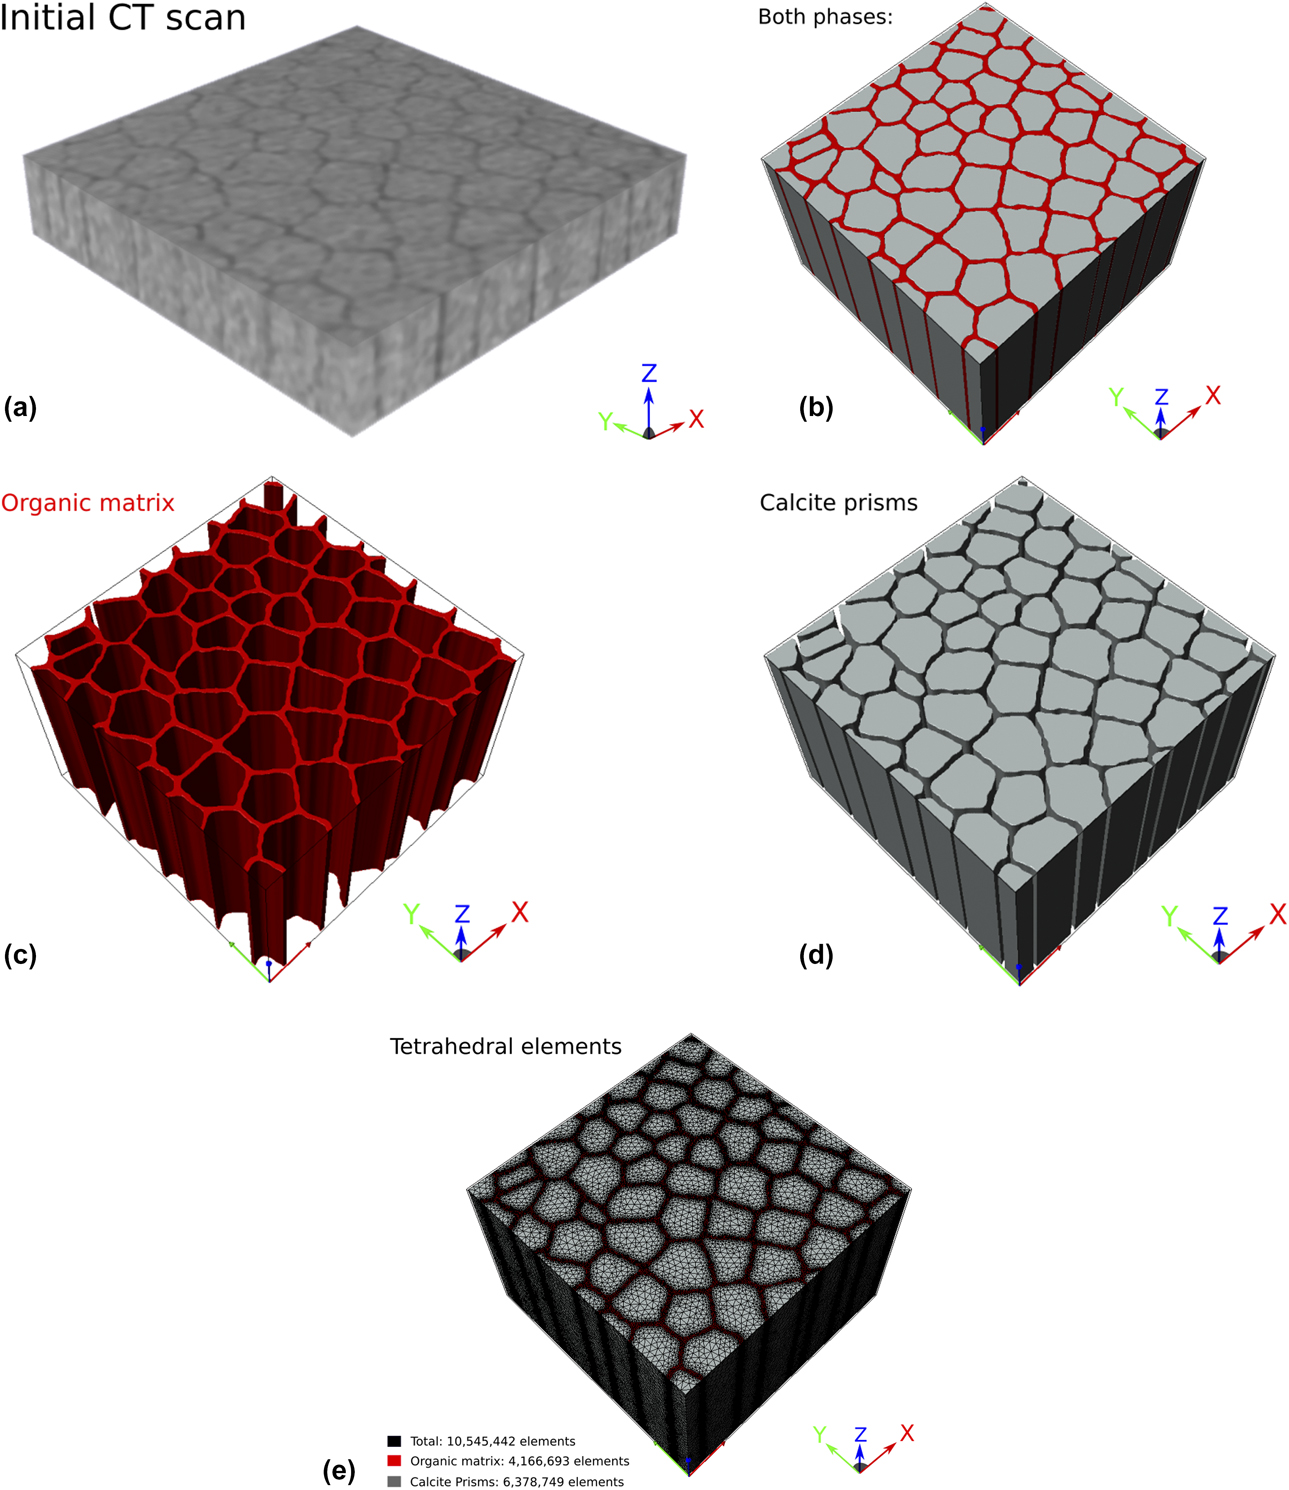
Tomographic slices were stacked and stitched together. The different phases, organics and calcite prisms, were identified from thresholding and segmentation procedures, and assigned mechanical properties. Principal orthogonal axes were assigned as X- and Y-directions in a plane perpendicular to the length of the prisms with the Z-direction parallel to the length of the prisms (Fig. 8). The dimensions of the reconstructed sample were 0.4 × 0.4 × 0.27 mm3. Both phases were meshed using the +FE module of ScanIP. The mesh was then used in a finite element-based homogenization process that was handled automatically by the +SOLID module of ScanIP—i.e., a built-in finite element solver was used to calculate the effective stiffness tensor of the composite structure via the imposition of (simulated) external forces [47].
Supplementary material
To view supplementary material for this article, please visit https://doi.org/10.1557/jmr.2019.159.
Acknowledgments
We thank Andrew Rayment for help with nanoindentation and four-point bending, Gray Williams, Director of the Swire Institute of Marine Sciences (SWIMS) and his student Camilla Camponati for collecting and sending the Saccostrea cucullata specimens from Hong Kong, and Iris Hendriks, from the Mediterranean Institute for Advanced Studies (IMEDEA), for collecting and sending Pinna nobilis specimens from Mallorca. These were collected from spat collectors under a permit granted by the Government of the Balearic Islands.