


DISCUSSION POINTS
• Only a fraction of the incident solar spectrum is efficiently used by today’s solar cells.
• Multijunction solar cells make more efficient use of the solar spectrum, but have extremely high materials and processing costs.
• Increasing PV penetration in commercial terrestrial markets, particularly in dense urban environments, will require low-cost, high-efficiency solar cells.
• Semiconductor upconversion materials offer a promising path toward low-cost higher-efficiency cells.
• We review their performance and the further progress required to realize the predicted gains.
Introduction
One of the fundamental limits on the efficiency of solar energy harvesting is the fact that only a fraction of the incident solar spectrum has photon energies sufficient to drive the energy harvesting process desired.Reference Hirst and Ekins-Daukes1 In solar-driven water splitting, for example, one of the most common, stable, and effective catalysts is TiO2, but only photons with energy greater than about 3 eV can generate the required excitons within the TiO2.Reference Bard and Fox2 Similarly, any single-junction photovoltaic (PV) device has a band gap, and no photons with energy below that band gap can be harvested. This limitation has led to the development of numerous third-generation solar cells that make more efficient use of the solar spectrum. These approaches include multijunction solar cells and intermediate-band solar cells (IBSCs).Reference Dimroth and Kurtz3,Reference Luque and Martí4 Although third-generation solar cells such as multijunction have the highest efficiencies ever reported,Reference Green, Hishikawa, Dunlop, Levi, Hohl-Ebinger and Ho-Baillie5 their penetration into commercial terrestrial markets has been very slow due to extremely high materials and processing costs.
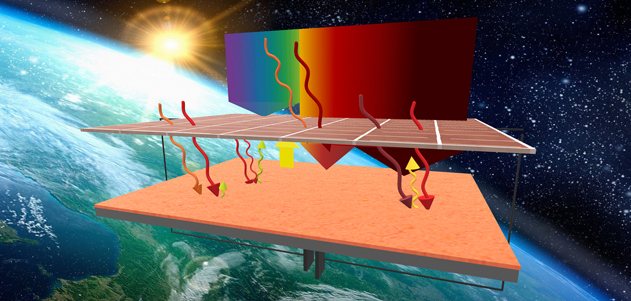
An alternative approach that has received increasing attention in recent years is the idea of an upconversion solar cell, schematically depicted in Fig. 1. In an upconversion solar cell, low-energy photons that cannot be harvested in a host single-junction solar cell pass through the cell to an upconversion layer. The upconverter sequentially absorbs two low-energy photons and emits one high-energy photon, which can be returned to the host cell. The inclusion of the upconversion layer increases the flux of harvestable (above-band-gap) photons on the host single-junction solar cell, increasing the current without reducing the open circuit voltage.Reference Trupke, Green and Würfel6 The total increase in the power produced by such an upconversion PV device will depend on the details of the upconversion material and the coupling between the host solar cell and the upconversion material.
UCSC schematic. The high-energy portion of the solar spectrum (violet–yellow arrow) is absorbed by the solar cell (brown), and the low-energy portion (orange–red arrows) of the spectrum passes through the solar cell and is absorbed by the upconverter. Upconverted photons (yellow) are then emitted from the upconverter towards the solar cell. Adapted from Ref. Reference Milleville, Chen, Lennon, Cleveland, Kumar, Bork, Tessier, LeBeau, Chase, Zide and Doty56.

To understand the trade-offs inherent in designing efficient upconverters and to understand the impact of these trade-offs on overall solar energy harvesting, Sellers et al. introduced three performance metrics for upconversion materials: internal upconversion quantum efficiency (iUQE), absorption bandwidth (AB), and photon energy sacrifice (PES).Reference Sellers, Zhang, chen, Zhong, Doty and Zide7 The iUQE is defined as the ratio of the number of emitted high-energy photons to the number of pairs of absorbed, low-energy photons and can have a maximum value of 100%. The AB is the spectral range of photons that a material can absorb. As with multijunction solar cells, the best solar energy conversion efficiency is achieved by upconversion materials that can harvest the two photons that participate in the upconversion process from two separate bands of the incident spectrum. As we will see, the ability to engineer structures to absorb photons from two distinct bands is one of the unique advantages of semiconductor upconverters. The PES is the energy lost to heat during the upconversion process and is the difference in energy between the energy of the emitted photon and the sum of the energies of the two absorbed low-energy photons. A closely related term, frequently used in the upconversion literature, is the upconversion energy gain, which is defined as the difference between the lowest energy photon absorbed and the energy of the emitted upconverted photon (assuming two low-energy photons of the same energy).
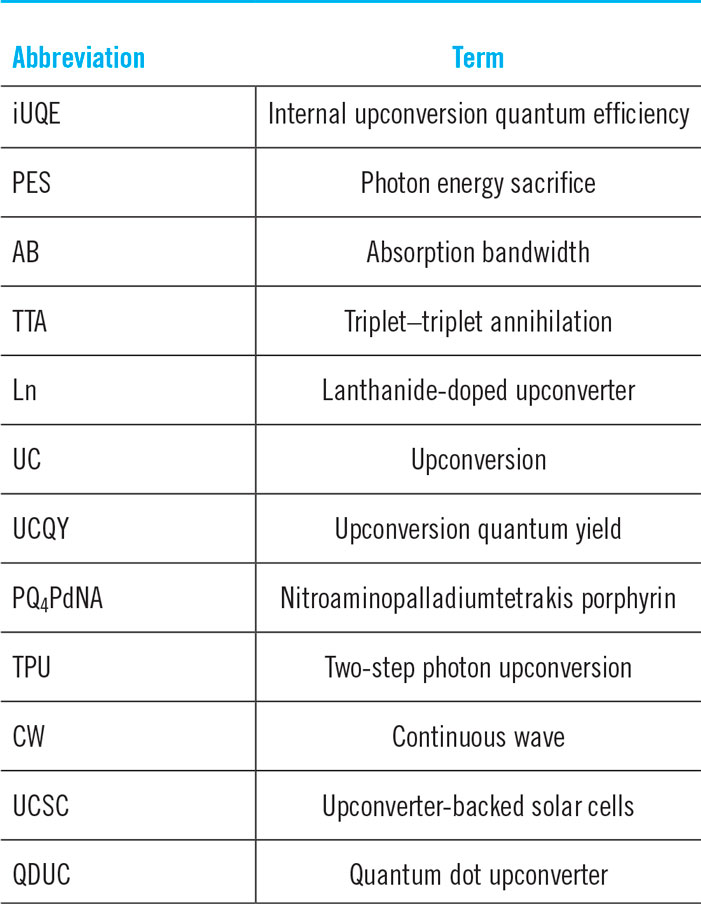
There have been several reviews of existing upconversion materials such as lanthanides and triplet–triplet annihilation (TTA) molecules.Reference Auzel8,Reference Zhao, Wu, Sun and Guo9 However, there has not been a review of semiconductor upconversion materials, which provide unique opportunities to engineer absorption and emission energies, energy relaxation pathways, and overall efficiency. In section “Established upconversion materials,” we briefly review “single-band” materials for photon upconversion, focusing on the performance metrics that are important for their application in solar energy harvesting technologies. In section “Computational models of upconversion PV energy harvesting devices,” we review computational models for the performance of upconversion-backed solar cells. We choose solar cells as our illustrative example throughout this review, although upconversion materials can similarly benefit a wide range of solar energy harvesting applications, including photocatalysis and solar fuel generation. This review of device models clarifies the potential advantages of semiconductor upconversion materials that can harvest photons from two distinct spectral bands. The models also provide guidance on the trade-offs between performance metrics such as iUQE and PES that must be made when optimizing upconversion materials. In section “Semiconductor upconversion nanostructures: from proof-of-concept to state-of-the-art,” we review “double-band” semiconductor upconversion materials. We describe the underlying photophysics and the progress toward engineering improved efficiency. Finally, in section “Comparing upconversion materials for PV applications,” we review the performance of upconversion-backed PV devices. We consider both the performance and the constraints of devices based on the best established upconversion materials. We then evaluate the potential performance of devices based on semiconductor upconversion materials and discuss the further improvements in semiconductor upconversion performance that will be required to realize the projected improvements. To aid in our discussion, we have included a table of abbreviated terms and the corresponding full terminology (see Table 1).
Abbreviations of terms used throughout this review.

Established upconversion materials
Lanthanides and TTA molecules
Auzel and coworkers first discovered anti-Stokes photoluminescence (PL) (specifically, excited-state energy transfer) in rare-earth sensitized nanocrystals in 1966.Reference Auzel10 This discovery was enabled by the advent of high-power lasers. An in-depth review of upconversion via d- and f-ions by Auzel summarizes the characteristic energy transfer and upconversion behavior in doped nanocrystals and further delves into their uses in biology, imaging, and detection.Reference Auzel8
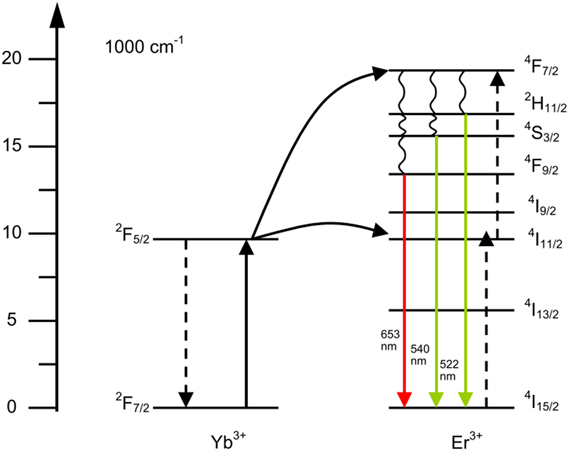
Lanthanide-doped nanocrystals such as NaYF4−Yb3+ are excellent upconverters due to a combination of (i) narrow energy transitions enabled by a partially filled 4f inner shell shielded by filled 5s and 5p orbitals, regardless of host material, and (ii) good spectral overlap in absorption and emission, enabling efficient sensitization and energy transfer, between lanthanide ions.Reference Van Der Ende, Aarts and Meijerink12 The fundamental principle of operation is the absorption of low-energy photons, typically at either 1500 nm by the 4I15/2 to 4I13/2 transitions of an Er3+ ion or 980 nm by the 2F7/2 to 2F5/2 transition of a Yb3+ ion. In the case of 1500-nm excitation, Er3+ acts as the donor and acceptor, requiring three photons for high-energy emission. Under 980-nm excitation, energy transfer from the excited Yb3+ ion state leads to excitation of a nearby Er3+ ion via the 4I15/2 to 4I11/2 transition. A second low-energy photon absorption in the Yb3+ ion and subsequent energy transfer leads to the Er3+ ion being excited to one of several high-energy states. High-energy photons are emitted by the radiative relaxation of this excited electron. As can be seen in Fig. 2, there are multiple radiative relaxation pathways that result in emission at multiple wavelengths such as 410 nm, 450 nm, and 550 nm.
Energy level structure of Yb3+ and Er3+ ions, with radiative transitions indicated by solid arrows, nonradiative energy transfer represented by dashed arrows, and phonon relaxation denoted by wavy lines. Reprinted from Ref. Reference De Wild, Rath, Meijerink, Van Sark and Schropp11 with permission from Elsevier.

Over the past several decades, there have been steady improvements in the efficiency of lanthanide upconverters. Major advances include: (i) the synthesis of doped cores surrounded by undoped shells, which separate the excited ions from surface states that mediate nonradiative recombination and energy loss,Reference Vetrone, Naccache, Mahalingam, Morgan and Capobianco13 (ii) the use of NaYF4 host matrices that suppress phonon-mediated relaxation,Reference Suyver, Grimm, van Veen, Biner, Krämer and Güdel14 and (iii) sensitization of upconversion emission using dye molecules.Reference Wisser, Fischer, Siefe, Alivisatos, Salleo and Dionne15 Some of these and other improvementsReference Han, Deng, Xie and Liu16,Reference Wilhelm17 have been used to reach the current record internal upconversion quantum yield (UCQY) for lanthanides of 16.7%,Reference MacDougall, Ivaturi, Marques-Hueso, Krämer and Richards18 where the internal UCQY here is defined as the ratio of the number of emitted high-energy photons to the number of absorbed low-energy photons and can have a maximum value of 50%. In this review, the UCQY is equivalent to half the iUQE.
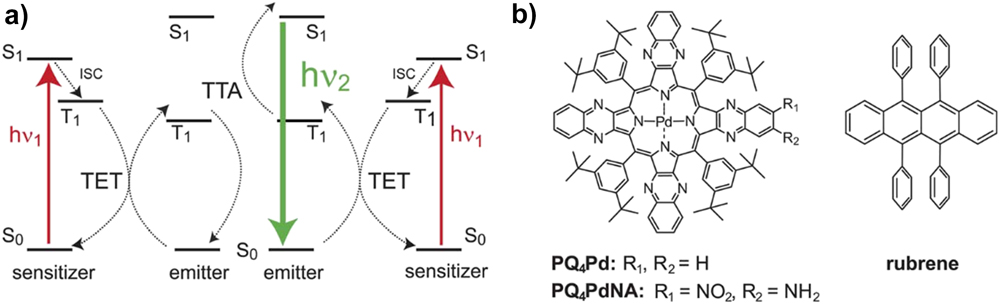
TTA molecules upconvert by a similar mechanism, as illustrated in Fig. 3. Low-energy photons are absorbed by a low-energy singlet molecular transition of the sensitizer molecule (e.g., porphyrin), which is rapidly followed by energy relaxation to a long-lived triplet state via intersystem crossing. Sensitizers then undergo a Dexter, triplet energy transfer event to a nearby emitter (e.g., rubrene). Subsequent collisions between emitter molecules result in TTA where one of the emitter molecules is excited into a high-energy singlet state from which a high-energy photon can be emitted. Significant advances in TTA upconversion have been driven by (i) improved spectral utilization with semiconductor nanocrystals as triplet sensitizers,Reference Huang, Li, Mahboub, Hanson, Nichols, Le, Tang and Bardeen19,Reference Mongin, Garakyaraghi, Razgoniaeva, Zamkov and Castellano20 (ii) improved triplet photosensitizer design,Reference Zhao, Wu, Sun and Guo9 and (iii) enhanced absorption of visible light and longer-lived triplet excited states.Reference Liu, Huang, Draper, Yi, Wu and Zhao21 These advances have led to the current record internal UCQY for TTA materials of 35%,Reference Wang, Sun, Wang, Ye, Ding, Liang, Chen, Tao and Wu22 with improved use in solar cells.Reference Frazer, Gallaher and Schmidt23
(a) Energy level schematic of TTA upconversion and (b) porphyrin (sensitizer) and rubrene (emitter) molecular structures. Reproduced from Ref. Reference Cheng, Fückel, MacQueen, Khoury, Clady, Schulze, Ekins-Daukes, Crossley, Stannowski, Lips and Schmidt24 with permission of The Royal Society of Chemistry.

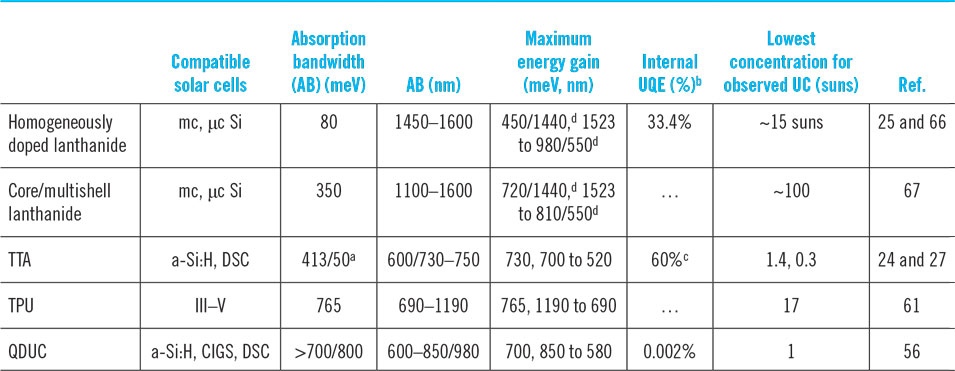
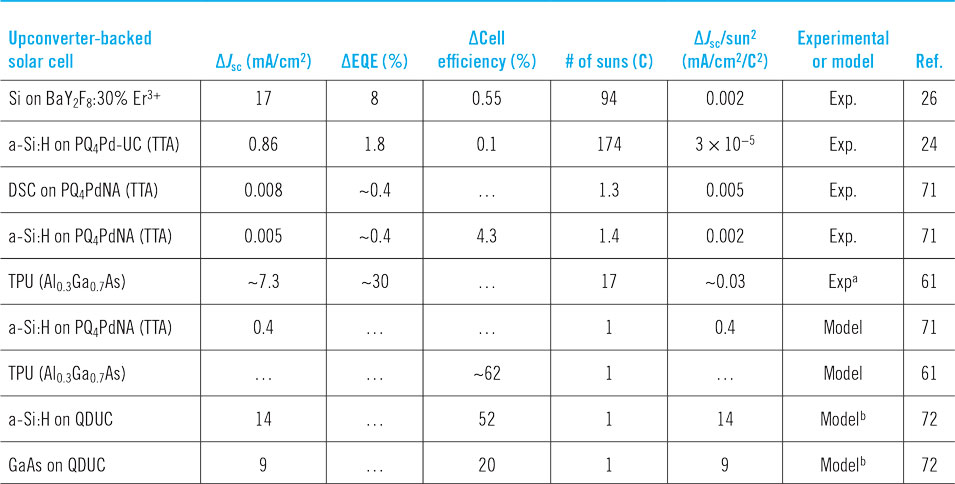
Recently, upconversion for enhanced solar energy harvesting using both lanthanide-doped solids and TTA molecules has been reported by Goldschmidt et al. and Frazer et al., respectively.Reference Frazer, Gallaher and Schmidt23,Reference Goldschmidt and Fischer25 The figure of merit used in both reviews is increased short circuit current, J sc (mA/cm2), after incorporation of the upconverter behind the host solar cell. To date, silicon solar cells backed by b-NaYF4-Er lanthanide nanoparticles (10% internal UCQY) show the highest increase in J sc (17 mA/cm2 under 90× concentration and 1.3 mA/cm2 under 19× concentration).Reference Fischer, Favilla, Tonelli and Goldschmidt26 TTA molecules show the best PV performance under low-light conditions, with an increase in J sc of 0.001 mA/cm2 under 1.4× concentration.Reference Schulze and Schmidt27 While these experiments demonstrate that upconverter-backed solar cells (UCSCs) have increased spectral response in the previously unusable infrared spectral window, the present generation of materials and devices has resulted in minimal improvements in the net solar cell efficiency (<1%) compared with predicted efficiency gains (>10%). Table 2 summarizes the best performing lanthanide and TTA molecules to date, along with their QY and expected J sc improvements. In the terms defined above, the biggest limitation of the existing lanthanide and TTA upconversion materials is their small AB.
Upconverter material comparison for PVs applications.

a Does not include range above host-cell band gap.
b Normalized to 100% total UCQY (one high-energy photon for every pair of incoming low-energy photons).
c Estimated UCQY.
d Due to a three-photon upconversion process.
Single-band upconversion in semiconductor nanostructures
Semiconductor upconversion is typically observed and engineered in quantum dots (QDs), which are used abundantly in LEDs,Reference Colvin, Schlamp and Alivisatos28 lasers,Reference Kirstaedter, Ledentsov, Grundmann, Bimberg, Ustinov, Ruvimov, Maximov, Kop’ev, Alferov, Richter, Werner, Gosele and Heydenreich29 detectors,Reference Chan and Nie30 and solar cells.Reference Nozik31 There are two common material classes of QDs: III–V and II/IV–VI. III–V QDs are typically based on InAs self-assembled in a GaAs host matrix and can be grown by molecular beam epitaxy (MBE), metal–organic chemical vapor deposition, and other methods. II–VI QDs such as CdSe, or CdS, and IV–VI QDs such as PbS are typically synthesized colloidally in solution. In the II–VI materials, the nanoparticle core surface is routinely covered with a shell of a larger band gap material (e.g., CdS on CdSe) to passivate surface states that mediate nonradiative recombination. In III–V materials, full encapsulation by the host lattice material, which similarly has larger band gap, serves a similar function. QDs of both types have a ladder of discrete states that emerge as a result of quantum confinement. The lowest allowed states, which determine both the lowest photon energy that can be absorbed in an inter-band transition and the wavelength of light emitted in PL, can be tuned with the size of the particle.
In PVs, QDs serve as broad-band harvesters of the solar spectrum due to their intrinsic wide AB.Reference Leatherdale, Woo, Mikulec and Bawendi32 They have been used both to enhance the absorption of photons below the band gap of a host cellReference Martí, Antolín, Stanley, Farmer, López, Díaz, Cánovas, Linares and Luque33 and as components of stand-alone PV devices.Reference Mcdonald, Konstantatos, Zhang, Cyr, Klem, Levina and Sargent34 To date, quantum dot solar cells (QDSCs) have achieved 13.4% power conversion efficiency and have enabled several other record-setting efficiencies when added as a down-converting layer on the front side of a solar cell.Reference Sanehira, Marshall, Christians, Harvey, Ciesielski, Wheeler, Schulz, Lin, Beard and Luther35 These II–VI materials are also of interest for multi-exciton generation (MEG)Reference Ellingson, Beard, Johnson, Yu, Mićić, Nozik, Shabaev and Efros36 as well as for lasing applications, where for stimulated emission and gain under high intensity (100 fs, 1 kHz repetition rate, 3 eV photon energy) incident radiation has been observed.Reference Klimov, Mikhailovsky, Xu, Malko, Hollingsworth, Leatherdale, Eisler and Bawendi37 In MEG, relaxation of a single high-energy exciton results in generation of two or more low-energy excitons. Subsequent Auger relaxation dominates all other nonradiative relaxation mechanisms such as surface trapping, reducing the need for passivation.
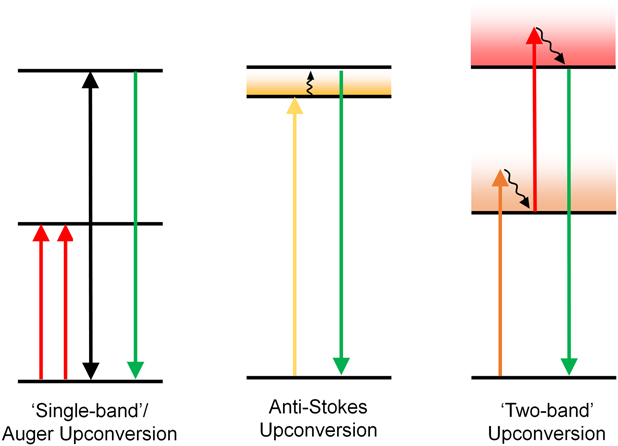
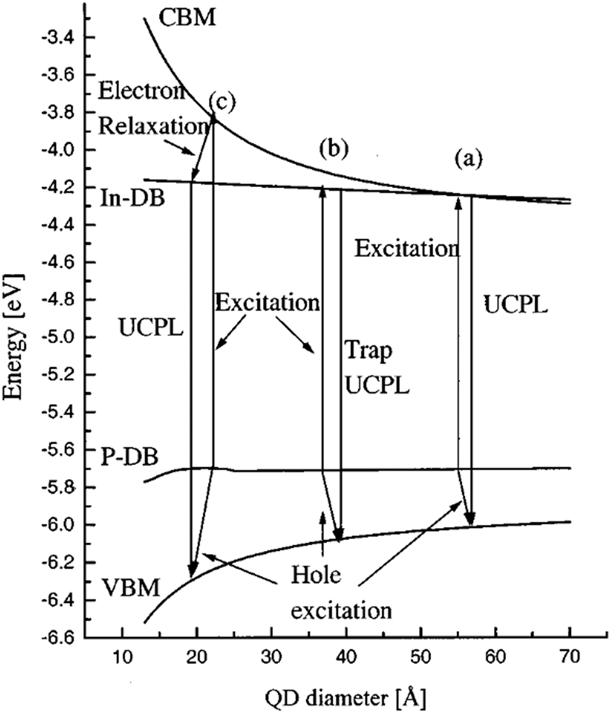
In the 1990s, it was discovered that colloidal II–VI semiconductor QDs also undergo anti-Stokes PL due to the presence of surface states and dangling bonds [Fig. 4(b)].Reference Poles, Selmarten, Mićić and Nozik38 This anti-Stokes behavior (i.e., upconversion PL) has been observed under low-intensity pulsed excitation (1 ps, 0.05 uJ/pulse, 14 MHz repetition rate).Reference Wang, Yu, Zhang, Aldana, Peng and Xiao39 For example, Wang et al. observe a 300-meV energy gain in the photons emitted from CdTe QDs excited with 765-nm light. The 625-nm upconversion emission is red-shifted by 80 meV from the PL observed under traditional above-band-gap excitation. This suggests a radiative relaxation pathway mediated by surface states within the band gap. In other words, excitons in the hole and electron surface states are first created via absorption of low-energy photons. They are then promoted by thermal excitation to higher-energy surface states closer to their respective valence and conduction band minima. Ultimately, light with energy below that of the optical band gap of CdTe, but above the energy of the absorbed photon, is emitted. Upconversion PL has also been observed using cw illumination (e.g., xenon lamps). Poles et al. also attribute upconversion under cw illumination to the presence of intermediate surface states followed by phonon absorption (see Fig. 5).Reference Poles, Selmarten, Mićić and Nozik38 In contrast, Fernee et al. observe upconversion involving acoustic phonons in PbS where stronger confinement improves coupling of the excitons and phonons; surface states may not be involved.Reference Ferńe, Jensen and Rubinsztein-Dunlop40 In all these cases, the upconversion occurs due to a combination of one photon and at least one phonon.
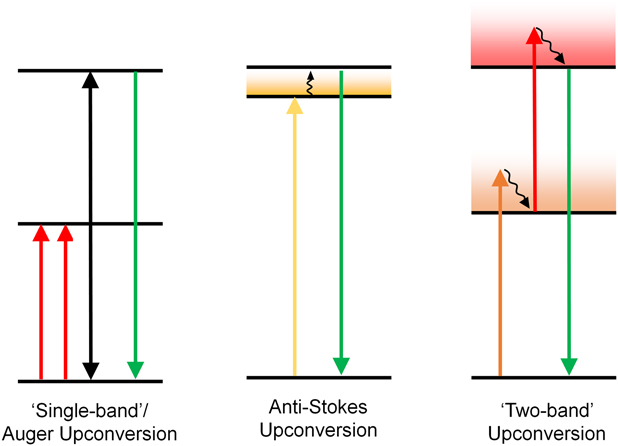
Energy level schematic of upconversion mechanisms in semiconductor heterostructures, where colored arrows indicate photon absorption or emission. (a) Single-band, single-color, two-photon Auger upconversion. Black arrows indicate Auger processes. (b) Single-color upconversion via phonon absorption (black curly arrow). (c) Two-band, dual-color photon upconversion via sequential photon absorption with a “photon ratchet” design. Phonon relaxation is indicated by black curly arrows.
Energy level schematic of single-photon upconversion in InP QDs via phonon absorption via dangling bonds. Reprinted from Ref. Reference Poles, Selmarten, Mićić and Nozik38 with permission from AIP Publishing.

There is an abundance of literature attributing anti-Stokes (upconversion) luminescence to thermal (phonon-absorbing) processes. However, there are very few studies of sequential two-photon upconversion in semiconductor QDs, let alone improved upconversion in complex QD heterostructures. While harvesting phonon energy could be advantageous, the largest potential impact on solar energy harvesting would be made by photon upconversion materials that harvest two photons from two separate spectral bands [Fig. 4(c)]. We now turn to a review of computational models for such “two-band” semiconductor upconverters and the solar energy harvesting devices that could be constructed with them.
Computational models of upconversion PV energy harvesting devices
Existing models
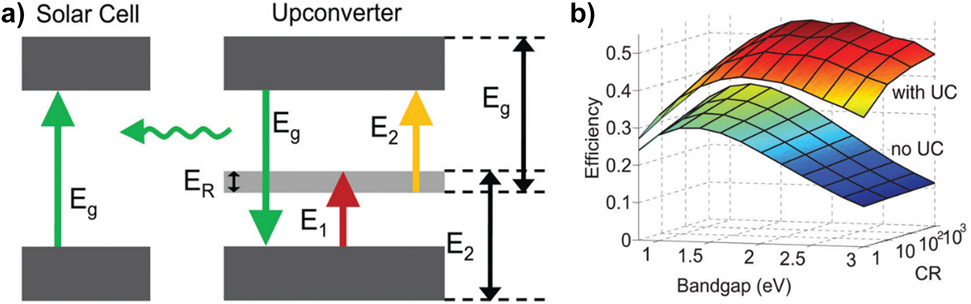
UCSCs conceptually similar to those depicted in Fig. 1 have been studied using detailed balance. For example, Trupke et al. modeled the UCSC using two sub-host-cell-band-gap solar cells in series with an LED [see Fig. 6(a)].Reference Trupke, Green and Würfel6 Such models include the typical detailed balance assumptions such as 1-sun incident radiation, AM1.5 solar spectrum, 100% photon absorption, single-junction host solar cell, 1 exciton per absorbed photon, and equal chance of recombination as absorption. Using this approach, an estimate of the improved solar spectrum harvesting can be calculated in a manner analogous to increasing the number of junctions in a multijunction solar cell. The main difference in UCSCs is that photogenerated carriers are harvested at the V oc of the host cell and no current matching is necessary. Trupke’s model, for example, predicted 47.6% net solar energy conversion efficiency.Reference Trupke, Green and Würfel6 The power conversion fraction improves to 62% under maximum solar concentration. Atre et al. improved upon this model and incorporated nonideal upconverter behavior, calculating a 112% improvement in the J sc, which corresponds to around 40 mA/cm2 if one assumes a typical Si PV host cell with J sc of 35 mA/cm2. Under 90× concentration, the expected improvement is even more drastic. The predicted 40 mA/cm2 is more than twice the best enhancement measured to date.Reference Atre and Dionne41
(a) UCSCs modeled as two solar cells (band gaps E 1 and E 2) in parallel with an LED (emitting at E g). (b) Predicted net solar conversion efficiency as a function of concentration, with 47.6% efficiency under 1 sun. Reprinted from Ref. Reference Atre and Dionne41 with permission from AIP Publishing.

Detailed balance calculations such as those performed by Trupke and Atre provide the inspiration for pursuing practical UCSCs and set an upper limit on the potential gain in solar energy conversion efficiency. However, these detailed balance models necessarily assume idealized hypothetical upconversion materials. As a result, the models do not (and cannot) reflect the limitations inherent to any real upconversion material. The upconversion performance metrics introduced above (iUQE, PES, and AB) provide a framework for considering upconverter performance and provide immediate insight into the limitations of existing upconversion materials. Both lanthanides and TTA molecules absorb low-energy photons in ionic or molecular transitions that are inherently narrow band. Moreover, each of these materials absorbs low-energy photons of only one wavelength (energy). However, as we have discussed, best utilization of the solar spectrum is achieved when two separate bands of the incident solar spectrum are absorbed by the upconverter. This two-band absorption is inherent to the models of Trupke and Atre described aboveReference Trupke, Green and Würfel6 and is crucial for the predicted increases in solar energy conversion. Lanthanide and TTA materials can be coupled to downconversion materials that convert a range of incident solar photons to the wavelength that can be absorbed by the upconverters, as discussed later in sections “Comparing upconversion materials for PV applications” and “Recent advances in lanthanide, TTA, and other upconversion techniques.” However, neither lanthanide nor TTA materials can be modified to harvest two separate bands of the solar spectrum.
“Two-band” semiconductor upconversion
Unlike lanthanides and TTA materials, semiconductors have an inherently broad AB for transitions involving continuum band states. Moreover, both inter- and intraband transitions are possible, allowing the harvesting of two separate bands of incident solar photons as is required to realize solar energy conversion efficiencies approaching those predicted by Trupke and Atre. In section “Single-band upconversion in semiconductor nanostructures,” we summarized the existing work on single-band upconversion in semiconductors. In this section, we review a design for a “two-band” semiconductor upconversion nanostructure, emphasizing the principles of operation. In the next section, we will describe models for the performance of such “two-band” semiconductor upconverters and the net solar energy conversion efficiency that can be achieved when they are coupled to solar cells. In section “Semiconductor upconversion nanostructures: from proof-of-concept to state-of-the-art,” we will discuss the experimental progress toward realizing efficient “two-band” semiconductor upconverters.
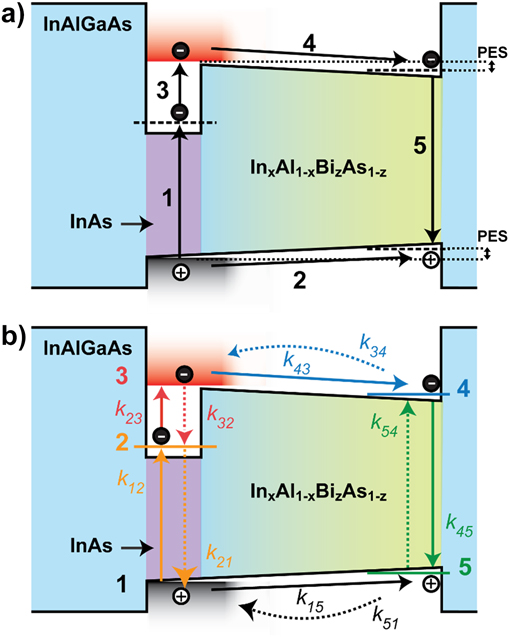
Figure 7(a) schematically depicts a single upconversion nanostructure, in the III–V material system, that was designed to absorb photons from two separate bands of the solar spectrum.Reference Sellers, Zhang, chen, Zhong, Doty and Zide7,Reference Chen, Zhang, Sellers, Zhong, Zide and Doty42 This particular nanostructure was designed for coupling to a GaAs host cell and was designed to use InAs QDs embedded in an InAlGaAs matrix capped with an InxAl1−xBizAs1−z compositionally graded layer that could funnel excited carriers away from the absorber QDs to recombine and emit high-energy photons.Reference Chen, Zhang, Sellers, Zhong, Zide and Doty42 The sequential, two-photon upconversion process is summarized in five steps: (i) an initial exciton is created upon absorption of a mid-energy photon in the InAs QD, (ii) the hole escapes from the InAs VB due to the energy gradient in the InxAl1−xBizAs1−z quantum well (QW) and the minimal valence band offset between the InAs and InxAl1−xBizAs1−z, suppressing radiative recombination, (iii) the electron in the InAs conduction band then absorbs a low-energy photon and is excited to the continuum band, (iv) the excited electron drifts towards the InxAl1−xBizAs1−z quantum well, and (v) carriers recombine radiatively in the InxAl1−xBizAs1−z QW to emit a single high-energy photon. Sellers et al. report potential specific composition fractions for the InxAl1−xBizAs1−z region.Reference Sellers, Zhang, chen, Zhong, Doty and Zide7
Band diagrams of a single, III–V solid-state upconverter nanostructure, where an InAs QD is embedded in an InAlGaAs matrix capped with InxAl1−xBizAs1−z, showing (a) the two-photon upconversion process via five processes indicated by black arrows, energy levels indicated by dashed line, and PES indicated by dotted lines, and (b) the kinetic rate model used to calculate the iUQE, with equilibrium states indicated by colored numbers, and excitation and relaxation rates indicated by solid and dotted arrows, respectively, with their associated rate constants. © 2016 IEEE. Adapted, with permission, from Ref. Reference Chen, Zhang, Sellers, Zhong, Zide and Doty42.

Modeling two-photon upconversion in semiconductor nanostructures
To model the potential performance of the upconversion nanostructure depicted in Fig. 7 and to understand how changes in the material structure and composition would impact net solar energy conversion, Chen et al. introduced a kinetic rate model.Reference Chen, Zhang, Sellers, Zhong, Zide and Doty42 The model is based on the photophysics of semiconductor nanostructures and allowed for computation of the iUQE of a single upconversion nanostructure as a function of the PES. In the particular III–V upconversion nanostructure modeled, the PES was implemented via the sloped band gap of the InAlBiAs layer. The energy sacrifice in the conduction and valance bands was considered separately. This kinetic rate model considered five states of the upconversion system, as indicated in Fig. 2(b). For example, k 12 indicates the rate of carrier promotion via mid-energy photon absorption and is based on both the flux of incident solar photons with energy appropriate to drive the transition and the optical absorption cross section. Similarly, k 21 is the rate of carrier relaxation. Chen et al. used literature values for these III–V materials for absorption cross sections, nonradiative and radiative recombination rates, and all other parameters where literature values were available. A simplistic drift-diffusion model was developed to calculate the rate of carrier escape (drift) from the QD to the emitter QW and the rate of thermal excitation (diffusion) back to the “absorbing” QD. Inherent in this structure is the “photon ratchet,” which is realized by the sloped potential of the InAlBiAs region and the zero-valence band offset for the hole.
Using the kinetic rate model, Chen et al. calculated the iUQE of a single nanostructure as a function of the PES. To determine optimal parameters for a UCSC system based on this upconversion nanostructure, Sellers et al. coupled this kinetic rate equation to a detailed balance model of the host solar cell, assuming ideal spectrum splitting and ideal optical coupling between the upconverter and host cell. For each host solar cell band gap, the flux of below-band-gap photons was divided into two bands to drive the two-step absorption in the upconverter. The subdivision of the low-energy photons into two bands and the iUQE of the upconverter, which determined the flux of high-energy photons returned to the host cell, were then computed as a function of the PES, as shown in Fig. 8(a). The optimal PES was determined by the maximum solar energy conversion efficiency of the overall UCSC. Figure 8(b) shows the net solar energy conversion efficiency as a function of host cell band gap and PES.
(a) iUQE as a function of PES and host cell band gap. Inset: iUQE versus PES at 1.42 eV. (b) Net solar cell efficiency as a function of PES and host cell band gap. >39% is achieved with band gaps between 1.3 and 1.75 eV and PES between 390 and 550 meV. Reprinted from Ref. Reference Sellers, Zhang, chen, Zhong, Doty and Zide7 with permission from Elsevier.

There are three important results that can be understood from considering Fig. 8. First, modest increases to PES that enable significant increases in iUQE are advantageous for overall solar energy conversion efficiency. Second, when compared to the conventional detailed balance models for upconversion materials, this kinetic rate model predicts a lower net solar conversion efficiency of 39%. This is likely a more realistic limit because it incorporates a more realistic treatment of the limitations of the upconversion material. Third, upconversion materials that do not reach the theoretical limits predicted here could still have a substantial commercial impact on solar energy harvesting. For example, the kinetic rate model for a moderate PES (300 meV) predicts an upconversion quantum efficiency of over 90%, but several loss mechanisms are not yet included in this model. Even if semiconductor upconversion materials only achieved a 25% iUQE, however, they would enable net solar energy conversion efficiency 37%, well above the Shockley–Queisser limit.Reference Shockley and Queisser43 This efficiency enhancement is roughly comparable to an improved J sc of nearly 12 mA/cm2 under 1 sun concentration.
The model of Chen and Sellers is limited by the assumption that the literature values obtained for a specific III–V material platform could be extended to arbitrary band gaps. Moreover, real measures of the performance of these material systems have not been realized. In this sense, the models of Chen and Sellers provide an upper bound on the potential improvements in solar energy conversion that could be realized in UCSCs using semiconductor nanostructured upconverters. Equally importantly, these models guide the design of semiconductor upconversion nanostructures, particularly the trade-off between PES and iUQE.
Semiconductor upconversion nanostructures: from proof-of-concept to state-of-the-art
We turn now from models of the potential performance of “two-band” semiconductor upconversion nanostructures and UCSCs to a review of the experimental progress. As described above, the most substantive modeling of upconversion structures for solar energy harvesting has been done for III–V materials. Upconversion using InAs QDs has been observed.Reference Tex and Kamiya44,Reference Tex, Kamiya and Kanemitsu45 The authors determined that in the particular structures studied, upconversion occurs via Auger processes [Fig. 4(a)]. Auger-mediated upconversion occurs when two low-energy photons create two excitons in the InAs QD absorber. One exciton transfers its energy to the other, creating a higher-energy exciton. This high-energy exciton then recombines in either the InAs wetting layer or the nearby GaAs/AlGaAs QW to emit a high-energy photon. Upconversion has also been observed in semi-insulating GaAsReference Johnson, Kafalas, Davies and Dyes46 under 1.51 eV cw excitation and GaAs/GaAlAs epitaxial layers under 1.17-eV cw excitation.Reference Quagliano and Nather47 In these cases, the upconversion is mediated by deep centers (i.e., mid-gap states) that serve as the intermediate state. However, in the epitaxial structure these states are easily saturated, as shown by a linear (rather than quadratic) dependence on excitation intensity.Reference Quagliano and Nather47
A key limitation of the observed upconversion in InAs QDs for solar energy harvesting applications is that the proposed mechanism involves two photons of the same energy. As described above, sequential absorption of two photons from different bands would be ideal for solar energy conversion applications. To the best of our knowledge, two-color sequential photon upconversion has only been observed in colloidally synthesized II–VI QDs, which have the advantage of being solution processable. Moreover, recent developments in colloidal QD synthesis have enabled increasingly complex band engineering that can be used to tailor properties such as emission/absorption wavelength,Reference Alivisatos48,Reference Norris and Bawendi49 carrier transport,Reference Konstantatos, Howard, Fischer, Hoogland, Clifford, Klem, Levina and Sargent50 and extinction coefficient.Reference Moreels, Lambert, De Muynck, Vanhaecke, Poelman, Martins, Allan and Hens51 We therefore turn to reviewing upconversion in colloidal QDs and core–rod nanostructures.
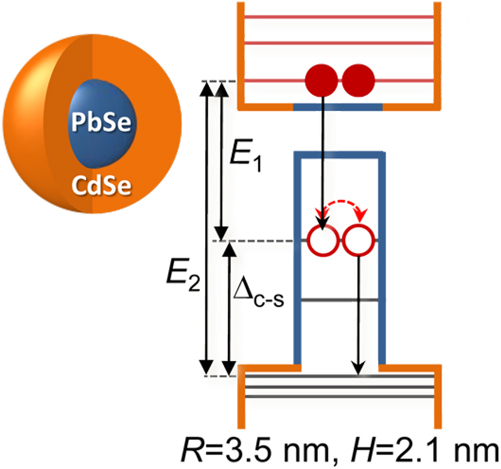
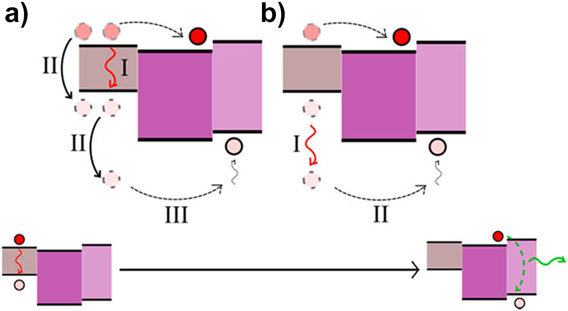
Figure 9 shows the band structure of a colloidal nanoparticle synthesized and studied by Makarov et al.Reference Makarov, Lin, Pietryga, Robel and Klimov52 The structure consists of a CdSe shell over a PbSe QD and was used to compare MEG via carrier multiplication with Auger upconversion. The PbSe core serves as a low-energy photon absorber, and higher-energy photons can be emitted by recombination involving at least one carrier in the CdSe shell. The authors observed upconversion PL energy gains of between 300 and 830 meV under CW and pulsed light, with an efficiency of 0.2% under pulsed excitation. Similarly, Teitelboim et al. report broad-band NIR to visible upconversion using quasi-type II PbSe/CdSe/CdS as a QD/QW system schematically depicted in Fig. 10.Reference Teitelboim and Oron53 They observe an upconversion quantum efficiency of up to 0.4% (0.7% when above saturation) under 5-ns pulses at 10 Hz, 50 mJ/cm2.Reference Teitelboim and Oron53 Teitelboim et al. cite both Auger recombination and sequential interband absorption as the mechanisms for upconversion. The competition between these possibilities can be seen in Fig. 10. Sequential absorption of two photons generating two excitons in the absorber core could be followed by Auger recombination exciting at least one carrier of the remaining exciton into the emitter shell. Alternatively, absorption of a single low-energy photon in the absorber core could then be followed by absorption of a second photon promoting one of the carriers to the emitter shell via an interband transition. The dominant process is largely determined by the average population of the absorber QD.
Auger upconversion process in PbSe/CdSe core/shell QDs represented schematically (left) with corresponding band diagram (right). Successive low-energy photons create two excitons, one of which recombines to promote the hole of the nearby exciton to a higher-lying state. Radiative recombination results in high-energy emission. Reprinted with permission from Ref. Reference Makarov, Lin, Pietryga, Robel and Klimov52. Copyright 2016 American Chemical Society.

(a) Auger upconversion and (b) intraband upconversion in PbSe/CdSe/CdS QDs. Absorption of two low-energy photons results in (a) two excitons, one of which transfers its energy to the hole of the other exciton via Auger recombination, and (b) one exciton, whose electron relaxes to the CdSe and whose hole absorbs the second low-energy photon and relaxes to the CdS. Both instances lead to recombination in the CdS. Reprinted with permission from Ref. Reference Teitelboim and Oron53. Copyright 2015 American Chemical Society.

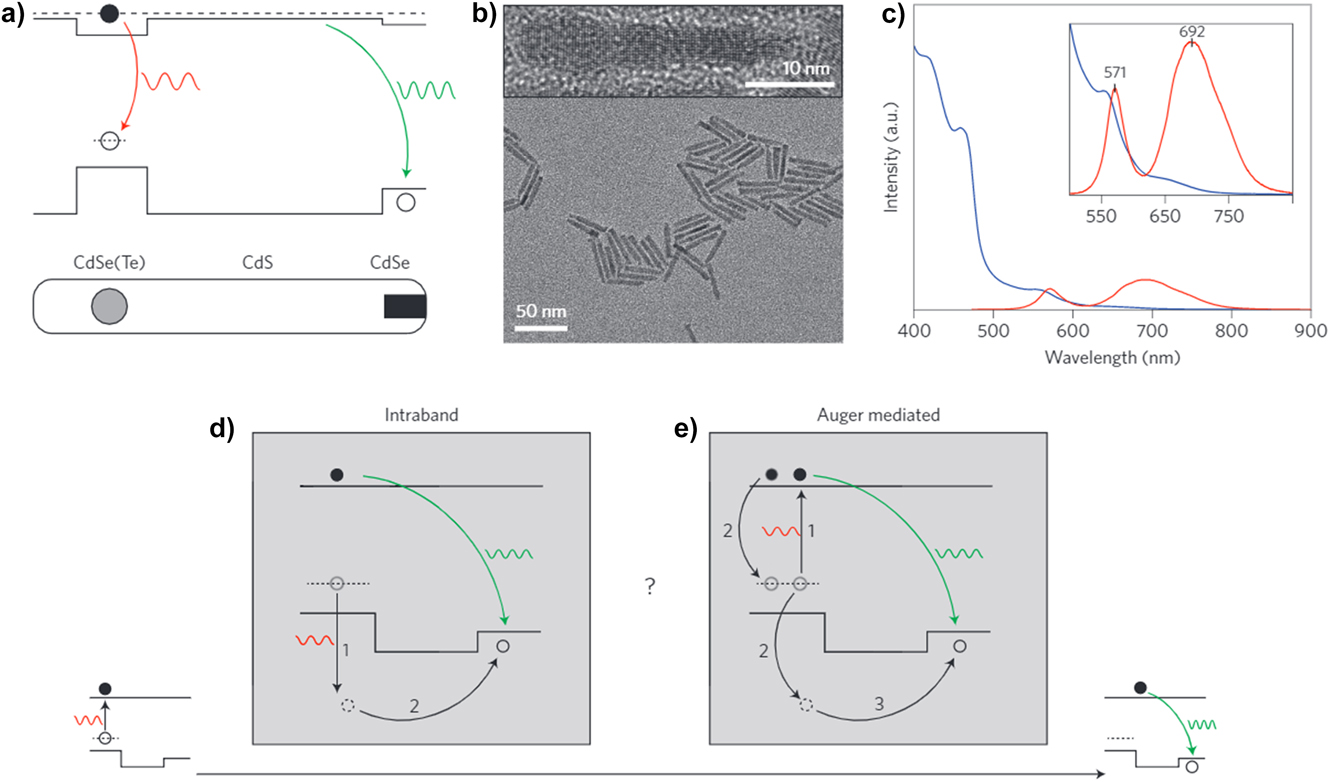
As discussed above, best harvesting of solar energy is achieved when two bands of the solar spectrum can be used. In other words, one would like to engineer the colloidal structure to promote the intraband upconversion process over the Auger process. Moreover, to make upconversion efficient under the low photon flux of the sun (in contrast to the high photon flux of pulsed lasers) one would like to suppress radiative recombination. This suppression requires separating the electrons and holes, which in turn requires some energy sacrifice (PES). This design goal underlies the structure of the III–V system described in Fig. 7 and the corresponding rate equation models. To accomplish this goal in colloidal systems, Deutsch et al. synthesized coupled QD nanostructures using tellurium-doped CdSe nanocrystals (∼4 nm in diameter) as seeds for growth of a CdS rod approximately 40 nm long and capped with a CdSe QD.Reference Deutsch, Neeman and Oron54 As shown in Fig. 11, the CdSe(Te) served as the absorber core and the CdSe at the end of the rod served as the emitter, with carrier separation promoted by the near zero conduction band offset between the CdSe(Te) absorber and the CdS rod. A PL emission QY of 42% was measured, with an estimated UCQY of 0.1% (assuming hot-hole excitation to the CdSe emitter is 1%). An energy gain of 400 meV was obtained under pulsed 680-nm excitation (5-ns pulses) at 104 W/cm2. Deutsch et al. also conducted two-color excitation experiments that verified that these structures were capable of harvesting photons from two separate spectral bands.
(a) Band diagram schematic of CdSe(Te)/CdS/CdSe upconverter with dual emission from absorber QD (red) and emitter QD (green). (b) HR-TEM of core/rod/dot nanostructures. (c) Ensemble absorbance (blue) and PL (red) spectra showing dual emission from nanostructure. (d and e) Intraband and Auger-mediated upconversion band diagram schematic. Reprinted with permission from Ref. Reference Deutsch, Neeman and Oron54.

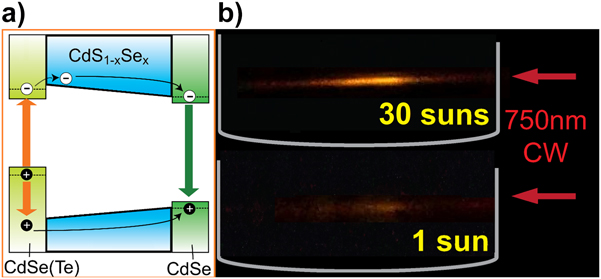
To further improve upconversion efficiency, particularly under the low solar photon flux, Chen et al. investigated the influence of morphology on upconversion.Reference Chen, Li, Milleville, Lennon and Doty55 These experiments established that two-step, two-photon absorption was improved by the spatial separation of the carriers in a core–rod structure similar to that studied by Deutsch, that is, with a quasi-type II band offset.Reference Chen, Li, Milleville, Lennon and Doty55 Most recently, Milleville et al. adapted the techniques of semiconductor heterostructure engineering to modify the structure of absorber core–rod–emitter structures to improve upconversion performance.Reference Milleville, Chen, Lennon, Cleveland, Kumar, Bork, Tessier, LeBeau, Chase, Zide and Doty56 They first eliminated trap states at the interface between the absorber core and the rod by altering the synthesis conditions to achieve a homogeneous, rather than compositionally segregated, CdSe(Te) core. They then developed new synthesis procedures to create a CdSxSe1−x rod with x increasing with distance from the absorber core. This compositional gradient implemented the decreasing band gap funnel shown in Fig. 7 and understood through the modeling of Chen et al. to be important to efficient upconversion. Together, the two structural modifications made by Milleville et al. achieved a 100× improvement in upconversion performance, allowing the first observation of upconversion under a cw photon flux equivalent to 1-sun conditions, as shown in the bottom panel of Fig. 12(b).
(a) Band diagram schematic of CdSe(Te)/CdS1−xSex/CdSe nanostructure with increasing %Se content from left to right. (b) Real-color images of upconversion in solution under 750-nm cw excitation at 30-suns (top) and 1-sun (bottom) equivalent, integrated for 1 s and 30 s, respectively. Adapted from Ref. Reference Milleville, Chen, Lennon, Cleveland, Kumar, Bork, Tessier, LeBeau, Chase, Zide and Doty56.

The iUQE of the structures studied by Milleville et al. and depicted in Fig. 12 was 0.002%. There are likely many factors contributing to this low iUQE. First, there is relatively poor hole excitation, limited by the intraband absorption cross section. Second, both the CdSxSe1−x rod and the CdSe emitter are unpassivated, which is known to result in significant nonradiative relaxation via surface states. Indeed, the PL QY itself was only 0.08%. All nonradiative relaxation mechanisms that limit PL QY will similarly limit iUQE. For the structures synthesized by Milleville, the UCPL was as high as 3% of the PL, suggesting that the nonradiative relaxation pathways are one of the most significant limitations on the iUQE. Employing strategies that passivate surface state and lead to very high PL QY are therefore likely to significantly improve the iUQE, as discussed in section “Comparing upconversion-backed solar cells”.Reference Hines and Guyot-Sionnest57
Comparing upconversion materials for PV applications
The potential increase in solar energy harvesting that can be achieved by inclusion of a photon upconversion material or device component depends on a number of details. In section “Comparing upconversion materials,” we compare the upconversion materials that have been considered in this review. In section “Comparing upconversion-backed solar cells,” we consider the incorporation of these materials in solar cells, describing the best performance to date in each material platform and the opportunities for future advances. Before we begin this comparison, however, we briefly review two closely related device paradigms.
Intermediate-band and photon ratchet solar cells
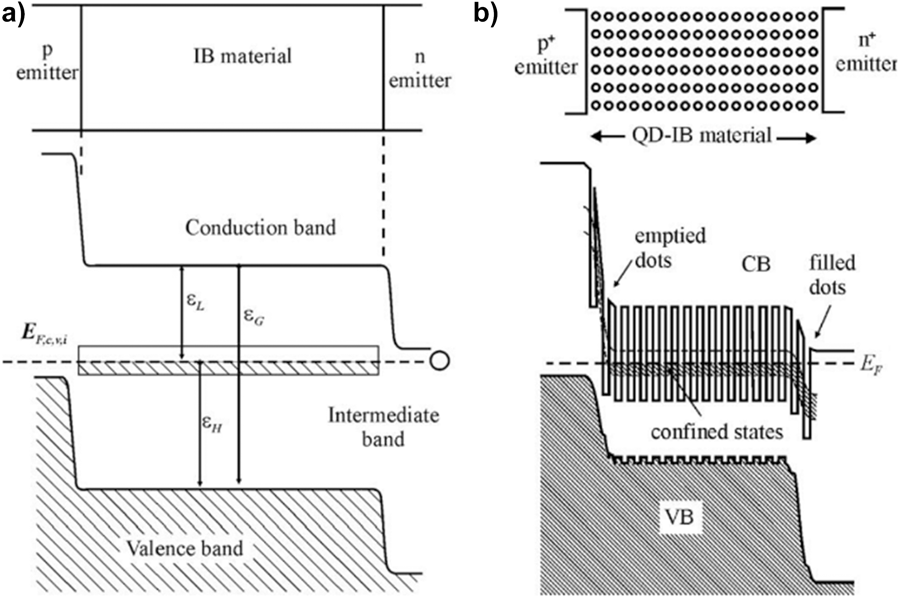
Luque and Marti first devised the concept of an IBSC, depicted in Fig. 13(a), in 1997 as a method for harvesting sub-band-gap solar photons.Reference Luque and Martí4 In an IBSC device, both high- and low-energy photons are absorbed by the solar cell simultaneously. The high-energy photons are harvested in a top “host” material with relatively wide band gap. Low-energy photons are harvested in a region below the host through sequential absorption: the first low-energy photon generates an exciton that remains in the intermediate state until another low-energy photon promotes at least one of the carriers to higher energies, above the band gap of the host. This approach is very similar to the “two-band” upconverters that are the focus of this review, but in an IBSC device no high-energy photons are emitted. All carriers generated by both high- and low-energy photon absorptions are directly extracted as current, which necessitates that at least one type of carrier from the host material must traverse the region in which the intermediate states are located. Luque et al. calculated ideal IBSC efficiencies, under concentration, of 63.1%, which exceeds the S-Q limit (40%) and the limit of tandem, two-junction solar cells (55%) because of the increased current generation at constant open-circuit voltage. As depicted in Fig. 13(b), Luque et al. also synthesized QD layers to generate a continuous, intermediate band of energy states due to the presence of discrete states and thin barriers between layers (see Fig. 13).Reference Luque and Martí58
IBSC band diagram (a) under equilibrium and (b) incorporating QD arrays to form the intermediate band. Reprinted from Ref. Reference Martí, López, Antolín, Cánovas, Stanley, Farmer, Cuadra and Luque59 with permission from Elsevier.

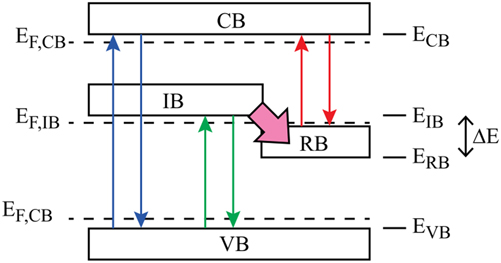
The photon ratchet intermediate-band solar cell was introduced to increase the lifetime of carriers in the intermediate state.Reference Yoshida, Ekins-Daukes, Farrell and Phillips60 In this design, depicted in Fig. 14, the intermediate states are created by a layer of embedded QDs. The “photon ratchet” describes the fact that the heterostructure is designed to sacrifice some absorbed photon energy by transferring carriers into longer-lived states. This concept of intentional energy sacrifice is critical for efficient sequential harvesting of two low-energy photons as we have discussed above in the context of the “two-band” photon upconversion materials. The important difference between an IBSC and a UCSC is the output of the two-photon absorption: an IBSC, with or without a photon ratchet, uses two-step photon absorption to generate high-energy carriers directly within a PV cell. In contrast, an upconverter absorbs two low-energy photons and emits a single high-energy photon that could be sent back to a host cell. Both concepts result in very similar theoretical improvements in current generation in the host cell. In practice, however, IBSCs must manage significant degradation of the efficiency of the host cell related to carriers relaxing through the low-energy states that enable the low-energy photon absorption.Reference Luque and Martí58
Photon ratchet IBSC, with excitation and relaxation steps occurring between VB and CB, VB and IB, and RB and CB, indicated by vertical colored arrows. Reprinted from Ref. Reference Yoshida, Ekins-Daukes, Farrell and Phillips60 with permission from AIP Publishing.

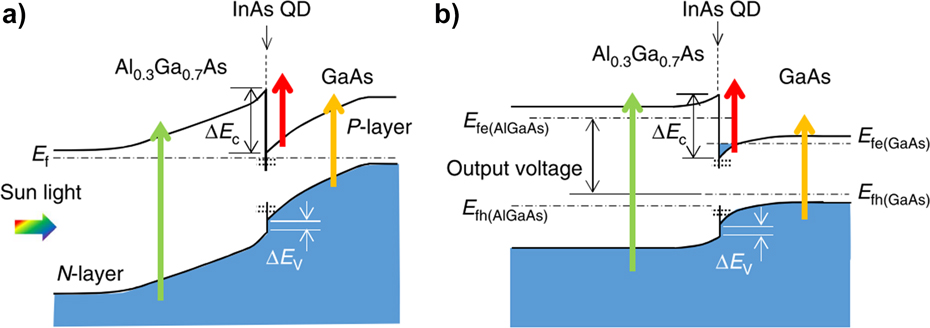
Asahi et al. recently introduced a III–V solar cell that utilizes two-step photon upconversion (TPU) at the hetero-interface between n- and p-layers, grown by MBE (Fig. 15).Reference Asahi, Teranishi, Kusaki, Kaizu and Kita61 The authors grow Al0.3Ga0.7As (wider band gap, n-layer) and GaAs (narrower band gap, p-layer) such that high-energy photons are absorbed in the n-layer and sub-band-gap photons are absorbed in the GaAs p-layer. Photogenerated electrons and holes flow in opposite directions in both layers. In the GaAs layer, however, the photogenerated electron dwells at the hetero-interface between Al0.3Ga0.7As and GaAs, where InAs QDs are grown to create a type I offset that confines carriers and enhances optical coupling relative to a bulk interface. At short-circuit conditions, sub-band-gap excitation of GaAs generates nonzero photocurrent due to partial extraction of carriers via thermal and tunneling processes at the interface. Under operating (biased) conditions, when 1300 nm illumination is added, photocurrent increases by 0.6 mA/cm2. This increase is due to the long-lived electron population in the QDs leading to greater intraband coupling with and absorption of the 1300-nm light. Asahi et al. use detailed balance to model the wide- and narrow-band-gap materials in the TPU-SC and predict potential net solar conversion efficiencies greater than 50%.Reference Asahi, Kusaki, Harada and Kita62
Two-photon upconversion solar cell under (a) short-circuit and (b) operating conditions. Figure obtained from Ref. Reference Asahi, Teranishi, Kusaki, Kaizu and Kita61.

The advantage of the TPU device design, relative to IBSCs, is that electrons do not have to flow through a region that contains numerous mid-gap states, which consequently reduces the probability of trap-state-mediated carrier trapping or relaxation. Holes do have to flow across the interface, but the amount of energy lost at this interface could be minimized through control over the valence band alignments, which would require additional composition engineering.Reference Petropoulos, Zhong and Zide63 Another disadvantage of the TPU device design is that there is only a single layer of QD absorbers, which will limit the fraction of the incident low-energy photons that will be absorbed. Furthermore, losses in which carriers generated in the wide-band-gap material recombine at the hetero-interface are still a potential problem.
IBSC and TPU devices harvest the solar spectrum in a manner analogous to the upconversion PV device schematically depicted in Fig. 1. For this reason, we include them in our material and device comparisons in the next sections. The important difference to keep in mind is that IBSC and TPU devices do not ever emit high-energy photons. As a result, the device optimization constraints are substantially different. IBSC and TPU devices are constrained by lattice matching and energy losses that can occur when high-energy carriers transport through or are adjacent to low-energy states associated with the two-photon absorption process. In contrast, the upconversion materials that are the focus of this review emit high-energy photons and can be incorporated in UCSC devices such as that depicted in Fig. 1. Such devices are not bound by lattice or current matching constraints at the interface between the host solar cell and the upconversion material. Moreover, the host cell is a single-junction device electrically isolated from the upconverter with no additional low-energy states that can mediate relaxation and recombination. The key advantage for UCSCs is that the structure of the host cell and the upconverter can be optimized independently to improve the overall system performance. Photon management techniques can also be used to optimize the optical coupling between the host cell and the upconversion material and to minimize the amount of upconversion material required.
Comparing upconversion materials
In Table 2, we compare the performance metrics for upconverter materials that could be used to supplement specific solar cell materials. The metrics we compare include: (i) cited AB, the difference between highest and lowest energy photon absorbed, assuming a constant absorption cross-section among materials, (ii) energy gain (the difference between lowest energy photon absorbed and upconverted photon energy), (iii) iUQE (defined as twice that of the UCQY), and (iv) the equivalent solar concentration at which the UCQY was measured. We note that InAs QDs have a higher absorption cross section (10−14 cm−2 from 860 to 1240 nmReference Osborne, Blood, Smowton, Xin, Stintz, Huffaker and Lester64) than lanthanide ions such as Yb3+ (10−21 cm−2 at 980 nmReference Han, Deng, Xie and Liu16) or TTA molecules such as porphyrin (10−16 cm−2 from 600 to 700 nmReference Schulze, Czolk, Cheng, Fückel, MacQueen, Khoury, Crossley, Stannowski, Lips, Lemmer, Colsmann and Schmidt65). In this sense, our estimates of the potential efficiency of upconversion PV systems backed by semiconductor upconversion materials are conservative. We first compare TTA and lanthanide-backed upconverters. The AB of TTA is an order of magnitude higher than that of homogeneously doped lanthanide-doped nanocrystals. Core/multishell lanthanides, however, have a comparable AB to TTA. Moreover, the internal quantum efficiency of the TTA molecules is nearly double that of the lanthanides. We also see that upconversion can be observed in TTA systems under low-light illumination conditions. Upconversion under low-light conditions is less well studied in lanthanides. However, a significant fraction of the AB of the TTA molecule lies above the host cell band gap and could not be harvested in a UCSC device. When we consider this constraint, the effective AB of existing TTA materials is about 50 meV, comparable to homogeneously doped lanthanides. The ability to tune the absorption range of TTA materials and to enable their efficient performance within solid (as opposed to liquid) devices remain key challenges.
In comparison with the other materials included in Table 2, the TPU-SC design has the highest AB and energy gain for two-photon upconversion processes under moderate solar concentration, although the precise range is dependent on the choice of wide- and narrow-band-gap materials. Colloidal QD upconverters share the TPU-SC design in using semiconductor heterostructures as the absorber material, but emit high-energy photons into the host solar cell rather than injecting hot electrons. The AB and emission energy gain are comparable. However, colloidal QDUCs are expected to perform better under low-light conditions due to the spatial separation of carriers generated in the absorber QD via a quasi-type II offset. The band gaps of QD materials can also be more easily tuned because they are not constrained by lattice matching or band alignment with the rest of the PV device, as is the case for TPU-SCs.
Comparing upconversion-backed solar cells
We now turn to a review of PV systems that incorporate upconversion materials. As with all solar energy harvesting technologies, the fundamental trade-off is between efficiency (performance) and cost (scalability). The high cost of multijunction PV devices, for example, has restricted them largely to niche markets despite their undisputed superiority in performance. Cheaper, scalable, high-efficiency solar cells can boost market uptake, but only if they can compete with standard Si and GaAs solar cells.Reference Lee and Ebong68 Upconversion systems offer a unique opportunity in this trade-off space: significant improvements in overall system performance (although not as good as multijunction) coupled with promising pathways to scalable production at modest costs (such as solution processing). Upconverters can be combined with “first-generation” solar cells to boost their efficiencies, but in terms of time-to-market may be more likely to thrive in future “third–generation” PV systems.Reference Chu, Cui and Liu69,Reference Lewis70
In general, wider-band-gap solar cells benefit the most from the incorporation of upconverters because upconversion PV devices utilize the solar spectrum in a manner similar to multijunction or IBSC devices.Reference Sellers, Zhang, chen, Zhong, Doty and Zide7 Such wide-band-gap solar cells have historically been less desirable due to low J sc, and thus efficient upconversion materials may provide a pathway to their improved commercial viability. For most PV applications, and especially for thin-film solar cells, upconverters must operate at or below 1-sun conditions. For these applications, solution processable upconversion materials would likely be economically advantageous. Many upconversion materials perform better under higher photon fluxes, and thus concentrator PV devices may be a platform in which more-expensive, but also better-performing, upconversion materials find application.
Because semiconductor upconversion nanostructures have emerged recently, the majority of the work on integrating upconverters into PV devices has been performed with lanthanide and TTA materials. We first review this work and the closely related work on two-photon absorption within host solar cells. We then discuss the opportunities for incorporation of semiconductor upconversion nanostructures in similar device designs and compare the performance and potential performance of these systems.
Lanthanide-backed solar cells
While many lanthanides can sensitize various NIR wavelengths, broad-band sensitization has been a challenge due to their narrow ABs. Still, many proof-of-concept devices have been fabricated to demonstrate the improvement in solar cell efficiency that is possible with upconversion of low-energy photons transmitted through the host solar cell. For example, de Wild et al. applied β-NaYF4:Yb3+(18%), Er3+(2%) to a thin film a-Si:H solar cell and observed a current response of 6.2 µA with a 980-nm diode laser at 28 mW.Reference De Wild, Rath, Meijerink, Van Sark and Schropp11 Although an incident power of 3 W/cm2 was used to illuminate the solar cell, the equivalent of 1.2 W/cm2 reached the upconverter layer. An UC efficiency of 0.05% is estimated, similar to the calculated EQE of 0.03% obtained by normalizing to the typical EQE from backside illumination at 540 nm (62%). Similarly, Van Sark et al. describe up to 0.1 mA/cm2 in current due to upconverted light from 980-nm NIR excitation in lanthanide UCSCs behind a-Si:H wide-band-gap solar cell.Reference van Sark, de Wild, Rath, Meijerink and Schropp71 The incident light absorbed was 3.44 mW/cm2, increasing to 70 mW/cm2 under 20 suns.
TTA-backed solar cells
TTA upconverters have also been shown to improve solar cell efficiency. Several reviews published recently by the Schmidt groupReference Frazer, Gallaher and Schmidt23,Reference Schulze and Schmidt27 cite upconversion efficiencies consistently beyond 60%, with solar cell current improvements (normalized to the square of solar concentration, C) ranging from 0.1 × 10⁻³ mA/cm2/C2 to 4.5 × 10⁻³ mA/cm2/C2. For example, Cheng et al. optically coupled a quartz cuvette of PQ4PdNA (sensitizer) combined with two emitters (BPEA and rubrene), to both an a-Si:H and dye-sensitized solar cell.Reference Cheng, Nattestad, Schulze, MacQueen, Fückel, Lips, Wallace, Khoury, Crossley and Schmidt72 With a upconversion efficiency of 60% for PQ4PdNA, the cell achieved peak enhancements of 6.7–7% under a photon flux equivalent to 1.4 suns concentration for the a-Si:H solar cell. The authors calculate a current density increase of up to 0.1 mA/cm2 at 10 suns for a-Si:H, comparable to lanthanide-backed solar cells.
In general, TTA upconverters have high efficiency due to the long lifetime of the triplet intermediate states that store photon energy. Cheng et al. calculate a 60% probability that two such triplets annihilate to emit a high-energy photon. We will return to this metric in a later section. Furthermore, there is growing interest in using polymeric matrices as a host for photochemical upconverter molecules, currently reaching 20% UCQY.Reference Simon and Weder73 However, the incorporation of solid-state TTA directly into solar cell architectures has yet to be realized. Moreover, while TTA systems can be fabricated to absorb and emit at many different wavelengths, no single system achieves the broad-band absorption that is optimal for solar energy harvesting. Multiple sensitizer/emitter pairs can be combined to create a blended system with broader absorption, but energy transfer between the different species must be considered. Goldschmidt et al. compared TTA and lanthanides side by side and determine that Er+-doped lanthanides outperformed all other materials in terms of net short circuit current density enhancement. However, TTA dominated all other materials in achievable short circuit current density enhancement at 1-sun conditions.
Solar cell comparison
In Table 3, we show the improved J sc and efficiency measured or calculated in upconverter–solar cell tandems. We note that, in practice, low-light conditions have not yielded appreciable improvements in upconverter–solar cell efficiency. However, this seems contrary to the idea that high-efficiency upconverters can be achieved at low-light with long-lived intermediate states. Although electronic states may be long lived, the low current and efficiency improvements relative to their predicted values suggest low photon input into the upconverter system. The limitation, therefore, likely stems from the number of photons absorbed, as internal quantum efficiencies are moderately high (see Table 2). Efforts to improve photon absorption in TTA molecules have led to the use of CdSe QDs as broad-band light harvesters, which improve the net UCQY by a factor of 2.Reference Monguzzi, Braga, Gandini, Holmberg, Kim, Sahu, Norris and Meinardi74 Semiconductor heterostructures, on the other hand, have been shown to have high external quantum efficiencies.Reference Schnitzer, Yablonovitch, Caneau and Gmitter75 However, these structures can also be limited by a low concentration of absorbers, as seen by the low TPU-SC ∆J sc with high ∆EQE, which suggests a low concentration (1010 cm−3) of InAs QDs. While low concentration will also limit the performance of QDUCs, the improved low-light absorption and wide AB are predicted to result in improved solar cell efficiencies competitive with and potentially surpassing those of other upconverter–solar cells.
Best performing (experimental and model, as indicated) UCSCs for each upconverter material type.

a Experiment conducted using sub-band-gap illumination on AlGaAs solar cell.
b Calculated assuming 90% iUQE.
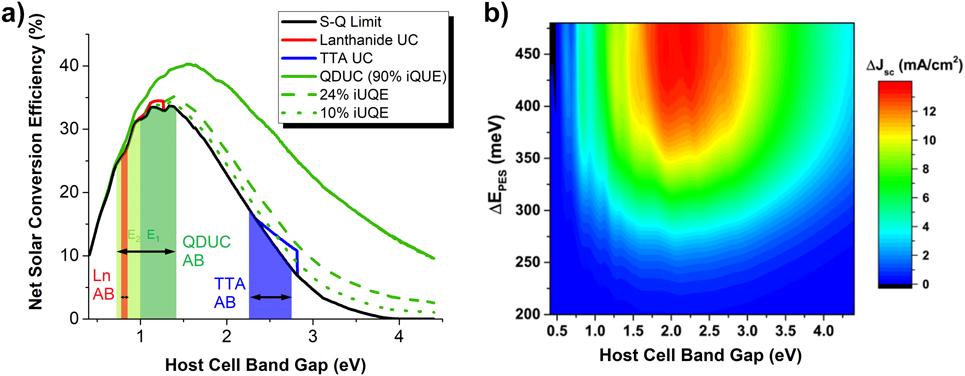
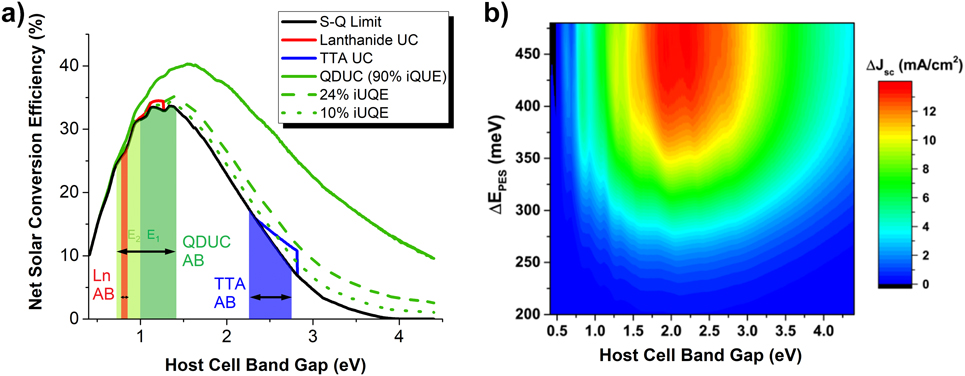
Using the kinetic rate model from Chen et al. and Zhang et al., we generate an estimate of the minimum iUQE required for semiconductor nanostructures to be competitive with the best lanthanide and TTA upconverters.Reference Shockley and Queisser43 The results are presented in Fig. 16. The theoretical iUQE limit of semiconductor upconverters is 96%,Reference Shockley and Queisser43 but these models, as discussed above, likely do not yet include all the relevant loss mechanisms. In Fig. 16, we therefore consider iUQE values of 90%, 24%, and 10%. At an iUQE of 24%, semiconductor upconverters show improvements in net solar energy conversion efficiency equivalent to those that could be achieved in lanthanides and TTA. The potential performance of the lanthanide and TTA materials are calculated theoretically using their measured spectral ranges and external upconversion quantum efficiencies (lanthanides: 19.8%,Reference Richards and Shalav66 TTA molecules: 60%Reference Cheng, Fückel, MacQueen, Khoury, Clady, Schulze, Ekins-Daukes, Crossley, Stannowski, Lips and Schmidt24,Reference Ogawa, Yanai, Monguzzi and Kimizuka76 ). At 10% iUQE, semiconductor upconverters would achieve several percent improvement, relative to the Shockley–Queisser limit, as a result of their broad spectral utilization. Furthermore, the potential improvement in short circuit current density at 1 sun in these nanostructures exceeds 12 mA/cm2 (assuming an iUQE of 90%), which exceeds the maximum improvement possible in PQ4PdNA and rubrene-backed solar cells (0.4 mA/cm2).
(a) Calculated increase in solar cell efficiency of homogeneously doped lanthanide UCs,Reference Osborne, Blood, Smowton, Xin, Stintz, Huffaker and Lester64 TTA UCs, and QDUCs (at 90%, 24%, and 10% iUQE), with shaded red, blue, and green regions indicating corresponding respective ABs. The green region is subdivided in two for mid-energy (E 1, dark green) and low-energy (E 2, light green) ABs, assuming a GaAs host solar cell and a PES of 450 meV. (b) Current density increase for QDUC-backed solar cells at varying PES. Adapted from Ref. Reference Cheng, Nattestad, Schulze, MacQueen, Fückel, Lips, Wallace, Khoury, Crossley and Schmidt72.
Current limitations of the QD upconverters in the work by MillevilleReference Milleville, Chen, Lennon, Cleveland, Kumar, Bork, Tessier, LeBeau, Chase, Zide and Doty56 and DeutschReference Deutsch, Neeman and Oron54 stem from three major factors: (i) the lack of passivation of surface states in the colloidal nanostructure, (ii) a low PES value between the rod band gap and the emitter band gap, and (iii) the lack of precise control over nanostructure composition based on the synthesis method. Passivation of colloidal nanostructures with a ZnS shell generally improves the PL quantum yield by more than 50%.Reference Dabbousi, Rodriguez-Viejo, Mikulec, Heine, Mattoussi, Ober, Jensen and Bawendi77 In more recent studies, the PLQY of organic ligand-passivated CdTe QDs improved from 24% to 92% with the addition of a CdS shell.Reference Wang, Long, Zhang, Zhong and Zhu78 Moreover, several groups have reported higher PLQY and crystal quality when applying a ZnS shell to CdSe/CdS core/shell QDs.Reference Lim, Chon, Joo and Shin79,Reference Talapin, Mekis, Götzinger, Kornowski, Benson and Weller80 The work of Deka et al., Drijvers et al., and Hadar et al. can be followed to apply these passivation techniques to rod-like structures to improve their PLQY and applied to QDUCs to improve iUQE.Reference Deka, Quarta, Lupo, Falqui, Boninelli, Giannini, Morello, De Giorgi, Lanzani, Spinella, Cingolani, Pellegrino and Manna81–Reference Hadar, Philbin, Panfil, Neyshtadt, Lieberman, Eshet, Lazar, Rabani and Banin83 A low PES can be improved by changing the composition of the rod and emitter band gap offsets. Currently, the maximum PES (i.e., difference in rod/emitter band gap energies) in the CdSe(Te)/CdS/CdSe system is approximately 300 meV. If the emitter is replaced with PbS, the PES becomes approximately 500 meV larger.Reference Zhao, Fan, Liang, Selopal, Gonfa, Jin, Soudi, Cui, Enrichi, Natile, Concina, Ma, Govorov, Rosei and Vomiero84 Based on the work reported in Milleville et al., and assuming a compositionally graded rod layer, the increased PES would result in more than 80% absolute improvement in iUQE. Furthermore, growing embedded nanostructures via MBE and using the III–V system could enable a higher iUQE nanostructure at lower PES, as seen in Fig. 8(a), based on reduced radiative and nonradiative losses at interfaces and surfaces.
Recent advances in lanthanide, TTA, and other upconversion techniques
Methods to characterize bifacial solar cells have improved our understanding of the potential challenges of incorporating upconverter materials behind the solar cell via spin coating and gel application.Reference Pan, del Cañizo and Luque85 For example, designs that would improve the host cell such as back-surface texturing must be reevaluated when adding an upconverter. In addition, the opaque back contact of typical solar cells cannot be used, which suggests the use of transparent conducting oxides.Reference De Wild, Rath, Meijerink, Van Sark and Schropp11,Reference Cheng, Fückel, MacQueen, Khoury, Clady, Schulze, Ekins-Daukes, Crossley, Stannowski, Lips and Schmidt24 Because upconverters typically emit light isotropically, there could be additional losses without an adequate back reflector. This effect has been studied using TTA in a liquid crystal (LC) cell to improve the use of upconverted light via directed emission.Reference Börjesson, Rudquist, Gray and Moth-Poulsen86 The authors dissolved several molecular dyes in E7, a commercial LC mixture, and observed coupling between upconverted emission and LC orientation via switching with an applied electric field. Furthermore, polarization-dependent measurements showed that the physical LC orientation affected upconversion emission polarization, with 52% of molecules becoming perfectly oriented along the same axis as the LCs. The authors suggest that asymmetric upconverters will have the highest coupling to LCs. This suggests that high aspect ratio, core/rod/emitter QDUCs could have significantly higher emission normal to the device plane when combined with LCs. To improve coupling of incident, low-energy light with upconverters, Lu et al. used a 1D silver nanograting to support surface plasmon resonance, improving iUQE [defined by Lu as the ratio of the energy transfer upconversion (ETU) rate to the NIR transition rate] in NaYF4:Yb3+,Er3+ from 36% to 56%.Reference Lu, Mao, Cho, Ahn and Park87 Specifically, when the plasmon resonance is equal to the incident excitation frequency, the ETU rate (i.e., the product of the energy transfer coefficient and excited-state population) increases 2.7-fold, relative to low-energy radiative and nonradiative decay processes. Sensitization of lanthanides using organic, IR dyes such as IR-806 leads to further improved absorption across more visible spectral bands,Reference Goldschmidt and Fischer25,Reference Zou, Visser, Maduro, Pshenichnikov and Hummelen88 with 3300× increase in the integrated spectral response (in the absorption range 720–1100 nm), and 1100× increase in peak upconversion PL intensity (at 800 nm). These strategies for sensitization, plasmonic enhancement, and directed emission can also be applied to II–VI and III–V semiconductor nanostructures and are likely to result in improved upconversion device efficiency.
Conclusions
We have introduced the concept of semiconductor QD heterostructures as upconversion materials for PV applications. We discussed the origin of sequential two-photon “two-band” upconversion in these semiconductor QDUCs and reviewed the current state of the art for their design and realization. We used several upconverter performance metrics to compare them to other upconverter materials that are also of interest for PVs. The computational models we review illustrate the potential for “two-band” semiconductor upconversion nanostructures to outperform other upconversion materials for PV solar energy harvesting. However, there is clearly a substantial gap between the presently observed iUQE for semiconductor upconverters (0.002%) and the 1–10% required for a significant improvement in net solar energy harvesting. Engineering nanostructure composition and structure to overcome the factors limiting iUQE, as described in sections “Semiconductor upconversion nanostructures: from proof-of-concept to state-of-the-art” and “Comparing upconversion materials for PV applications,” is therefore critical to the realization of the potential of these materials for improved solar energy harvesting.